Swing Algo V1This indicator can be used for e.g. swing algorithmic trading. It will give Buy/Long and Sell/Short signals on the chart. This algorithm uses a combination of several (custom) functions and rules to find good entry points for trend trading. After many iterations and tests I came up with this particular setup, which is highly optimized for the $ETH/$USD trading pair on the daily (D) timeframe. It is however possible to change algorithmic parameters within the indicator settings to tune this swing algorithm for other assets and timeframes. You don't need any programming skills or similar abilities to navigate this indicator.
Also you can choose the backtest time interval to test the perfomance of this algorithm for different time windows and different trading pairs. Here various backtesting parameters (e.g. trading fees) can be customized. Additionally to the TradingView Strategy Tester you can also plot your equity directly on the chart to get a sense for the performance. For this you can also scale the equity graph to e.g. match the starting point of your equity with some price point on the chart to get a direct comparison to 'Buy & Hold' strategies over time.
Note: In general it seems that cryptocurrencies are rather swing-algorithm-friendly, while I cannot recommend trading classical assets like stock or indices (e.g. S&P 500) with this indicator (although you can of course try to find good setups).
This indicator (and all other content I provide) is no financial advice. If you use this indicator you agree to my Terms and Conditions which can be found on my twitter profile linked in my signature.
Swingtrade

Bullyena SignalsWhat is Bullyena Signals?
-It is an indicator that aids the trader in making entry/exit decisions.
-Note that this is optimized for swing traders but you can also use this for scalping.
-The algorithm contains multiple modern indicators and some of them are proprietary.
Bullyena Signals usage:
-Gives entry/exit signals
-Shows the trend of the price using a bar color overlay.
-Shows trailing stops
-Shows buy/long and take profit signals
-Ichimoku cloud for trend confirmation
Installation
- For candlestacks, make sure to Right click > Settings > Symbol > disable wicks and borders.
Access and Documentation
- Message or PM me to know how to get access

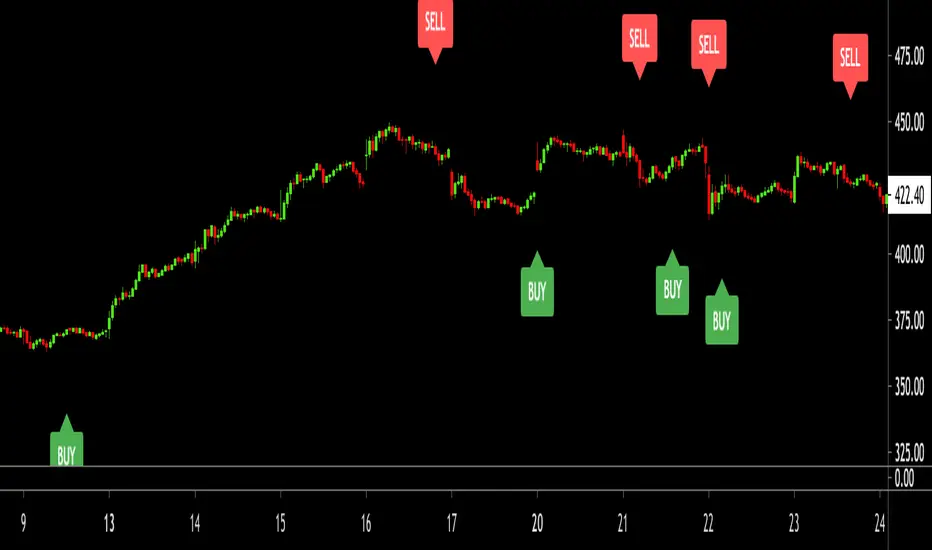
Swing Trade Pros - Buy/Sell SignalsThe STP Buy/Sell Signals are real-time indicators that accurately show the swings in the market. When the shorter average crosses the longer average in the upward direction it triggers a Buy signal. and when crossing in the downward direction signals a Sell signal. You also have the ability to set up alerts to maximize your profit. With these signals it will help to reduce risk and easily recognize market patterns.

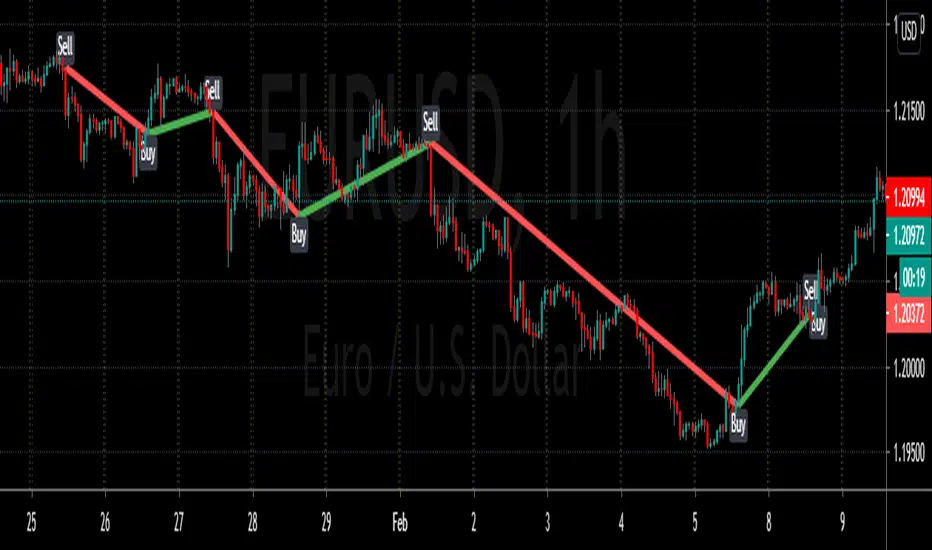
scalping signalshere is a scalping indicator that give you signals with different ways..
share with me your idea for improving it...


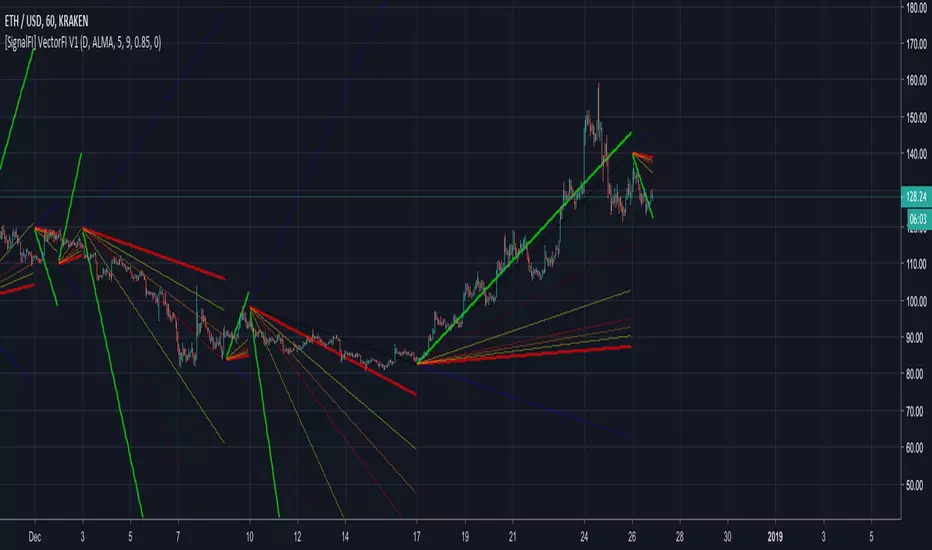
[SignalFI] VectorFI V1Fibonacci Based Fan Projections based on alternate timeframes.
IDENTIFY SUPPORT & RESISTANCE
IDENTIFY PRICE CHANNELS
MOMENTUM TRENDING ANALYSIS
SignalFI was created to help traders and investors to effectively analyze the market based on the Golden Mean Ratio (Fibonacci numbers), plan a trade and ultimately execute it. To help inform and educate market decisions we developed a set of Trading Indicators which are available on TradingView , the most advanced and yet easy to use charting platform available on the web.
SignalFI indicators are just that, indicators. Our indicators are generally configured to use completely historical data (negating repaint), and we advise all alerts created with SignalFI indicators to be fired upon "close" of the current candle. Our indicators can provide valuable context and visualization support when performing market analysis and executing buy and sell decisions. However. we are not financial experts, and all information presented on this site or our other media outlets are for educational purposes only.
For subscription information, visit www.signalfi.net and follow us on twitter.
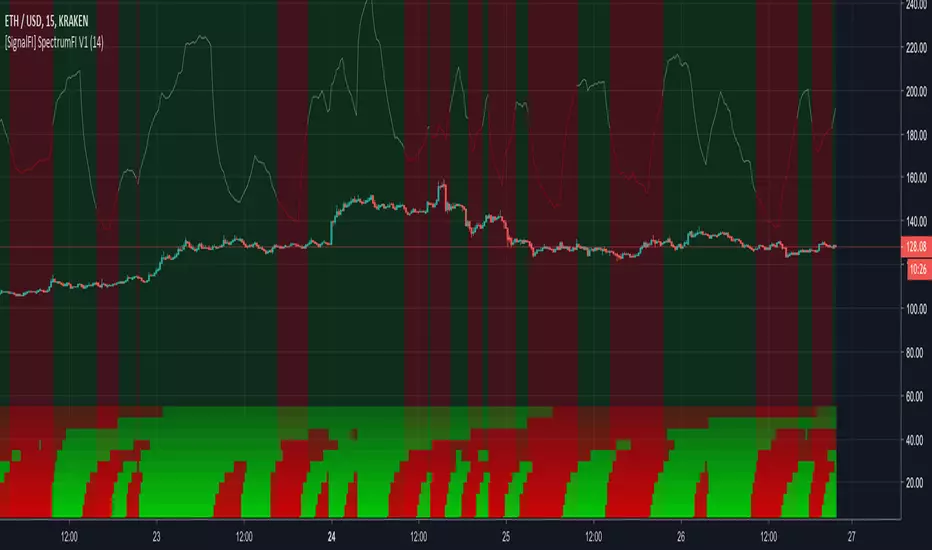
[SignalFI] SpectrumFI V1SpectrumFI uses 11 independent Fibonacci based moving averages and their associated momentum to create a unified trend signal.
FIBONACCI BASED TREND DISCOVERY
DIFFERENCE STATISTICS COMBINED WITH RSI MOMENTUM
HEATMAP AND RSI INDICATORS BUILT INTO ONE TRADINGVIEW INDICATOR
SignalFI was created to help traders and investors to effectively analyze the market based on the Golden Mean Ratio (Fibonacci numbers), plan a trade and ultimately execute it. To help inform and educate market decisions we developed a set of Trading Indicators which are available on TradingView , the most advanced and yet easy to use charting platform available on the web.
SignalFI indicators are just that, indicators. Our indicators are generally configured to use completely historical data (negating repaint), and we advise all alerts created with SignalFI indicators to be fired upon "close" of the current candle. Our indicators can provide valuable context and visualization support when performing market analysis and executing buy and sell decisions. However. we are not financial experts, and all information presented on this site or our other media outlets are for educational purposes only.
For subscription information, visit www.signalfi.net and follow us on twitter.
SFP screener (stop runs and swing failures)Identify stop runs/ swing failures on multiple securities simultaneously.
There are currently three options.
Custom input – input up to 10 symbols of your choosing
Crypto – top 10 symbols on Bitfinex
Forex – top 10 forex pairs
Runs using my SFP alerts indicator . The setting options are the same as in that indicator and you can use that to identify and test the best settings for your needs.

SMMA FIB S/R + EMA Cloud - 6 Hour Swing - THE OASIS GROUP
This is a Swing Trade Chart Based on the 3EMA / 21 EMA / 55 EMA Cross Clouds.
The 4 Hour and the 6 Hour are the preferred Time Frames, mainly on the 6 Hour.
Aqua signifies Bulls and the 2 toned Aqua signifies a strong up trend.
Fuchsia signifies Bears and the 2 toned Fuchsia signifies a strong down trend.
Black Cross - Death Cross
Blue Cross - Golden Cross
We use SMMA as the support and resistances.
Fibonacci numbers are used here to mimic natural movement and to
have cleaner Moving Averages.
These moving averages can be used on any time frame.
Just check off the EMA Clouds.
Fuchsia - 21 SMMA
Lime - 55 SMMA
Blue - 144 SMMA
Red - 233 SMMA
Orange - 377 SMMA
Black - 55 EMA
Aqua/Fuchsia - 21 EMA (this EMA switches colors as it crosses the 55 EMA)
When the crosses occur always remember to keep proper stop losses and move them up according to your profit taking plan.
Crosses are meant to indicate a possible direction change, so use proper TA to analyze your positions and possible entries.
This is not a foolproof plan, but a great swing trader tool if you begin to know and understand it.
Exclaimer:
We don't give any Financial advice, this is pure entertainment value and should be taken as such. Enjoy!
THE OASIS GROUP


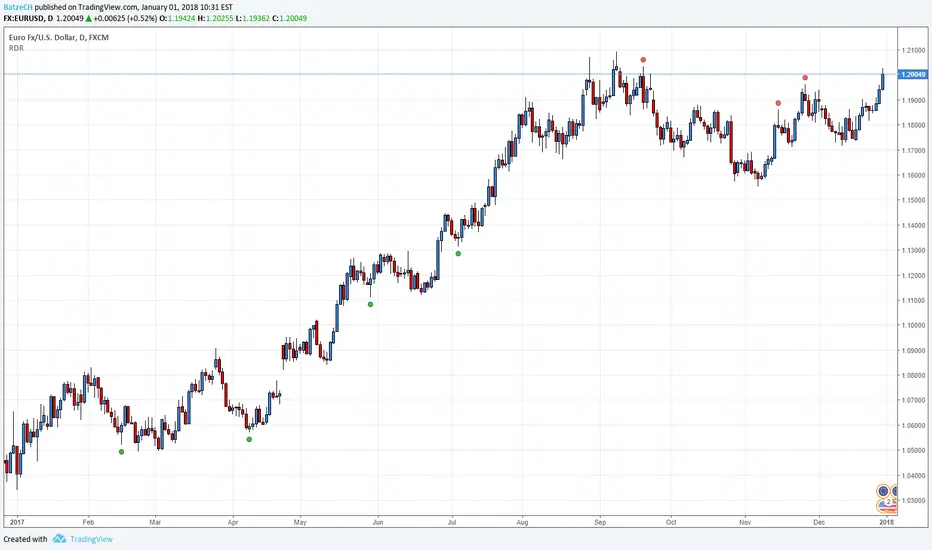
Red Dog Reversal PatternThis indicator is a interpretation of the Red Dog Reversal Pattern which was discovered by T3Live founder Scott Redler. (AFAIK)
The indicator is maybe useful for Day Trade or Swing Trade.
BUY Criteria:
1. Stock is down for multiple days
2. Stock goes below prior day's low
3. Stock trades back up through prior day's low, which triggers the buy
4. The stop is set at the current intraday low
SELL Criteria:
1. Stock is up for multiple days
2. Stock goes above the prior day's high
3. Stock trades back down through prior day's high, which triggers the sell
4. The stop is set at the current intraday high
Please always remember, there is no holy grail indicator!
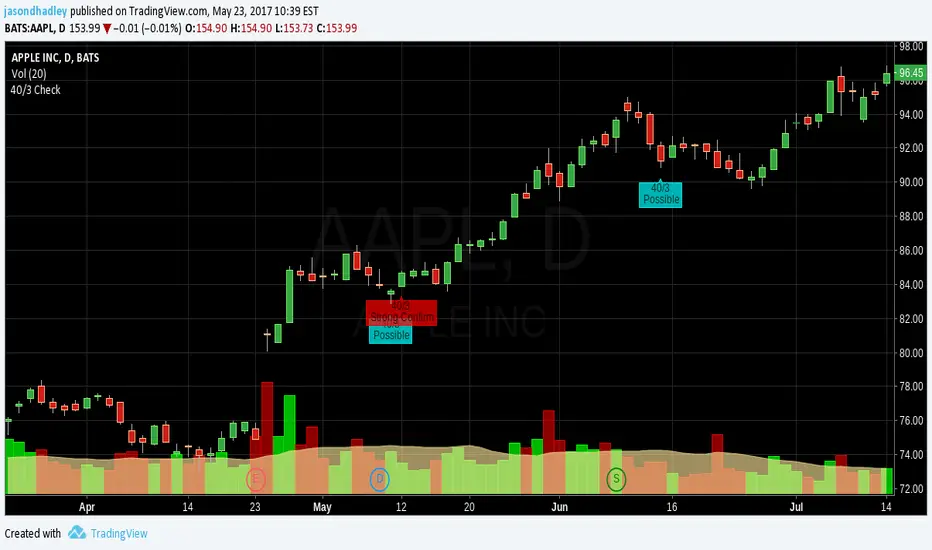
40/3 Swing IndicatorThis indicator is developed using the basic rules of 40/3 swing trading.
Rule #1 - New high for the last 40 days
Rule #2 - 3 Consecutive days of the close being lower than the previous day
Rule #3 - 4th days closing price is greater than the previous day
When all 3 Rules are met, it will create the Aqua colored label indicating that the 40/3 criteria is met and a reversal is possible.
Rule #4 - 4th days closing price is within the top 25% of that days high/low range.
When Rule #4 is also met, it creates the Red label indicating that there is a very strong chance the reversal has begun.
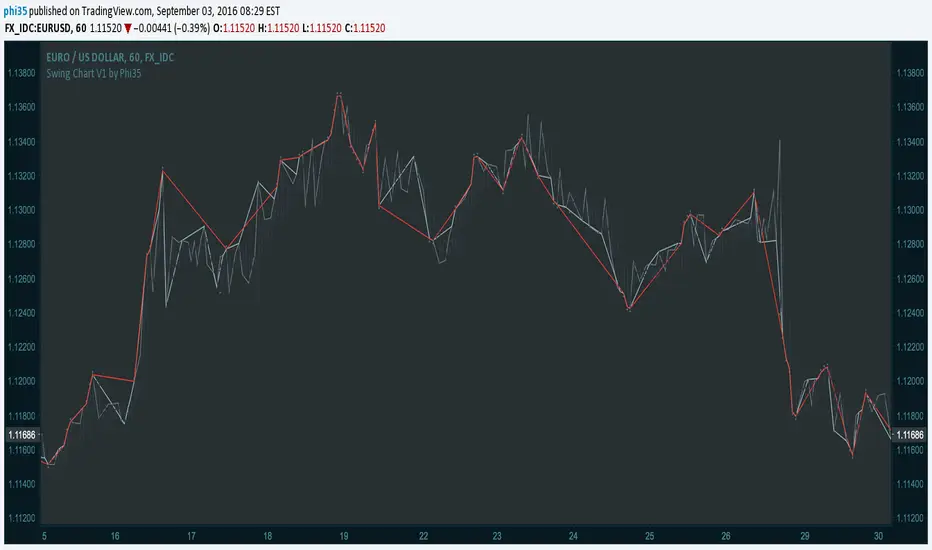
Swing Chart V1 by Phi35 © With this indicator, which plots the swing chart of the 3 degrees, swing traders can automate their work of tracking the right bars.
How it works:
Minor Degree (one bar) (gray)= If the current high is higher than the previous high or the current low is lower than the previous low.
Intermediate Degree (two bar) (baby blue)= If the current high is higher than previous and the penultimate high etc.
Main Degree (three bar) (red)= If the current high is higher than the previous, the penultimate and the high before penultimate high etc.
Alert:
On crossover there will be an alert (popup with a message) and in addition you will see "diamonds" on the place where the crossover took place
If there is an issue or any suggestions, feel free to contact me. Do not modify the code without permission.
Swing Chart V1 by Phi35 ©
JPY GBP ROCsRate of change of most volatile JPY and GBP pairs. All pairs ending in JPY are red except GBPJPY (colored yellow --currently most volatile 7/2016). GBPNZD is blue, the other GBP pairs are green, lime and teal. GBPJPY and GBPNZD are my favorite day trading / swing trading pairs. This script allows me to see the action of the most volatile and liquid pairs on one screen. JPY pairs (ex-GBPJPY) are all red so that I see the flow of JPY not so much each pair and its name. Global movement of JPY is what I am after. Same for the coloring of GBP pairs as green expect GBPNZD as blue. ***** EURGBP is plotted as an opposite (with a negative in front of its sma. EURGBP is extremely correlated to GBPNZD, I decided to plot it also.
