Auto Linear Trend Target x16Experienced traders always tell us that “Never trade against the trend.” or “Trend is our friend.”. Yes sure, no one wants to trade against the trend. However, there are a lot of trends with different types and cycles, then which trend to follow, which trend they are mentioning? This tool (also known as ALTT x16, Laser Net x16) will support us in identifying different linear trends with different cycles. Nearest history-based targets are also added for our convenience of completeness.
Markets: All.
Timeframes: All. Recommendation: 30m and above.
Periods: Up to 16.
Usage: The higher period of a trend, the more strength it has. Enter when price breakouts a trend line and exit at the nearest trend line and target.
Target

Spinn ATR targetNot quite the usual approach to plotting targets on the chart, where the price will come with a given probability.
The indicator draws targets by studying the ATR of the target timeframe. More precisely, this is not exactly an ATR - the price move is taken from the closing price of the previous bar and is calculated both up and down separately.
The settings specify the percentage used to calculate the price move, at which the specified percentage of bars reached this price move in the past.
Simply put, if we set 50% in the settings, this means that a line will be drawn at the level at which the price reached this level in 50% of cases over a given period.
--
Не совсем обычный подход к построению целей на графике, куда цена придет с заданной вероятностью.
Индикатор рисует цели, изучая ATR целевого таймфрейма. Точнее, это не совсем ATR - ход цены берется от цены закрытия предыдущего бара и считается отдельно как вверх, так и вниз.
В настройках задается процент, исходя из которого вычисляется ход цены, при котором заданный процент баров достигал этого хода цены ранее.
Проще говоря, если мы задаем в настройках 50%, то это означает, что будет построена линия на том уровне, на котором цена в 50% случаев за заданный период достигала этого уровня.

No-lose trading targets (Based on MFI) By Mustafa ÖZVERThis code shows expected reaction target prices after sudden moving based on MFI . Red area means the price is on overbought area, green area means the price is on oversold area. If you see red area under price, you can make short option to next to the horizontal beginning price of red area. If you see green area over price, you can make long option to next to the horizontal beginning price of green area.
When this code works
- The green area starts where mfi value is on oversold
- The red area starts where mfi value is on overbought
Of course, this code may be failed, do not forget the target may never come. But hopefully price will cross over the target.
And you (as developers) can develop this code by using anything instead of mfi to get up-down target prices.
But only this values can not guarantee good results for trading. BE CAREFUL

ATR BandsIn many strategies, it's quite common to use a scaled ATR to help define a stop-loss, and it's not uncommon to use it for take-profit targets as well. While it's possible to use the built-in ATR indicator and manually calculate the offset value, we felt this wasn't particularly intuitive or efficient, and could lead to the potential for miscalculations. And while there are quite a few indicators that plot ATR bands in some form or another already on TV, we could not find one that actually performed the exact way that we wanted. They all had at least one of the following gaps:
The ATR offset was not configurable (usually hard-coded to be based off the high or low, while we generally prefer to use close)
It would only print a single band (either the upper or lower), which would require the same indicator to be added twice
The ATR scaling factor was either not configurable or only stepped in whole numbers (often time fractional factors like 1.5 yield better results)
To that end, we took to making this enhanced version to meet all of the above requirements. While we were doing so, we decided to take this opportunity to also make some non-functional enhancements as well:
Updated the indicator to the most recent version of Pine
Updated the indicator definition to allow alternate (non-chart) timeframe usage
Made the input types explicitly defined to improve consistency
Updated the inputs with appropriate minimum values and step sizes where appropriate
Separated settings into logical groups
Added helptext to the indicator settings noting usage and common settings values
Explicitly titled the on-chart plots of the ATR bands so that they can more easily be identified and referenced in other indicators/scripts, as well as the Data Window
Food for thought : When looking at some of the behaviors of these ATR bands, you can see that when price first levels out, you can draw a "consolidation zone" from the first peak of the upper ATR band to the first valley of the lower ATR band that price will generally respect. Look for price to break and close outside of that zone. When that happens, price will usually (but not always) make a notable move in that direction, which can be used as either a potential trigger or as an additional confluence with other indicators/price action.
Finally, while we have made what we feel are some noteworthy updates and enhancements to this indicator, and have every intention of continuing to do so as we find worthy opportunities for enhancement, credit is still due to the original author: AlexanderTeaH

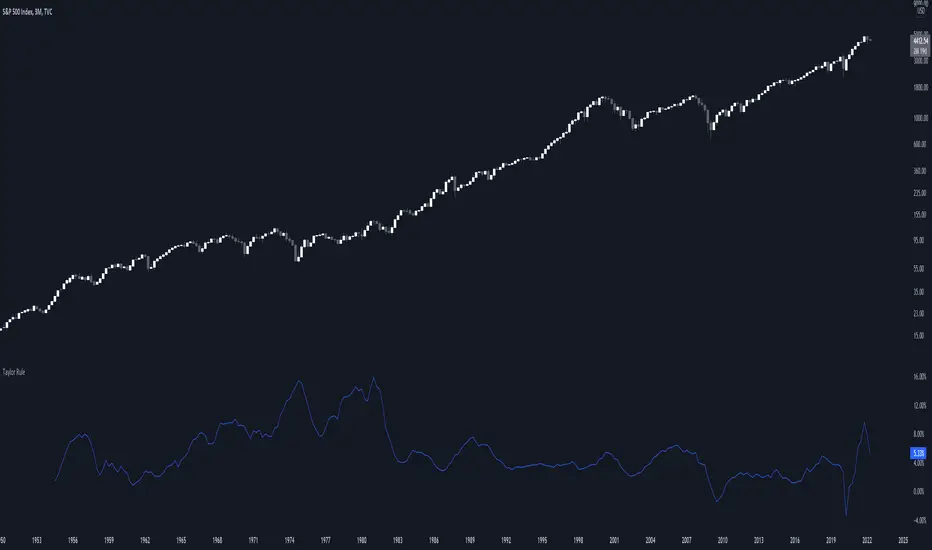
Taylor RuleThe Taylor rule is a simple formula that John Taylor devised to guide policymakers. It calculates what the federal funds rate should be, as a function of the output gap and current inflation. Here, we measure the output gap as the difference between potential output and real GDP. Inflation is measured by changes in the CPI, and we use a target inflation rate of 2%. We also assume a steady-state real interest rate of 2%.
[TT] Daily Levels
These pivots are based on calculations that i have been using for quite some time. I'm sure There is no need to explain on how to use pivots.
Labels are given to understand and you can Msg me here or comment if u need any explanation.
I have given few examples below.. check i t out
XAUUSD
BTCUSD
Nifty
Banknifty
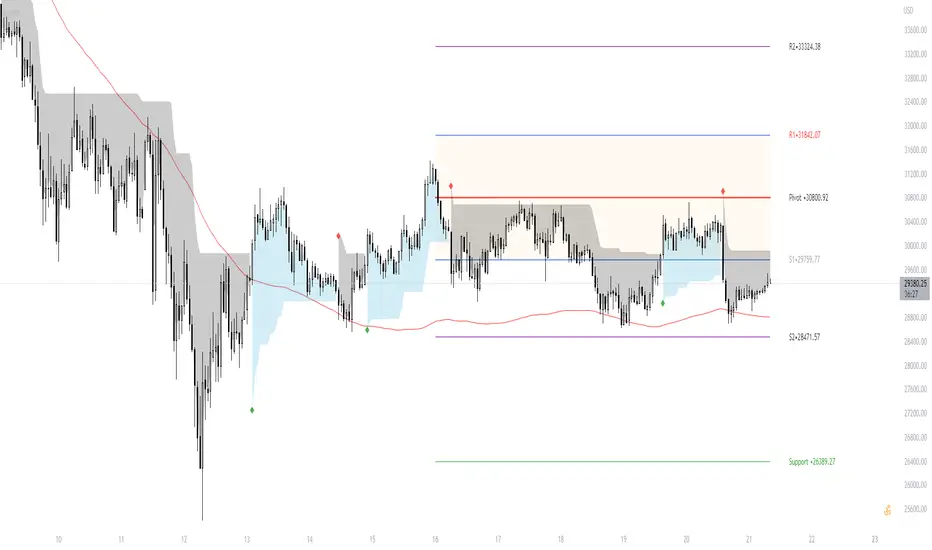
Bias Pivot PointA simple indicator that uses Pivot Points as a filter and to generate a Directional Bias .
How to use this indicator?
1. Directional Bias
Bullish => Closing Price > Pivot Point
Bearish => Closing Price < Pivot Point
2. Support / Resistance
Each Pivot Points can be used as Support or Resistance
3. Take Profit Targets
Each Pivot Points can be used as targets for taking profit

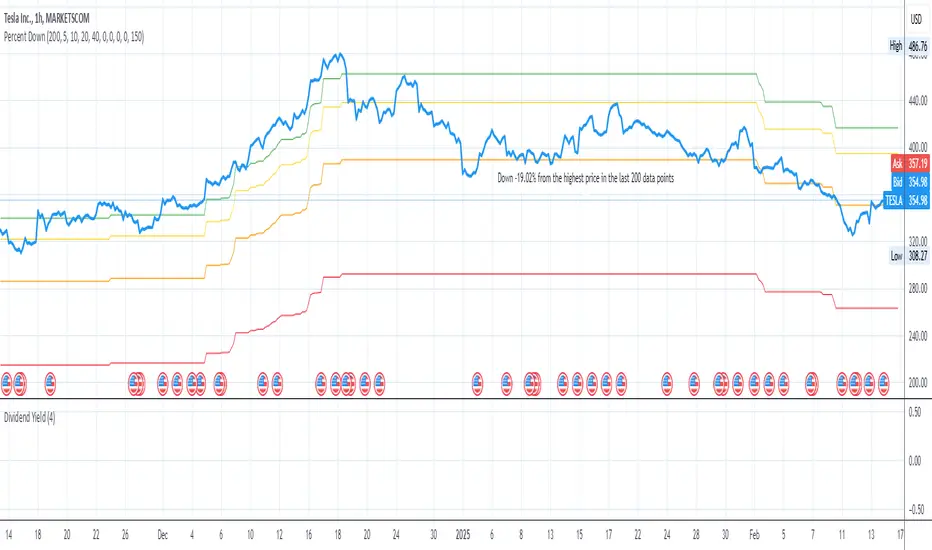
Price Target Pullback Correction or BearPrice Target percent drop is an indicator that allows you to set default percentage down from the 52 week high.
A pullback, correction, bear and a bear market is marked as a 5%, 10%, 20% or 40% drop from the 52 week highest price, so this will show the target price to buy at if these thresholds are hit.
You can change the default values of 5%, 10%, 20% and 40% to any percentage and the price will reflect the change of the default value. Furthermore, the default to use 52 weeks can be changed to find the highest price from the last 26 weeks or 104 weeks.
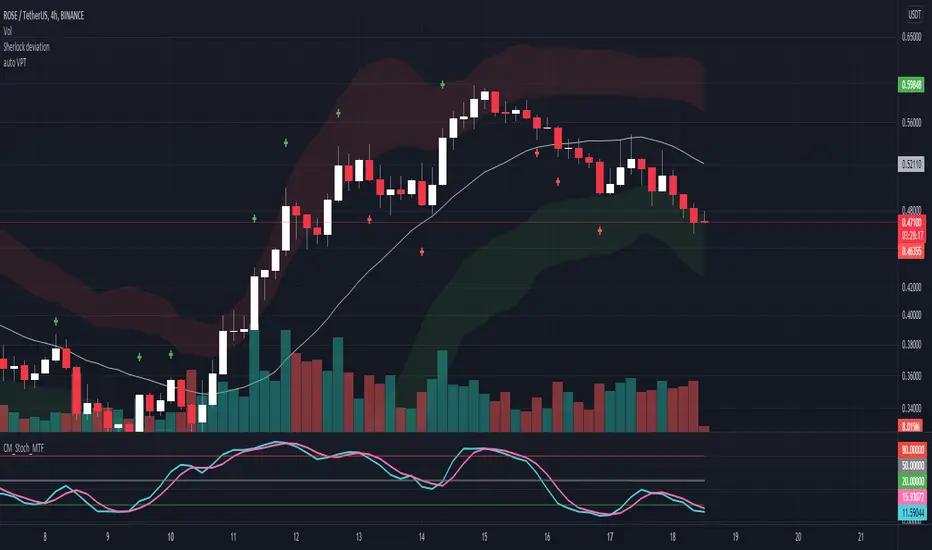
Auto VPTWhenever the volume of a candle is at or over 1.5 times the previous volume, it automatically places a cross on the Volume Price Target (candle range projected from the close) of the candle with abnormal volume.
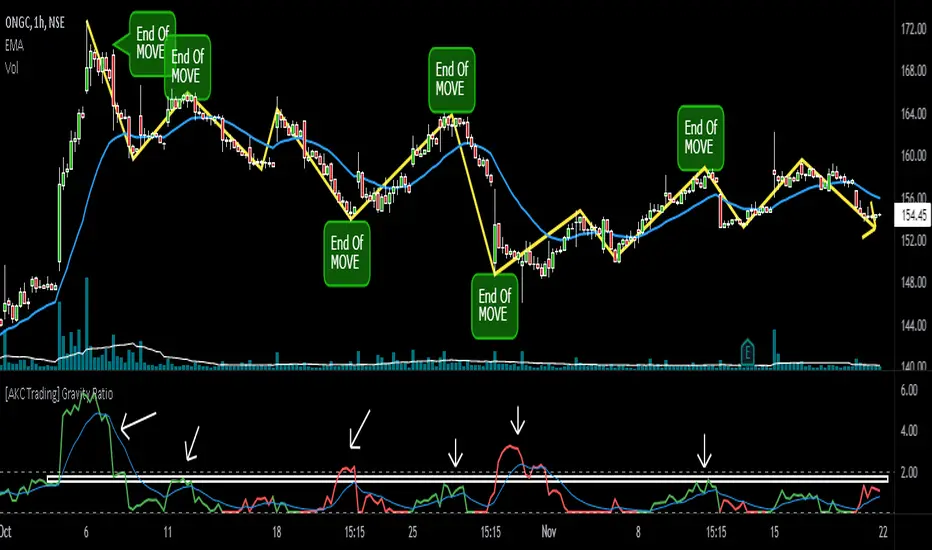
[AKC Trading] Gravity RatioGRAVITY RATIO must be used for taking PROFIT and EXIT from the trade.
1) Whenever Gravity Ratio value is near or more than 2 (general limit), it is assumed that move is extended and traders should look for booking out some or full profits (as per their initial trade plan)
2) Gravity Ratio considers length of price movement. And every stock has its own behavior, so it is advisable to look at the indicator and see on what prior values of Gravity Ratio, the move ended and use that value as zone to plan your exit.
For example, in the chart shown, instead of standard value of 2, this particular stock have seen be start exhausting around 1.5-1.8 zone. Once the Gravity Ratio reaches near to this value, a trader must used price action to trail their SL and should book (partial or full) near its pre-defined Target (Take Profit) levels.
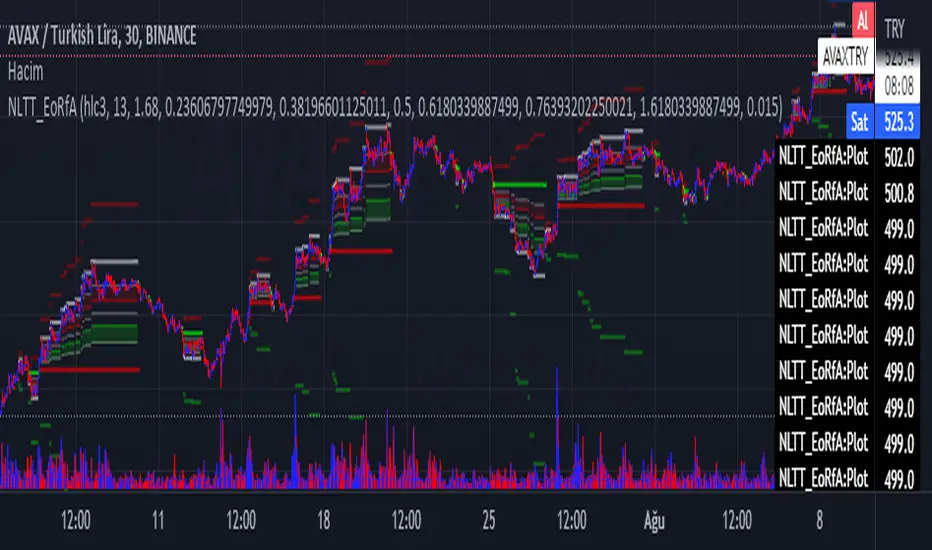
No-lose trading targets (Based on EoRfA) By Mustafa ÖZVERThis code shows expected reaction target prices after sudden moving based on (EoRfA) Escaping of Rate from Avarage. Red area means the price is on overbought area, green area means the price is on oversold area. If you see red area under price, you can make short option to next to the horizontal beginning price of red area. If you see green area over price, you can make long option to next to the horizontal beginning price of green area.
When this code works
- The green area starts where EoRfA value is on oversold
- The red area starts where EoRfA value is on overbought
Of course, this code may be failed, do not forget the target may never come. But hopefully price will cross over the target.
And you (as developers) can develop this code by using anything instead of EoRfA to get up-down target prices.
But only this values can not guarantee good results for trading. BE CAREFUL
Exhaustion ZonesOur Indicator “Exhaustion Zones” offers an insight into the expected Volatility of any given Instrument applied to. Understanding Volatility is essential for using this Indicator. If you are familiar with the concept, then you will most likely find this indicator useful in your trading. If you are unfamiliar with the concept and are interested in this topic, then continue reading a “Brief Concept of Volatility” at the end of the description, where we will provide some informational Links.
This description will provide a High Level description of how our Indicator identifies and visualizes Exhaustion Zones, followed by how to use the Indicator in your trading. At the end we would like to introduce our team and experience.
High Level Description of “Exhaustion Zones”:
Our indicator is predicting the expected market volatility for a predefined period based on recent historical Volatility, which will be referred to as “Period Volatility” from now on. Currently there are two Predefined Periods…
...a daily period, which starts from 21 UTC for the next 24 hours.
...a weekly period, which starts from Sunday 21 UTC for the next 7 days.
Our indicator calculates an expected volatility for the respective period and informes you, the trader, how large the price range could be. The indicator calculates “Exhaustion Zones” using the Period Volatility, which is a multiple (1x, 2x and 3x) of the Period Volatility, based on the Period High/Low. Basically, adding the multiple of the Period Volatility to the Period Low would equate to the “Upper Exhaustion Zones”, and subtracting the multiple of the Period Volatility from the Period High would equate to the “Lower Exhaustion Zones”.
Visualisation:
Our indicator needs to display 2 states …
…price range is SMALLER than predicted Period Volatility. An example would be, a daily period has just begun, and the Daily range is small, hence the Daily range is smaller than the predicted Period Volatility. This state will be referred to as “Moving Exhaustion Zones”
...price range is GREATER than predicted Period Volatility. An example would be, a market has experienced a shock leading to a huge price change and exceeding the Period Volatility. This state will be referred to as “Locked Exhaustion Zones”
What do the Boxes mean:
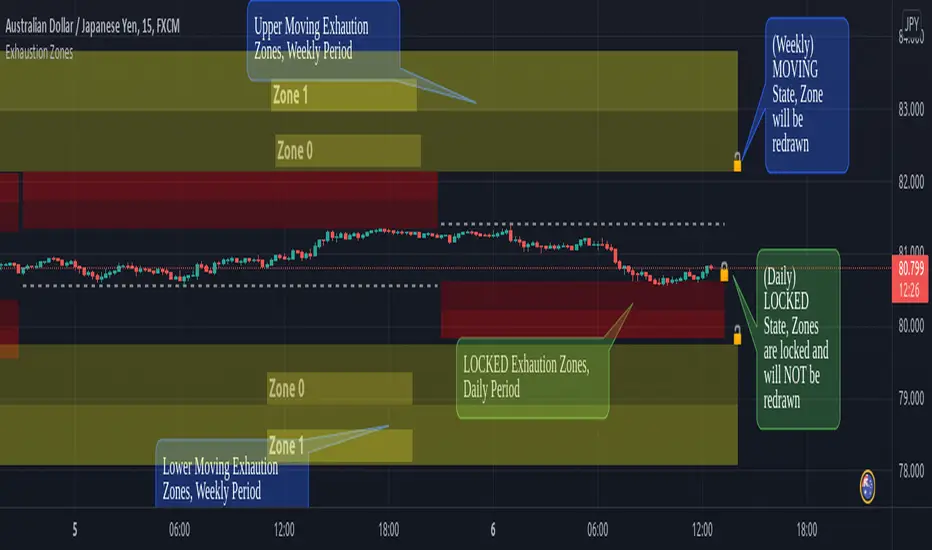
Our Indicator displays 2 different Periods - Daily and Weekly. The Daily period is displayed with a red accent color, whereas a weekly Period has a yellow accent.
The Boxes themself display the “Exhaustion Zones”. Each period displays upto 4 Exhaustion Zones - 2 Upper Exhaustion Zones, 2 Lower Exhaustion Zones, each having a “Zone 0” and “Zone 1”.
Moving Exhaustion Zones
Moving Exhaustion Zones displays 4 Exhaustion Zones. These Zones are based on the Period High/Low and are NOT locked, and can still be redrawn. As prices make new Period Highes and Lows, exhaustion Zones will be adjusted. This state is visualized by the Open Lock on the right side of the current Exhaustion Zone.
Locked Exhaustion Zones
Locked Exhaustion Zones display 2 Exhaustion Zones and a dashed Line. Price has made its move and has exceeded predicted Period Volatility. Exhaustion Zones are locked and will NOT be repainted from now on. This state is visualized by the closed Lock on the right side of the current Exhaustion Zone.
How to use it:
The Exhaustion Zones indicator is a mean reverting Indicator. That being said, when Price approaches/enters a Zone, the assumption is that Price will either slow down, or reverse.
The Exhaustion Zone is displayed as 2 Sub-Zones: Zone 0 and Zone 1. As Price continues through the Zones without a reversal, the potential for a reversal increases.
We recommend using this Indicator with a reversal Trading Strategy familiar to you.
Furthermore, this Indicator is well suited as a Target. You can use the Exhaustion Zones to define your Target or where you would like to remove partial Profits.
Important
Please note, that the indicator itself just presents price areas where there is a potential for a price reversal, and that these Zones should not be traded blindly
Time frame:
This indicator is programmed to be used on all Timeframes lower than Weekly Timeframes.
Instruments:
This indicator aims to visualize areas of where Market price has the potential to reverse, hence making this a mean reverting Indicator.
Taking this statement to account, it is recommended to apply this Indicator to Instruments with a mean reverting character.
Examples of mean reverting markets could be for example …
...all FOREX instruments, as FOREX is considered a mean reverting Market.
...an instrument that is in a consolidation, or which you are expecting to enter a period of consolidation.
Indicator settings and configuration:
The Indicator has no functional parameters, to reduce User error, and only has visual parameters. The color of the Zones can be tailored to your liking.
Furthermore you have decided what you would like to display on your chart:
… Display Weekly Zones
...Display Daily Zones
...Show History
...Show Zone States.
Brief concept of Volatility:
Volatility is a concept that has been around for a very long time. Following links are helpful to get a grasp of the concept:
en.wikipedia.org(finance)
www.investopedia.com
Our Team:
We are a team of 3 Traders with a co mbined experience of 40 years. We are using our experiences from the market to create Indicators to Visualize the most relevant Patterns to us in our trading today. Our goal is to reconstruct these patterns to match our understanding of the market and to simplify the process of creating reproducible trading Strategies.
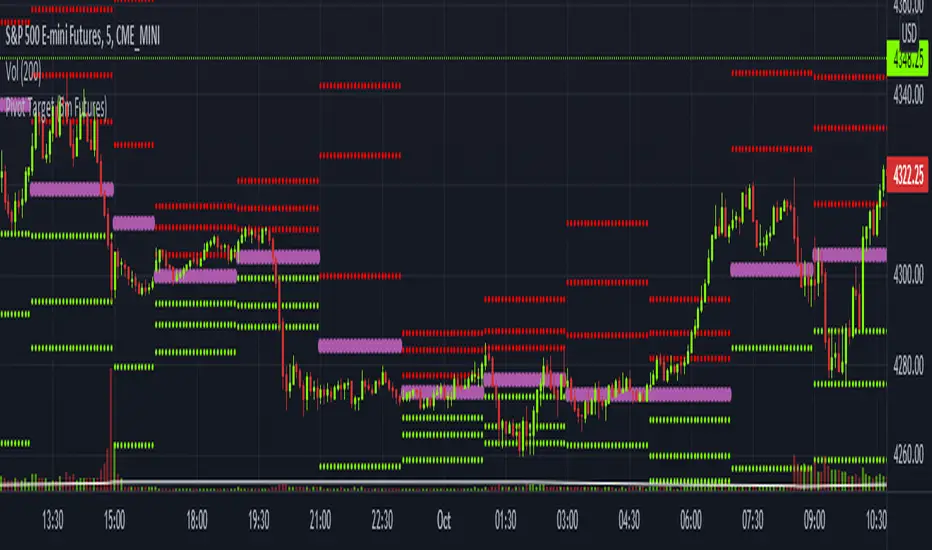
Pivot Target (5m Futures)I am new to both Futures Trading and Pivots. Looking for shorter-term profitable opportunities, I have investigated the use of pivots from a higher timeframe. All the work of this script is performed using two lines. It calculates the pivot from the previous 2-hour bar and draws this pivot line on the 5-minute timeframe. Many many times, the price will reach back to this pivot point - sometimes fairly quickly within the same horizontal pivot line and sometimes farther out (4-hours to 6-hours, or within the next few days). Price tends to reach the level around ninety percent of the time, making for plenty of short-term trading opportunities.
I get the best results when I see the price rise or fall from the pivot, along with a second indicator indicating a possible reversal (my favorite is Divergence for Many Indicators v4 by LonesomeTheBlue . Who knew divergence (both regular and hidden) was so common and useful for finding probable reversals? If I find the price above or below the pivot line with a second signal, I'll place a buy or sell within that same 2-hour window the price tends to return back to the higher timeframe pivot for a nice profit very quickly. Other times it does take a little longer to return with only a small percentage of time not returning within a reasonable amount of time, or very unusually, not at all. The image above shows a number of profitable trading opportunities using a combination of the Pivot Target and LonesomeTheBlue's Divergence for Many Indicators v4. You can further limit risk by only taking trades that are in the same direction of the overall trend, possibly confirmed on a higher timeframe.
This script will only be visible on the 5-minute timeframe the way it is written right now. I wouldn't suggest shorter or longer timeframes unless some editing is done by you. It doesn't seem to work as well with stocks, but is best on Futures due to the wave-like natures of the futures market. Trade safe, trade with the trend, use stops and limits appropriately and stay safe.
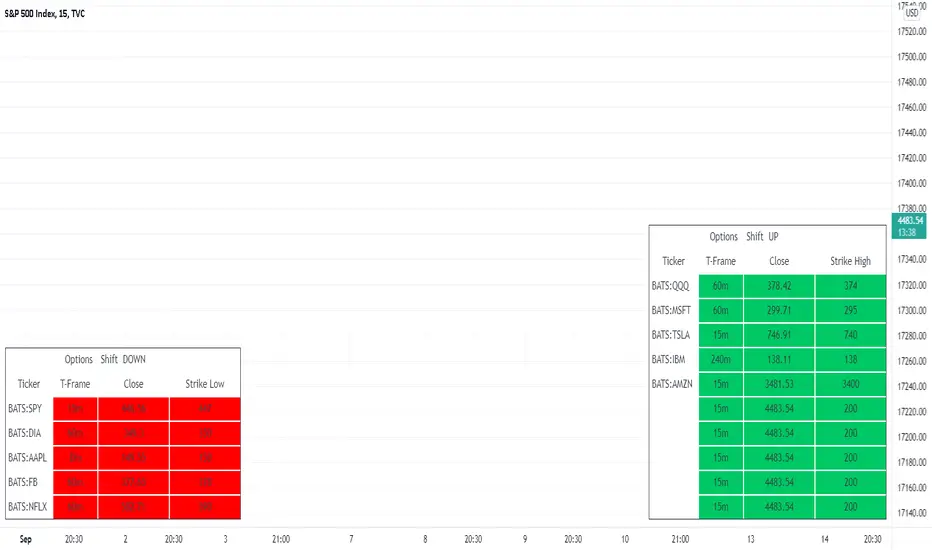
MTF - Options Strike Price - Screener & AlertsHi fellow traders ,
Pleased to share an MTF – Option Strike Price Screener.
It Screens 15 tickers for your set Strike Prices in the input column or you can also set the Stop Loss/target prices for your portfolio watch list in a single input window.
All you need to do is attach to any chart and set the periodicity of the to your desired alert() frequency requirement.
Now go to the input settings icon of the script and set your tickers, timeframe and option strike prices or if you would like to track your individual ticker stop loss or target prices!
Set the alert from the menu as usual click - Any alert() function call and bingo you are done!!
In all of 2-3 minutes you can set your Option Strike Alerts or TP’s or SL’s for 15 stocks of your portfolio..
Only a single alert() will track 15 tickers across multiple time frames..
Once your Alert is hit you may need to change the input settings and save as default and again set an alert() and delete the last alert()..
No more opening multiple charts and setting individual time consuming alerts().
Happy trading with TV..
No-lose trading targets (based on RSI) By Mustafa ÖZVERThis code shows expected reaction target prices after sudden moving based on RSI. Red area means the price is on overbought area, green area means the price is on oversold area. If you see red area under price, you can make short option to next to the horizontal beginning price of red area. If you see green area over price, you can make long option to next to the horizontal beginning price of green area.
When this code works
- The green area starts where rsi value is on oversold
- The red area starts where rsi value is on overbought
Of course, this code may be failed, do not forget the target may never come. But hopefully price will cross over the target.
And you (as developers) can develop this code by using anything instead of rsi to get up-down target prices.
But only this values can not guarantee good results for trading. BE CAREFUL

MultiPrice AlertThis is an alert script using Pinescript version 4. This enables one to set 5 alerts (1 StopLoss, 4 Targets), on 3 different symbols, at using a single alert in the UI.
Every visible line will only appear on the symbols that are selected. After setting targets when making an alert, select this indicator as a condition. Change the name to whatever you want, usually the names of the set of tickers.
The Alert message is dyanmic showing which Symbol with each type of alert, at whatever price.
Ability to disable the targets + symbols.
Alerts work by Stop Loss crossing under price and Targets Cross Over. Enabling the "Short" Targets reverses this.
The line that is being displayed is actually the price of the asset being moved over x number of bars. I have not found a way to plot a traditional horizontal line, as the code for it uses a fixed price.
As it being a user input, it is a variable. Any help with this would be appreicated.
Alerts are set to once per bar.
Known bug that sometimes if the prices that you set are inside the current candle stick, then your alert will immeaditally fire, either change the timeframe or let it fire and wait fo
After a target is hit, I reccomend setting the alert to 0 and REMAKING the alert. You MUST REMAKE THE ALERT AFTER ANY CHANGES. This script WILL NOT CHANGE ALERTS AS YOU CHANGE SETTINGS.
TradingView Alerts are not this smart , at least I haven't found a way to do this yet.

MultiAlert, MultiTargets + TickersThis is my first script, completely made from scratch. Bear with me.
Script that allows one to set an alert for Multiple Price Levels, on Multiple Tickers, complete with Dynamic Messages showing you which ticker, at which price, at which alert (Stop loss, Target 1 etc.), set to Once Per Bar.
Select Ticker, type in price levels that you have for targets & stop loss, move on to the next, or don't and leave 0 and blank.
Disable the targets you do not need in STYLE tab to disable plotting & scaling, leave unused tickers & targets blank & 0.
Create Alert, select this indicator, anyfunction() alert.
MAKE SURE to remake the alert every time you change something, they are not smart enough to change as you change things. Can Confirm by using the numbers in the alert name. You will also have to set the profit level or stop loss to zero every time it triggers to avoid triggered again.
In fact, you do not need the indicator active at all. Add it to a chart and hide it by clicking on the little eyeball icon, to make an alert open the settings for the indicator and type in your targets like normal. Indicator will remain invisable.
I have not found a way to dynamic message the alert name, or else I would.
DISCLAIMER: NONE OF THIS IS FINANCIAL ADVICE. You are completely responsible for whatever happens to you. Do not use the targets in this chart. Do your own research before trading.
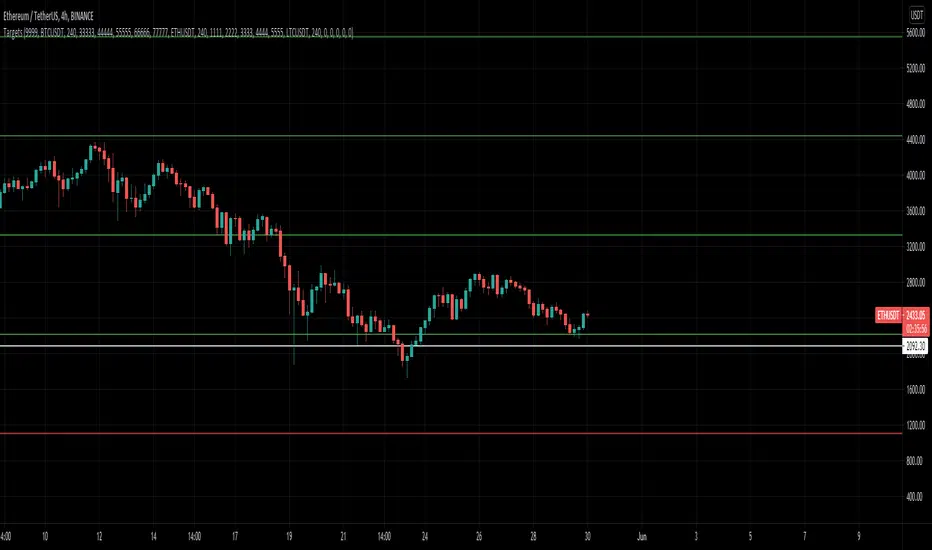
TargetPredictorThis indicator is very easy to use, but it is still good to follow some basic rules when using it.
Whatever time frame you use, it is always necessary to wait for a particular candlestick to complete. Only in this way can we reach certain conclusions.
You can use the indicator in both directions. When a particular currency rises and when a particular currency falls. If it happens that the targets are marked in the opposite direction than expected, go to settings and check "Reverse".
Horizontal lines represent future targets. The most important of these is the “Turning Point,” which represents the dividing line between the continuation of a trend or its rejection.
If it happens that the candlestick ends above the “Turning Point” the continuation of the trend to the first target is very likely. When the candlestick exceeds the first target, it is the turn of the second target, etc.
Enjoy using the indicator and get in touch with any comments :-)

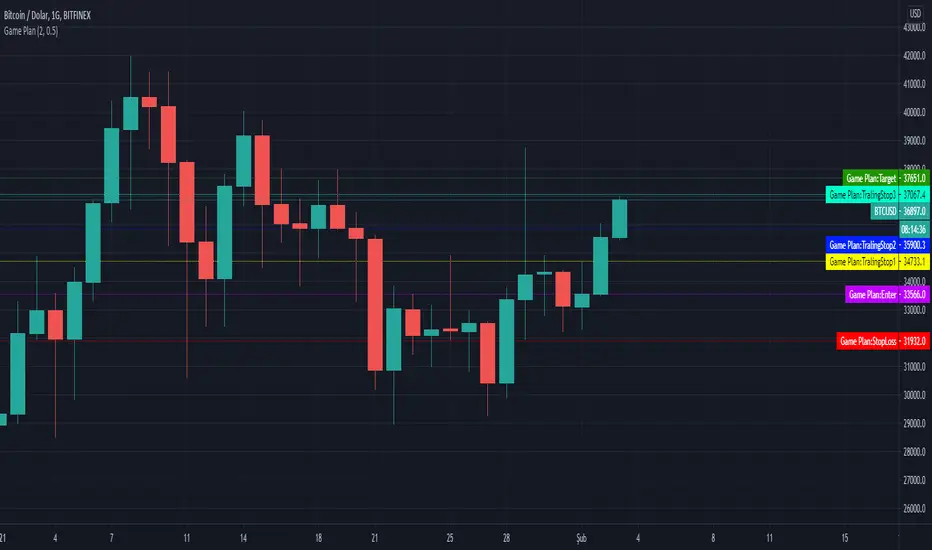
Game PlanAllows to automatically calculate Ali Persembe's, who wrote Teknik Analiz mi Dedin? Hadi canım sende, Game Plan Strategy
What is the Game Plan?
ALi Persembe claims, If you create a game plan for yourself and follow this plan completely, you will increase your profit. He tells that there is nothing to surprise you when your stop loss and target is determined in your game plan. You only need to follow this plan.
How does the indicator work?
It helps you determine your target price and stop point according to the risk ratio you will take on the basis of Atr, regardless of technical analysis.
The minumum risk ratio is calculated as 0.5 Atr according to the Atr 14 period. It automatically sets 2.5 times the risk ratio taken as your target price.
With this game plan, the more goals you reach by trading, the more profitable you will be. By reaching your target at risk ratio, you can determine the stops that follow the
Allows you to move your stoploss level up.
You can change your risk rate in the indicator settings. Minumum risk rate can be 0.5 maximum can be 5.
You can also choose the time you want to calculate your game plan from the indicator settings. Calculation can be made up to 100 bars before.
This indicator helps you to set a target on the basis of ATR, independent of technical analysis.
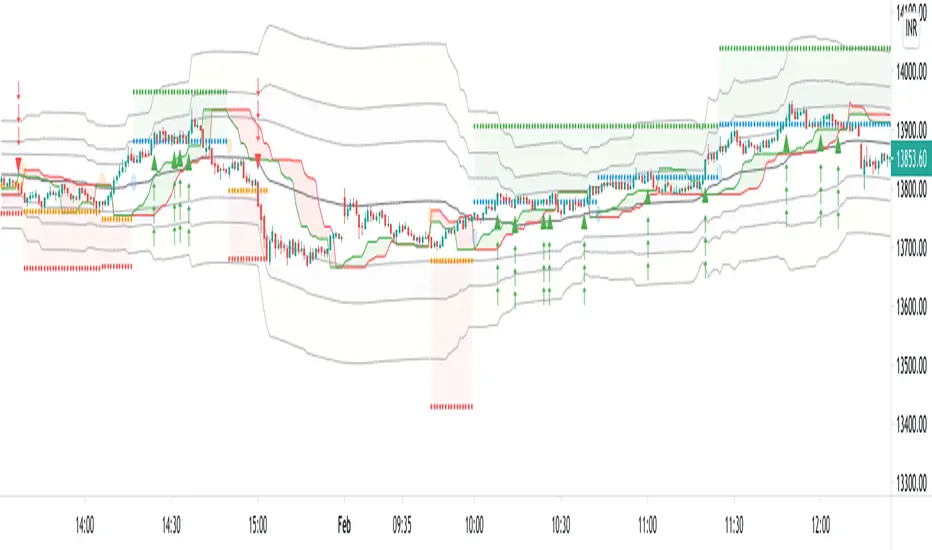
FibBand, Perfect Trendline Trader and Target SystemSo, Dear Friends, I am open-sourcing one of my scripts which I created as a thesis project,
The Auto Trader System is a Scalping Tool , to be used mostly in intraday Setups!!
and is designed using,
1. Fibonacci Bands
Fibo Bands are Calculated by defining dynamic Fibonacci Pivots Lines over a history of Lookup values (Default is 89 periods lookback),
The bands help in identifying the Target Points for the setup
2. Perfect TrendLine Setup
The script uses PTS, as a filter to define the optimum entry and exit points
Which timeframe it works for ?
Works for Any Time Frame, but Intraday setups are good!
Who is this System for ?
Beginner and Intermediate Traders
Provision For Alerts
The Script has provision for both long and short alerts!!
Enjoy!
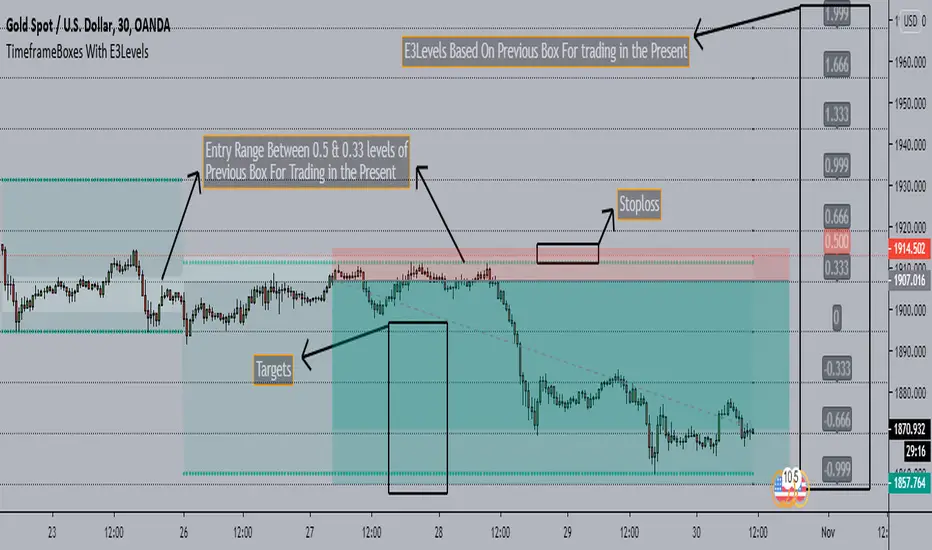
TimeframeBoxes(DailyBox) With E3Levels - SaeedKhakestar Method*** This is a Repaint Indicator that uses HIGH & LOW of Previous Range in the Custom Period(12H,1D,2D,3D & Weekly) for Trading In the Present with E3 Levels
TimeframeBoxes(DailyBox) With E3Levels - SaeedKhakestar Method
Version 1.00
Created by TWA_TradeWithAmir(TWA_PriceActionTips)
Updated 10/29/2020
Based On SaeedKhakestar Method(Trigger Price Action)
*With Entry Range
*With E3 Levels
*12H,1D,2D,3D & Weekly Boxes
*Entry Range & E3 Levels Belongs to Previous Box
*TRex Method
DTC_ZoneThis Indicator can be used for finding the supply and demand zone. Supply and demand has been fetched from the past 10 days volatility of the particular stock. And the main thing is the target and stop-loss were arrived based on the Fibonacci retracement.

SECRET EESSecret EES is a Pivot Based indicator that shows Entry Price, Target Price, and Stoploss.
This is not exact Pivot Points or CPR. These ranges are corrected for better accuracy and better results.
The chart is divided into Three Zones - No trade Zone, Long Zone, and Short Zone.
Each line indicates the Entry, Exit, and Stoploss for at least one of the zones.
Works Good in Equity.
It also works on Index Charts.
Recommended time frame 15 mins.
Only for Intraday Trading.
THIS IS NOT REGULAR PIVOT POINTS. PLEASE USE CAREFULLY.
