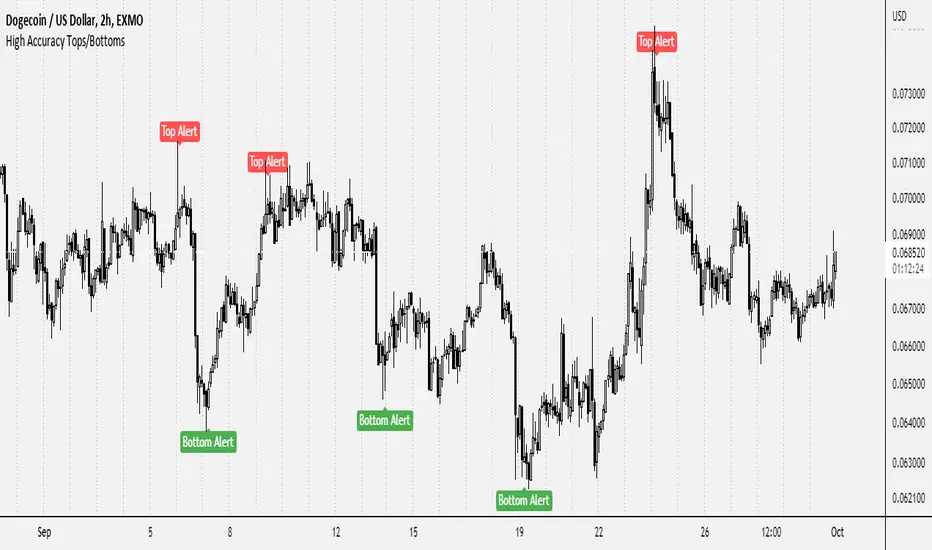
High Accuracy Tops/BottomsThis script may be TradingView's most accurate tops & bottoms indicator ever published.
Since it's experimental, I'm going to offer access to it free of charge. Send me a direct message requesting access.
5 years ago I joined TradingView and began studying price and the factors behind what causes bottoms and tops to form as well as how to find them. Fascinated by it, I spent years researching and discovered lot of different concepts that play an instrumental role with tops and bottoms: Market structure, price reactions, S/R , and much more. Through tons of experimenting, I ended up discovering a variety of NEW methods of identifying tops & bottoms. Through the years I've built up a script that has enabled the process for identifying tops and bottoms within the market to be much more convenient.
This is currently experimental and still has a lot of potential for improvement. The objective of the indicator is to help identify absolute tops and bottoms, and so far it does a great job whenever it provides a signal. It works for practically all types of securities, and surprisingly, even if they are in illiquid markets.
This indicator does NOT repaint whatsoever.
Below are a few examples of it across different security types as well as different timeframes:
Bitcoin
Gamestop (GME)
Luna / TetherUS
Crude Oil (Commodities)
Even spanning back centuries:
The indicator should be used for the following:
-Helping find potential entry points
-Timing trades and improving risk management
-Assisting with plotting top/bottom support and resistance levels
-For higher timeframes, use in conjunction with market news or global headlines
-For lower timeframes, use in conjunction with other indicators/trading tools
This is not a buy & sell indicator.. This is a TOOL to help identify accurate entry points and craft decisions based upon it.
Soon, I will be providing an updated version of it. It will include explicit details surrounding how it works and it's functions. My aim is to provide some level of value to the TradingView community in return for the great insight Tradingview and other platforms have insighted me with over price action.
Topfinder
Horns Pattern Identifier [LuxAlgo]The following script detects regular and inverted horn patterns. Detected patterns are displayed alongside their respective confirmation and take profit levels derived from the pattern measure rule. Breakout of the confirmation levels are highlighted with labels.
This script is a continuation of the educational idea regarding horns patterns.
Settings
Threshold: Controls the maximum allowed slope of the line connecting two horns, with higher values allowing a higher slope.
Usage
Horn patterns are chart patterns introduced by Bulkowski in his book "Encyclopedia of Chart Patterns". We covered this pattern in the following post: Horn Tops & Bottoms Patterns - How To Find and Trade Them
The script allows the user to quickly determine the presence of a regular or inverted horn pattern, alongside automatically displaying the confirmation level and take profits associated with a detected pattern. These are calculated based on the rules described by Bulkowski.
Horn patterns are highlighted by a line connecting the horns, the dotted lines represent the confirmation level, once the price crosses this level a label will appear, either bullish or bearish depending on the detected pattern. The dashed line represents the take profit level.

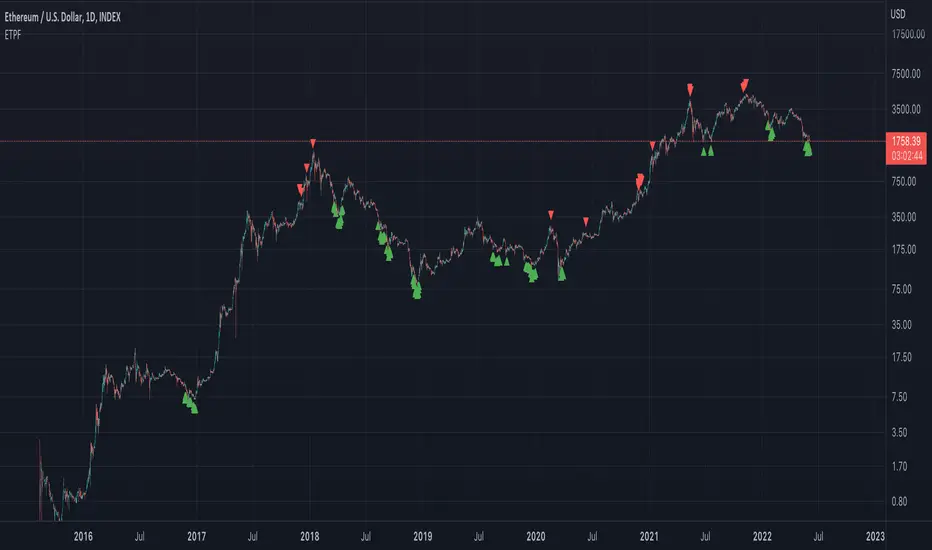
Exponential Top and Bottom FinderThis is an indicator to identify possible tops and bottoms after exponential price surges and drops, it works best on ETH 1D, but you can also use it for bitcoin and altcoins.
It's based on stochastic first and second derivatives of a close moving average
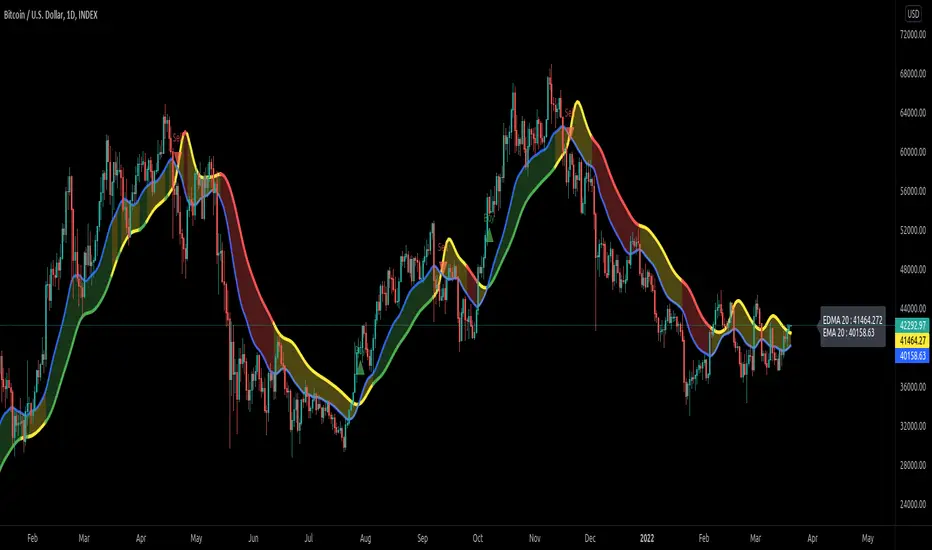
Exponentially Deviating Moving Average (MZ EDMA)Exponentially Deviating Moving Average (MZ EDMA) is derived from Exponential Moving Average to predict better exit in top reversal case.
EDMA Philosophy
EDMA is calculated in following steps:
In first step, Exponentially expanding moving line is calculated with same code as of EMA but with different smoothness (1 instead of 2).
In 2nd step, Exponentially contracting moving line is calculated using 1st calculated line as source input and also using same code as of EMA but with different smoothness (1 instead of 2).
In 3rd step, Hull Moving Average with 3/2 of EDMA length is calculated using final line as source input. This final HMA will be equal to Exponentially Deviating Moving Average.
EDMA Advantages
EDMA's main advantage is that in case of top price reversal it deviates from conventional EMA of 2*Length. This benefits in using EDMA for EMA cross with quick signals avoiding unnecessary crossovers. EDMA's deviation in case of top reversal can be seen as below:
EDMA presents better smoothened curve which acts as better Support and resistance. EDMA coparison with conventional EMA of 2*length of EDMA is as follows.
Additional Features
EMA Band: EMA band is shown on chart to better visualize EMA cross with EDMA.
Dynamic Coloring: Chikou Filter library is used for derivation of dynamic coloring of EDMA and its band.
Alerts: Alerts are provided of all trade signals. Weak buy/sell would trigger if EMA of 2*EDMA_length crosses EDMA. Strong buy/sell would trigger if EMA of same length as of EDMA crosses EDMA.
Trade Confirmation with Chikou Filter: Trend filteration from Chikou filter library is used as an option to enhance trades signals accuracy.
Defaults
Currently default EDMA and EMA1 length is set to 20 period which I've found better for higher timeframes but this can be adjusted according to user's timeframe. I would soon add Multi Timeframe option in script too. Chikou filter's period is set to 25.
[UPRIGHT Trading] Top & Bottom Finder [Premium]Hello Traders,
Today I'm releasing an updated version of my previous Top & Bottom Finder (M.Right_Top & Bottom Finder 1.0).
The timing of this release couldn't be more perfect with everyone trying to 'find the bottom'. And the increased volatility that we've been seeing as of late.
Essentially, my indicator uses volatility and standard deviations among other things to assist you in finding the top or bottom of trends. You may also notice that it uses a lot of different strength indicators to provide an additional layer of complexity and confirmation.
Not just an RSI, but an RSI ema, smoothed OBV RSI's, and other volume RSI's. This is a truly unique and powerful tool for any Trader - whether you've just started or you've been trading for 20 years, I'm confident you will find value in the UPRIGHT Trading Top & Bottom Finder.
How to use it:
When it detects the trend Bottoming or Topping the histogram will change color. Bottom - Green/blue, Top - Red, (different shades of colors for different types of detection).
I've spent several hours tweaking the calculations and filters to enhance the accuracy, so this will be a noticeable upgrade from my original Top & Bottom Finder.
The length of the histogram bar can be an indication in itself, especially when it lines up close to one of the plotted lines and has noticeable direction change following this.
I've added a lot of text and pictures to help display it's capabilities, features, and customizability.
As always, it's fully customizable with alerts. Can toggle any thing on or off, and change the colors to suit your style.
3 Unique RSI's, different colors on the histogram will show different levels of detection. Some are more accurate in some timeframes than others. Bright Green and Bright Red are the most different from the rest.
I've jam-packed this indicator with Buy/Sell and Confirmation Signals and even background highlights (with colors that can mesh together). Feel free to find what works best for you.
RSI color indications and background highlights aid in confirmation. Also, as mentioned previously, sometimes a gray bar will land on a Fib and it will be a bottom signal.
The above chart should look like this
Good luck Traders,
Cheers,
Mike
(UPRIGHT Trading)

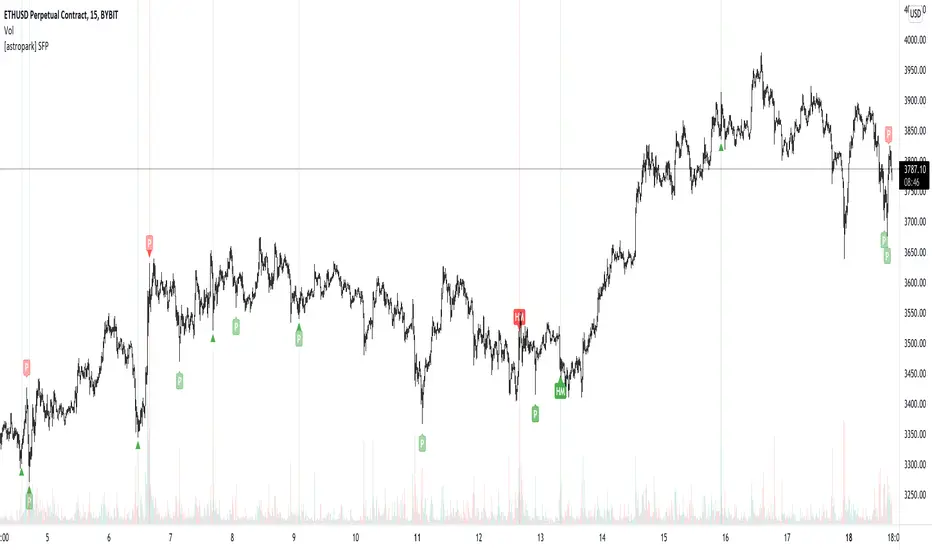
[astropark] SFP - Swing Failure PatternDear Followers,
today I'm glad to present you my Swing Failure Pattern Analyzer indicator.
As you know, the Swing Failure Pattern (SFP) is a very powerful candlestick pattern, because it highlights trend reversal points : if trend changes you want to know it, right?
This indicators highlights for you both Tops and Bottoms , that may be just local or historical.
To build this tool I mixed my experience on the field and some of the logic you can see in the following indicators of mine:
Pinbar that matters
Volume that matters
Volume Analyzer
This indicator works on every timeframe and market , it's quite responsive to market movements so it's especially good on volatile markets.
It is designed for fast day-trading / scalping , but as you trade on high timeframes is great for swing trades.
The indicator identifies candles that fall into the Swing Failure Patter category, but also candles other 4 categories of reversal candlestick pattern:
pinbar / hammer
hanged man
reversal by volume analysis
reversal by candle wicks analysis
Of course you can
customize colors
turn on or off what you prefer to see and what you don't
set alerts everything you see plotted
The indicator does NOT repaint of course.
This is a premium indicator , so send me a private message in order to get access to this script.
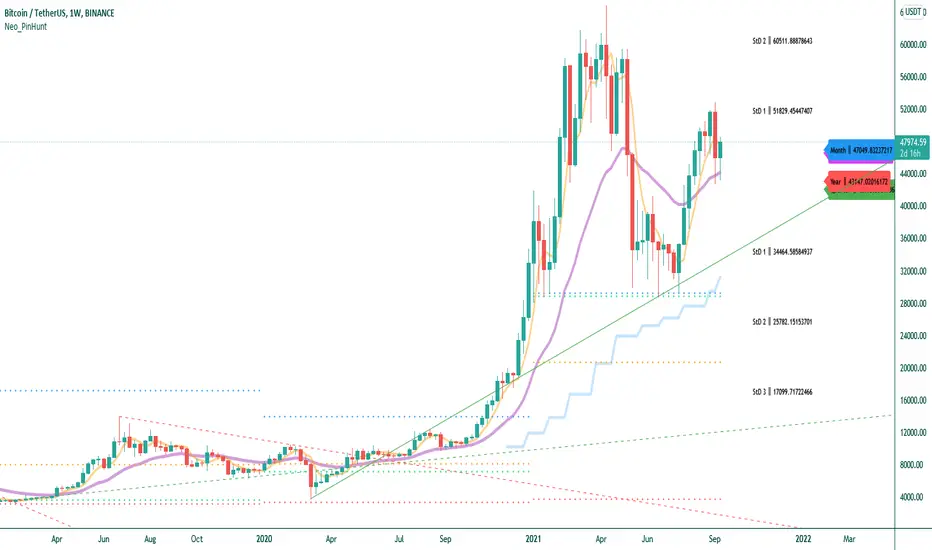
PIN HUNTERScript Components
- Volume Weighted Averages (Daily, Weekly, Monthly and Yearly)
- Price bands created with Standard Deviation
- ALMA Indicator
- Automatic Trend Lines
How to use :
* The script has been written to work properly in all time periods. It is more appropriate to use visually in periods of 4 hours or less.
* First of all, it should be checked whether the price is below or above the yellow colored "ALMA Indicator".
* When the price crosses the yellow line down, it tends to touch the price below (curve, trend line or price line). These touches are used to determine the buying level by looking at the trend direction.
It is also necessary to calculate that the number of items to break below will change depending on the strength of the trend. The script doesn't teach you this experience, the decisions you make are always up to you.
The price, which starts to rise again by touching the lower level, will show an upward trend towards the "ALMA Indicator".
* When the price crosses the yellow "ALMA Indicator" line up, it tends to touch the price (curve, trend line or price line) above it. These touches are used to determine the selling level by looking at the direction of the trend.
* The main levels that are intended to be traded are Standard Deviation bands. (Example: Price crossing StD1 level upwards targets StD2 level in Uptrend. If the trend is still up StD3 level becomes target.)
* Automatic Trend Lines are created by the script as the price moves. Extend the trend lines to the right. These lines will serve as support and resistance in the next candles. Newly formed trend lines appear solid, old trend lines appear dashed.
I wish the script will be useful to everyone. I would like to thank you in advance for any contribution and criticism you will make.
Please have a look at my other scripts. Pivot STRTGY V1 is worth a try.
(Turkish)
Script Bileşenleri
- Hacim Ağırlıklı Ortalamalar ( Günlük, Haftalık, Aylık ve Yıllık)
- Standart Sapma ile oluşturulan fiyat bantları
- ALMA İndikatörü
- Otomatik Trend Çizgileri
Nasıl Kullanılır :
* Script tüm zaman periyodlarında sağlıklı olarak çalışacak şekilde yazılmıştır. Görsel olarak 4 saat ve altındaki periyodlarda kullanılması daha uygundur.
* Öncelikle fiyatın sarı renkli "ALMA İndikatörünün" altında veya üstünde oluduğuna bakılmalıdır.
*Fiyat sarı çizgiyi aşağıya kestiğinde bir altında bulunan fiyata ( eğri, trend çizgisi ya da fiyat hattı) dokunma eğilimi gösterir. Bu dokunuşlar trend yönüne de bakılarak alım seviyesini saptamaya yarar.
Trendin gücüne bağlı olarak aşağıda kırılacak öğe sayısının değişeceğini de hesaplamak gerekir. Script size bu deneyimi öğretmez, alacağınız kararlar her zaman size aittir.
Alt seviyeye dokunarak tekrar yükselmeye başlayan fiyat "ALMA İndikatörüne" doğru yükselme eğilimi gösterecektir.
* Fiyat sarı çizgiyi yukarıya kestiğinde bir üstünde bulunan fiyata ( eğri, trend çizgisi ya da fiyat hattı) dokunma eğilimi gösterir. Bu dokunuşlar trend yönüne de bakılarak satma seviyesini saptamaya yarar.
* Ticaret yapılması amaçlanan ana seviyeler Standart Sapma bandlarıdır. (Örnek : StD1 seviyesini yukarı yönde geçen fiyat Yukarı trendde StD2 seviyesini hedefler. Trend halen yukarı ise StD3 seviyesi hedef haline gelir.)
* Otomatik Trend Çizgileri fiyat hareket ettikçe script tarafından oluşturulur. Trend çizgilerini sağa doğru şekilde uzatın. Bu çizgiler sonraki mumlarda destek ve direnç vazifesi göreceklerdir. Yeni oluşan trend çizgileri katı, eskiden oluşmuş trend çizgileri kesikli olarak gözükürler.
Scriptin herkese faydalı olmasını dilerim. Yapacağınız her türlü katkı ve eleştiri için şimdiden teşekkürlerimi sunuyorum.
Lütfen diğer scriptlerime de göz atınız. Özellikle Pivot STRTGY V1 denemeye değer bir çalışmadır.
ETH Top Cap [jamesray]This script is modified from Top Cap , as published here.
Historically it matches market tops for ETH

Reversal Algo (Zeiierman)█ Overview
Reversal Algo (Zeiierman) is an adaptive reversal and momentum detection system that helps identify hidden turning points, pressure zones, and changes in market direction. It brings together advanced modeling techniques such as dynamic volatility bands, adaptive trend tracking, and momentum-based confirmation signals into one clear, visual framework.
Unlike traditional reversal indicators that depend on static oscillators or fixed levels, this tool adapts in real time to market movement. It tracks volatility and directional flow to reveal when momentum is building, slowing down, or preparing to reverse.
Whether applied to short-term scalping, swing positioning, or macro structural validation, this tool provides an adaptive analytical environment that translates complex price dynamics into actionable context.
⚪ Why This One Is Unique
This version of Reversal Algo employs multi-domain adaptive modeling, combining envelope projection, trend inertia estimation, and contrarian equilibrium tracking within a single structure.
Its framework merges nonlinear smoothing manifolds with volatility-compensated directional phase mapping, allowing it to evolve with shifting market states rather than react to them.
Optional AI-driven optimizations enhance precision in unstable regimes by dynamically reshaping envelopes and tracking lines around localized flow curvature.
█ Main Features
⚪ Reversal Cloud
The Reversal Cloud highlights areas of potential expansion, compression, and turning points in price. It adapts to volatility by expanding when markets become unstable and tightening during periods of calm, creating a visual map of market rhythm and elasticity.
When the Cloud widens, it often signals exhaustion or increased turbulence; when it narrows, it suggests balance or an upcoming breakout.
With AI mode enabled, the Cloud automatically fine-tunes its shape to align with live price behavior, keeping its structure responsive and accurate.
⚪ Reversal Signals
Reversal Signals are designed to identify potential market turning points with precision. They combine multiple layers of price behavior—momentum shifts, directional changes, and balance-point deviations—to highlight areas where reversals are statistically more likely. To reduce false clusters, the system intelligently filters out repeated signals within a short time window.
⚪ Reversal/Exit Points
Reversal/Exit Points appear as small, color-coded dots above or below candles. They signal moments where price momentum slows or where the system detects a potential shift in directional strength. These markers are often found near short-term highs or lows, making them ideal for identifying profit-taking zones, re-entry setups, or early warnings of a possible reversal.
⚪ Trend Framework
The Trend Framework provides a clean visualization of the market’s prevailing direction. It smooths out short-term noise to reveal the core trend structure, showing when the market is expanding, contracting, or transitioning between phases.
This framework helps traders quickly see whether price action supports continuation or if the trend is weakening.
⚪ Trend Tracker Line
The Trend Tracker Line is a highly responsive trend detector that reacts quickly to shifts in momentum. It adapts dynamically to volatility, providing an accurate real-time view of directional acceleration and deceleration. This helps traders spot early changes in market tone and evaluate whether a move has the strength to continue.
When AI mode is enabled, the line automatically adjusts its sensitivity to remain stable and consistent across different market conditions.
⚪ Contrarian Bar Coloring
Contrarian Candle Coloring enhances chart readability by visually distinguishing strength from weakness. Green bars highlight areas of building upward momentum, while red bars point to potential pressure or exhaustion. The system continuously adapts its color transitions to reflect subtle momentum shifts, making it easier to recognize when the market is gaining or losing conviction.
An optional AI mode fine-tunes these transitions to match the current market rhythm, ensuring that candle coloration always reflects the underlying flow of strength and weakness.
█ How to Use
⚪ Reversal Trading
The primary purpose of the indicator is to identify reversal opportunities in the market. Reversal or contrarian trading means entering positions against the current directional move in anticipation of a fade or trend rotation. This approach often occurs in high-volatility environments, so it is important to widen your stops, reduce your initial position size, and, if appropriate, scale or average into positions carefully rather than committing all capital at once.
The Reversal Algo provides predefined Buy and Sell signals designed to highlight potential market peaks and troughs. While these signals are highly accurate, they are not meant to call every top or bottom perfectly. In a strong trending market, several reversal signals may appear consecutively before the market fully turns.
⚪ Reversal Signal + Candle Coloring
Combine Reversal Signals with Contrarian Candle Coloring for added confirmation. A practical approach is to wait for a Reversal Signal and then look for a color shift in the candles (for example, from contrarian-colored to standard candles). This color transition acts as confirmation that the active move may be losing strength and that a reversal could be underway.
⚪ Reversal Signals + Reversal Cloud
Consider taking reversal entries only when price interacts with the Reversal Cloud boundaries. The Cloud’s upper and lower layers act as dynamic resistance and support zones. When a Reversal Signal appears near or immediately after price rejection from one of these layers, it adds structural confirmation to the setup and strengthens the case for entry.
⚪ Reversal Signals + Key Levels
One of the most effective ways to trade Reversal Signals is by combining them with key price levels, such as the previous day’s high, low, or close. If price rejects one of these levels while a Reversal Signal prints simultaneously, the confluence of the two events serves as strong validation for a potential turning point.
⚪ Take Profit
The Reversal/Exit Points can function both as entry confirmations and as take-profit zones. If a Reversal Signal was missed but a new Reversal/Exit Point appears near a peak or trough, it can indicate a late-entry opportunity aligned with exhaustion behavior.
These dots are most powerful as profit-taking signals. Since they form near local highs and lows, they often mark regions of temporary imbalance where reversals are likely. When a Reversal/Exit Point forms in the opposite direction of your current position, consider taking partial profits or tightening stops to lock in gains while maintaining participation in the broader move.
█ How It Works
⚪ Reversal Cloud Engine
The Reversal Cloud defines the dynamic upper and lower boundaries of market elasticity by transforming recent price displacements into a smooth volatility field. Through multi-layered envelope modeling, it constructs a continuous topology of expansion and compression zones, revealing where directional energy accumulates or dissipates.
Calculation: Uses layered volatility envelopes that adapt to changing market speed and expansion. A built-in alignment mechanism keeps the upper and lower bands synchronized, while optional AI optimization adjusts the symmetry of the cloud based on short-term directional bias.
⚪ Trend Tracker System
The Trend Tracker isolates directional persistence by modeling angular displacement of price flow over adaptive temporal curvature. It interprets slope evolution as a continuously evolving directional vector field, capturing both acceleration and deceleration within the active regime.
Calculation: Applies adaptive slope modeling to estimate the dominant direction of price flow. The system smooths fluctuations dynamically while maintaining responsiveness to significant shifts in trend velocity. When AI mode is active, an intelligent weighting adjustment refines the tracker’s equilibrium bias for better phase synchronization.
⚪ Trend
The Trend module projects a dual-polarity directional lattice, distinguishing constructive (positive) and distributive (negative) flow environments. It defines equilibrium corridors that expand and contract with evolving trend geometry, offering visual feedback on regime strength and transition probability.
Calculation: Uses weighted directional regression to estimate upper, middle, and lower trend layers. Each structure is color-coded based on price slope and relative position, creating a continuous and easy-to-read trend map.
⚪ Contrarian Bar Coloring Engine
Contrarian bar coloring converts raw bar data into a slope-weighted momentum matrix, visually encoding thrust versus decay phases in real time. It acts as a microstructural interpreter of price inertia, identifying acceleration clusters and momentum fatigue through color transitions.
Calculation: Combines slope analysis and volatility normalization to evaluate how strong or weak each price bar is relative to its trend. The results are reflected in real-time color changes that emphasize momentum strength and fatigue.
⚪ Reversal/Exit System
Reversal and Exit Points are derived from an evolving volatility-based trail that tracks directional exhaustion and reversion potential. These markers visualize transitions in directional energy—helping traders anticipate trend slowdowns or reversal probabilities.
Calculation: Constructs an adaptive volatility trail that contracts as directional momentum weakens. A state-aware detection model identifies inflection points where pressure changes polarity, producing the plotted up/down dots that mark possible reversals or exits. This ensures that each signal dynamically reflects real-time shifts in market energy rather than static thresholds.
⚪ Reversal Signals Core
The Reversal System’s entry framework is designed for precision. It combines several layers of short-term momentum analysis into clear, directionally aligned signals. By balancing different market speeds and measuring how far the price moves from its equilibrium, it identifies high-probability areas where trends may continue or reverse.
Calculation: Implements a composite synchronization framework that aligns short-term momentum phases with equilibrium drift and directional bias. Redundant triggers are filtered out through temporal separation logic, ensuring only the most distinct and reliable signals are displayed. Adaptive thresholds adjust automatically based on volatility and trading mode, maintaining signal consistency across scalp, intraday, and swing environments.
⚪ AI-Adaptive Optimization Layer
The AI layer refines selected modules — Reversal Cloud, Trend Tracker, and Contrarian Candles — by continuously recalibrating their internal weighting curves according to volatility structure and price curvature. It acts as an intelligent stabilizer that adjusts smoothing depth, boundary stiffness, and gradient bias dynamically.
Calculation: Utilizes a Context-Aware Kernel Adjustment Engine, estimating curvature variance and phase imbalance to auto-tune envelope response. The model performs iterative self-alignment to preserve directional fidelity under rapidly changing flow dynamics.
-----------------
Disclaimer
The content provided in my scripts, indicators, ideas, algorithms, and systems is for educational and informational purposes only. It does not constitute financial advice, investment recommendations, or a solicitation to buy or sell any financial instruments. I will not accept liability for any loss or damage, including without limitation any loss of profit, which may arise directly or indirectly from the use of or reliance on such information.
All investments involve risk, and the past performance of a security, industry, sector, market, financial product, trading strategy, backtest, or individual's trading does not guarantee future results or returns. Investors are fully responsible for any investment decisions they make. Such decisions should be based solely on an evaluation of their financial circumstances, investment objectives, risk tolerance, and liquidity needs.
Paid script

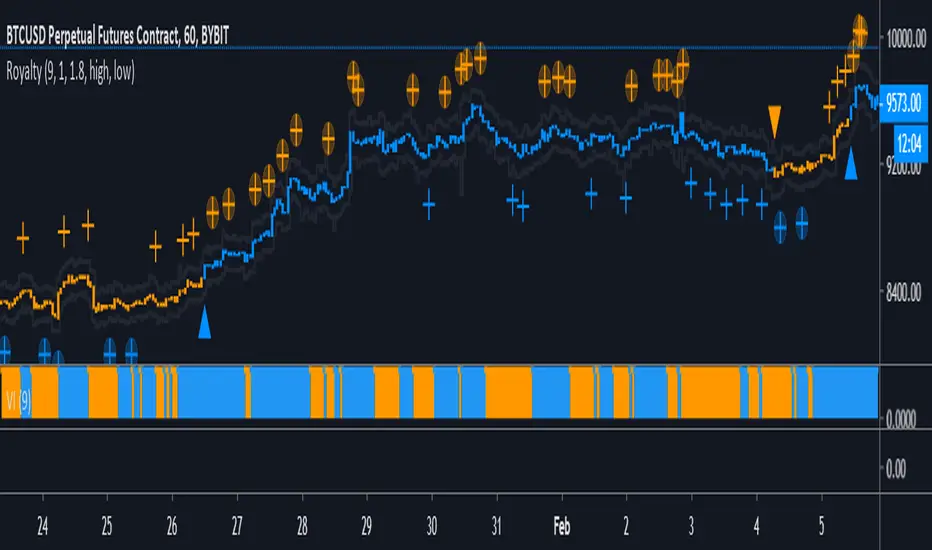
Project Royalty BETAThis indicator is designed to be used in confluence with the PROJECT WINDFALL BETA.
Trend analysis combined with top and bottom signals. This indicator is aimed at minimizing risk by trading with the trend.
Color Definitions:
Blue candle coloring shows a bullish trend
Orange candle coloring shows a bearish trend
Signals:
Blue Triangle - Trend reversal (bearish to bullish)
Blue Cross - Local bottom while in a bullish trend
Blue Cross w/ Circle - Local bottom while in a bearish trend
Orange Triangle - Trend reversal (bullish to bearish)
Orange Cross - Local top while in a bearish trend
Orange Cross w/ Circle - Local bottom while in a bullish trend
Trading Strategy:
TRADE WITH THE TREND
While the trend is bullish (blue) ONLY LONG.
Long trend reversal signals (blue triangle).
Long bottom signals (blue cross) and then take profits on top signals (orange cross w/ circle). DO NOT short top signals while in a bullish trend.
While the trend is bearish (orange) ONLY SHORT.
Short trend reversal signals (orange triangle).
Short top signals (orange cross) and then take profits on bottom signals (blue cross w/ circle). DO NOT long top signals while in a bearish trend.
Stop Loss/Take Profit Bands:
Stop Loss and Take Profit Bands are provided to encourage the setting of both a SL and a TP (methods to minimize risk). When entering a long, set a SL at the SL band value of the signal candle (defaulted to 1%). Set a TP at the TP band value of the signal candle (defaulted to 1.8%). Default percentages are under the assumption of 10x trading leverage.
Ideal Settings:
It's advised to turn off candle borders and to change candle colors to match the colors used in the indicator (default blue and orange).
IMPORTANT:
This indicator is specifically tuned for BTCUSD and is most effective on the 1 HOUR time frame. Be warned when trading any other instrument with this oscillator.
NVT Dynamic Colored with Signals [aamonkey]NVT Dynamic
This is the dynamic version of my " Bitcoin Network Value to Transactions " indicator.
The dynamic NVT indicator is based on the Network Value to Transactions.
Definition:
NVT = Network Value / Daily Transaction Volume
Advantages:
Because BTC is a very young asset, it can be a good idea to have relatively high and low NVT values that change over time.
Signals:
When the NVT turns green = buy opportunity
NVT turns red = sell opportunity

Iconik Trading Suite: Price Action AlertsDisplays signals for Iconik MACD bullish and bearish crosses (including front running signals) along with tops and bottoms.
DM for a PowerPoint describing this indicator and the rest of Iconik in detail.
Iconik Trading Suite Indicator List:
ITS-OSC: Oscillators (v2)
ITS-PAA: Price Action Alerts (v2)
ITS-ASR: Auto Support/Resistance
-> Daily (v2)
-> 3 Day (v2)
-> Weekly (v2)
ITS-4TFC: 4 Time Frame Confirmation (v1)
ITS-DIV: Divergence Seeker (v1)

Bitcoin Network Value to Transactions [aamonkey]Cryptoassets have been quite turbulent in the past few weeks.
At times like this, it is especially important to look at the fundamental foundations of cryptoassets.
This indicator is based on the Network Value to Transactions , or NVT .
Definition:
NVT = Network Value / Daily Transaction Volume
Because this indicator is pulling the Daily Transaction Volume for BTC it can only be used for BTC and the daily timeframe.

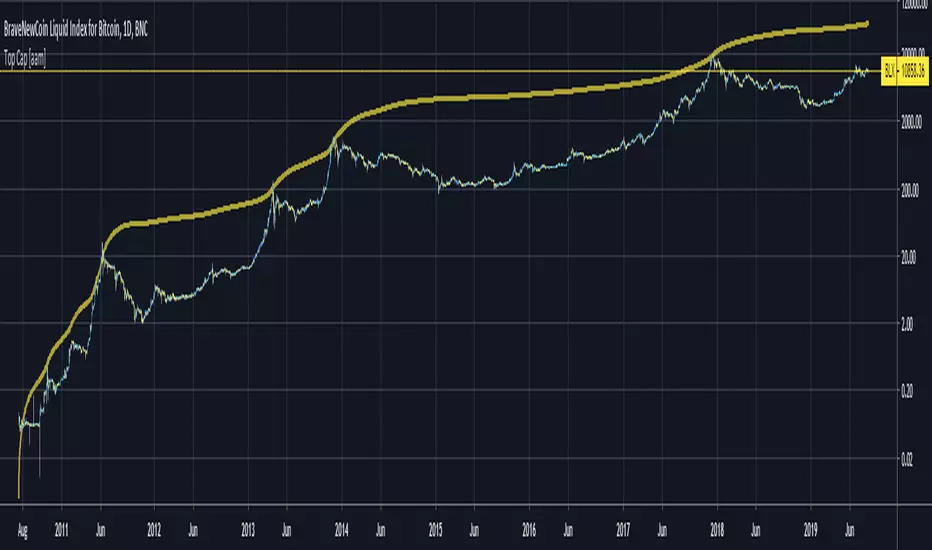
Top Cap [aamonkey]Historically matched market tops for BTC.
It's the Average Cap (see my other indicator) multiplied by 35.
The default settings are for BTC.
If you want to test this indicator on another chart you have to change the launch date settings (and maybe play around with the multiplier).
Some Interesting Launch dates:
- BTC: 3 JAN 2009
- ETH: 30. JUL 2015
- LTC: 7. OCT 2011
RSI Top & Bottom Warning [aamonkey]An enhancement of my RSI Bottom Indicator.
This one finds you Tops & Bottoms.
This indicator uses the RSI and prints you top & bottom warnings directly on the price chart.
The other special thing about this is that the RSI pulls the data from the weekly chart no matter on what timeframe you are on.
The preferred timeframe can, of course, be changed in the settings as well as any thresholds for tops and bottoms.
The default settings are very good for btc, but be free to try and test this indicator with different settings on different charts.

TOP & BOTTOM Cycle [aamonkey]Works best on BTC and only on the daily timeframe!
This is a TOP / BOTTOM indicator for big market cycles.
These tops and bottoms are based on the difference between the 200MA on the daily and the price.

Double Top Pattern IdentifierHello friends,
This script is a powerful, non-repainting detector for the classic Double Top pattern — one of the most widely recognized bearish reversal setups. The indicator automatically identifies and tracks developing 'M'-shaped formations in real-time, confirming valid entries once the neckline is broken and providing complete trade management features. No manual configuration for detection is needed — it works out of the box.
🛠 How It Works
It uses advanced techniques that involve pivot points analysis and do not rely on other indicators, ensuring robustness and adaptability across different market conditions. When a potential Double Top is detected, the indicator marks the pattern points, draws the neckline, and waits for confirmation.
Once confirmed, it generates a 'Short' signal with calculated Take Profit (TP) and Stop Loss (SL) levels.
The script includes a statistics table summarizing performance metrics — such as number of patterns, trade results, bar distances, and top differences — all dynamically updated on your chart.
🔥 Key Features
Pine Script V6 — optimized logic and performance
Works out of the box — no manual configuration required
Non-repainting detection
Fully visualized structure — points, neckline, TP, and SL plotted automatically
Multiple TP/SL modes: R/R ratio, ATR-based, percent, points, pips, ticks, or top-to-neckline distance
Trailing Stop Loss support
Interactive statistics table with pattern count, trade outcomes, profit ratio, and structural measurements
Smart alert system
Customizable alert messages with placeholders (price, ticker, timeframe, etc.)
Clean, updated UI with improved layout and organization
If you'd like access or have any questions, feel free to reach out to me directly via DM.
👋 Good luck and happy trading!
Paid script

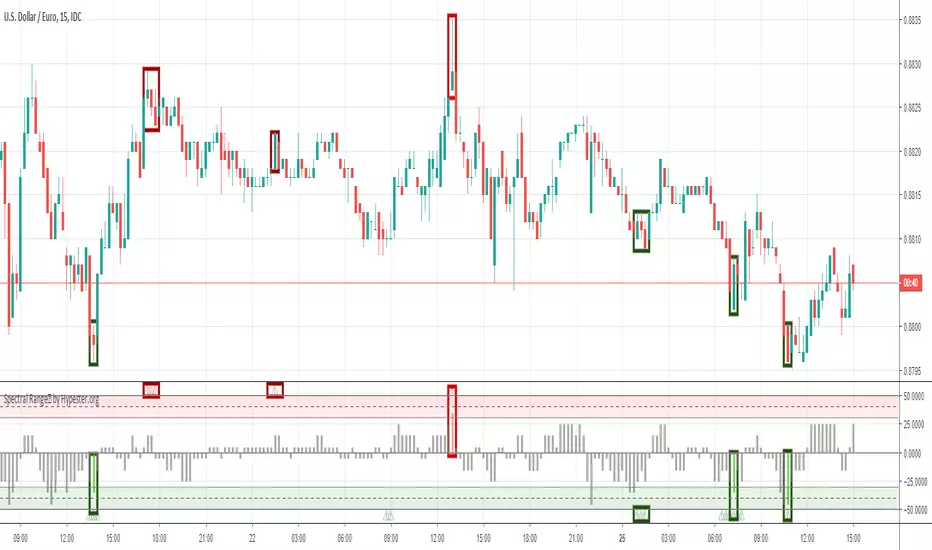
Spectral Range™ by HypesterThe Hypester team strikes again!
Picking tops & bottoms is a real art for any retail trader. It's just like scoring the perfect goal when you get the maximum profit from your trades. It's the difference between an excellent trade and just another trade in your system. It's that last edge you start to seek once you found your profitable strategy.
That's what the Spectral Range™ algorithm does for you - it shows you where all the likely tops/bottoms are . It mixes the famous machine learning Spectro™ technology with cutting edge statistical anomaly detection.
Since all the hard math is done for you, it's deploy and trade. Spectral Range™ will easily tell you when the range of the movement is far out of the normal, healthy and expected movement.
The height of the bar will tell you how aggressive is the anomaly and consequently its correction, plus an extra layer of confirmation with the little warning signs that should be used together for a more conservative approach.
It's really that simple, what are you waiting for?

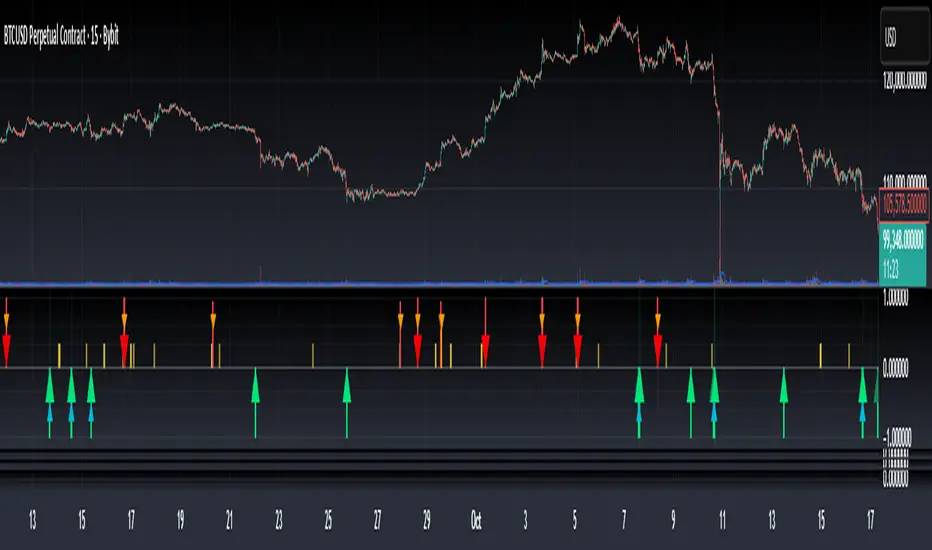
Bottom & Top Finder v3.0Bottom & Top Finder v3.0 is a proprietary multi-component oscillator designed to identify potential market reversals and extreme price conditions. The indicator analyzes momentum, volatility, and price behavior to generate bullish and bearish signals with strength classification.
█ OVERVIEW
Each signal is classified into three strength levels (Weak, Medium, Strong) allowing traders to prioritize high-conviction setups.
Signal Classification:
• Strong signals (±1.0): High conviction setups with multiple confirmations
• Medium signals (±0.6): Moderate conviction with key component alignment
• Weak signals (±0.33): Early warnings or preliminary indications
█ KEY FEATURES
Smart Signal Management
The indicator includes an intelligent system that allows signal sequences to complete naturally while preventing excessive noise. Unlike traditional cooldown systems that block all signals during a cooldown period, this implementation allows consecutive signals during a "run" and only applies cooldown after the signal run ends. This ensures complete multi-bar patterns are captured while preventing rapid flip-flopping.
Advanced Filtering System
Three optional filters allow adaptation to different market conditions:
• Volume Confirmation Filter: Validates signals against recent volume activity across a configurable lookback period. Checks if any bar in the lookback window exceeded average volume by the specified multiplier.
• Trend Alignment Filter: Four operational modes including With Trend, Counter Trend, Statistical Distance, or Off. The anomaly mode uses calculations to identify signals only at statistical extremes rather than simple directional bias.
• Signal Type Selection: Enable or disable weak, medium, and strong signals independently based on your trading style and risk tolerance.
Comprehensive Alert System
Ten distinct alert conditions cover every use case. Alerts include price level and timestamp, and are ready for webhook integration with automated trading systems.
█ HOW TO USE
Basic Setup
1 — Add "Bottom & Top Finder v3.0" to your chart in a separate indicator pane
2 — Optionally add "Bottom & Top Finder v3.0 - Chart Labels" for on-chart visual markers
3 — Configure lookback periods (defaults work well for most timeframes)
4 — Enable or disable signal strengths based on your trading style
5 — Apply filters as needed to reduce noise in your specific market
Signal Interpretation
Histogram magnitude indicates signal conviction. Multiple signal types can fire simultaneously and are aggregated into the composite score.
Alert Configuration
Set up alerts through TradingView's standard alert system using the built-in alert conditions. Choose from individual signal types (for specific setups) or aggregate alerts (for broader monitoring).
Recommended Approach
• Combine indicator signals with price action and support/resistance analysis
• Use strong signals for entries, weaker signals for early warnings or exits
• Enable filters when trading liquid markets with reliable volume data
• Adjust cooldown period based on timeframe: lower for active trading, higher for swing setups
• Start with default settings and adjust based on backtesting results
█ SETTINGS
Lookback Settings
• Main Lookback Period: Primary calculation period for most components (default: 21). Lower values increase sensitivity, higher values smooth signals.
• Range Lookback: Extended lookback for range high/low analysis (default: 50). Affects extreme condition detection.
Signal Settings
• Enable Weak Signals: Toggle weak signal detection (default: on)
• Enable Medium Signals: Toggle medium signal detection (default: on)
• Enable Strong Signals: Toggle strong signal detection (default: on)
Filter Settings
• Enable Volume Filter: Require volume confirmation (default: off)
• Volume Lookback: Period to check for volume spikes (default: 30)
• Volume Spike Multiplier: Threshold above average volume (default: 1.3x)
• Trend Filter Mode: Off, With Trend, Counter Trend, or Anomaly (default: off)
• Trend SMA Period: Moving average period for trend calculations (default: 50)
• Anomaly Threshold: Minimum statistical deviation for anomaly mode (default: 1.5)
Display Settings
• Show Composite Histogram: Toggle main histogram display (default: on)
• Show Signal Bars: Toggle triangle markers in indicator pane (default: on)
• Show RSI Reference: Overlay normalized RSI for context (default: off)
█ TIMEFRAME CONSIDERATIONS
The indicator works on any timeframe from 1-minute to monthly charts. However, optimal performance requires timeframe-appropriate configuration:
Shorter Timeframes (1m-15m)
Consider reducing main lookback period for increased responsiveness. Volume filter may be less reliable in some markets during low-liquidity sessions.
Medium Timeframes (1H-4H)
Default lookback periods are optimized for these timeframes. Volume and trend filters provide good noise reduction.
Longer Timeframes (1D+)
Consider increasing lookback periods for smoother signals. Filters are highly effective at these timeframes.
█ BEST PRACTICES
Risk Management
This indicator is a technical analysis tool designed to identify potential reversal zones and does not guarantee profitable trades. Users should:
• Understand that signals indicate potential setup zones, not guaranteed outcomes
• Employ proper position sizing and risk management on every trade
• Combine indicator signals with their own analysis and trading strategy
• Paper trade and backtest thoroughly before live implementation
• Never risk more than they can afford to lose
Signal Context
Indicator signals should be evaluated within broader market structure. Consider:
• Proximity to key support and resistance levels
• Overall trend direction and strength
• Market volatility and liquidity conditions
• Confluence with other technical indicators or patterns
• Fundamental factors that may override technical signals
█ NOTES
• All signals use confirmed bar data and do not repaint
• The cooldown system tracks top and bottom signals independently
• Multiple signal types can fire simultaneously; the composite score aggregates them
• Anomaly mode measures standard deviation magnitude, not just directional bias
• Volume filter checks any bar in the lookback period, not just the current bar
• Strong signals require more confirmations than medium or weak signals
Top Finder 1.1Top Finder is an automated cryptocurrency signals and analysis tool which uses a complex algorithm involving multiple indicators, trends, and cross-overs including proprietary formulas developed in-house to predict the top or near top price of cryptocurrencies. It also works well on stocks, gold, oil and forex, even soybeans!
Top Finder is the sister indicator to Bottom Finder (check my other scripts).
Signal strength is represented by height/color of the signal. (Taller signal = stronger signal).

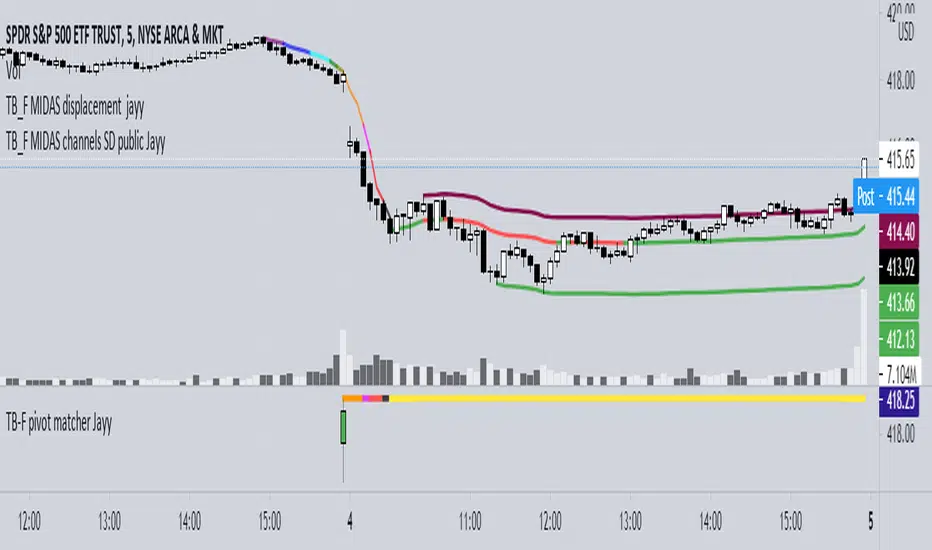
Topfinder Bottomfinder pivot matcher Midas- jayyMidas Technical Analysis: A VWAP Approach to Trading and Investing in Today’s Markets by
Andrew Coles, David G. Hawkins Copyright © 2011 by Andrew Coles and David G. Hawkins.
Appendix C: TradeStation Code for the MIDAS Topfinder/Bottomfinder Curves ported to tradingview
This code is used to assist in adjusting D volume to intersect pivot candle at a pivot candle when using this script: Top Bottom Finder Public version- Jayy found here:
The "n" number entered into the TB-F script is the topfinder/bottomfinder starting point or anchor
Be sure to enter the correct number in the "Topfinder bottomfinder initiation/anchor candle: 1 for CANDLE low - top finder, 2 for CANDLE high - bottom finder, 3 for CANDLE MIDPOINT (hl2) dialogue box
The location of the match point of the pivot candle is extremely important in the: "Match to PIVOT CANDLE: use 1 for CANDLE low, 2 for midtail of the candle below the BODY, 3 for candle BODY low, 4 for CANDLE HIGH, 5 for midpoint of candletail above body, 6 for candle BODY high". Do not
confuse body high with candle high. The body low will either be the candle open or close. The body high will be either the open or close.
If you expect a trend up the pivot candle is likely the low of the pivot candle ie 1 (2 and 3 are alternatives).
In a trend down the high of the pivot candle is often selected ie 4 (5 or 6 are alternatives)
If the candle body is aqua increase D volume if it is orange reduce D volume. Adjust iteratively until the candle body turns yellow. That will mean that the TB-F line passes through the pivot candle at the selected point.
Jayy

Top Bottom Finder Public version- Jayy This script plots a 6 algos from the Coles/Hawkins "Midas Technical Analysis" book:
Top finder / Bottom Finder (Levine Algo by Bob English)* - onlinelibrary.wiley.com
MIDAS VWAP Gen-1) -
MIDAS VWAP average and deltas
VWAP (Gen-1) using a date or a bar n number can be initiated at bar 0 - useful for a new IPO
Standard Deviation of MIDAS VWAP
MIDAS Displacement Channels (Coles) - edmond.mires.co
An%20Anchored%20VWAP%20Channel%20For%20Congested%20Markets.pdf
* for better results with topfinder and bottomfinder use the companion TB-F Matcher script.
See wiki for a synopsis: en.wikipedia.org
Relevant info can be found in: Midas Technical Analysis: A VWAP Approach to Trading and Investing in Today’s Markets by
Andrew Coles, David G. Hawkins Copyright © 2011 by Andrew Coles and David G. Hawkins.
Appendix C: TradeStation Code for the MIDAS Topfinder/Bottomfinder Curves ported to Tradingview
This script requires a working understanding of "Midas Technical Analysis" Google "Midas Technical Analysis" and a variety of information will appear.
To find fit the curve as described in the Midas book a companion script is required that will after a few manual iterative inputs guide you to the appropriate D value for the for input into this program ( see the TB-F Matcher script). You might also try the Midas average and Deltas as described in the book. I have added the 2nd, 3rd and 4th multiples of Delta.
The advantage is that there is no curve fitting. You still need to select a starting point for Midas or the topfinder bottomfinder (TB_F)
or the VWAP.
////////////////////////////////////////////////////////////////////////////////////////////////////////////////////////////
See the notes in the script below
Cheers Jayy