Goal Setting Strategies Viprasol# 🎯 Goal Setting Strategies Viprasol
A powerful goal tracking tool designed for disciplined traders who want to monitor their trading objectives, milestones, and progress directly on their charts.
## ✨ KEY FEATURES
### 📊 Flexible Goal Management
- Track anywhere from 1 to 20 trading goals simultaneously
- Adjustable goal count via simple input slider
- Each goal has its own unique emoji identifier
- Real-time progress counter
### ✅ Visual Tracking System
- Interactive checkbox system for goal completion
- Clear visual indicators (✅ completed, ⬜️ pending)
- Customizable goal names and descriptions
- Dynamic progress display
### 🎨 Full Customization
- **4 Position Options**: Top Left, Top Right, Bottom Left, Bottom Right
- **5 Font Sizes**: Tiny, Small, Normal, Large, Huge (optimized for all screen sizes)
- **Custom Colors**: Header, labels, background, achievement text
- **Premium Styling**: Modern cyber-themed design with professional appearance
### 💡 Perfect For:
- Daily/Weekly trading goal tracking
- Risk management milestones
- Profit target monitoring
- Trading plan compliance
- Personal development objectives
- Learning milestones
## 🔧 HOW TO USE
1. **Set Your Primary Goal**: Enter your main objective in "Primary Goal" field
2. **Choose Goal Count**: Select how many goals you want (1-20)
3. **Name Your Goals**: Customize each goal name in the "Goal Definitions" section
4. **Track Progress**: Check off goals as you complete them
5. **Customize Display**: Adjust colors, sizes, and position to match your chart setup
## 📐 INPUT GROUPS
### 🎯 Viprasol Goal Configuration
- Primary Goal Name
- Number of Goals (1-20)
### 📋 Goal Definitions
- All 20 goals with individual names and checkboxes
- Only enabled goals (based on count) will display
### 🌈 Premium Styling
- Goal Header Color
- Label Color
- Panel Background Color
- Achievement Color
- Header Font Size
- Milestone Font Size (Tiny/Small optimized for space)
### 📍 Elite Display
- Dashboard Position selector
## 💎 UNIQUE FEATURES
- **Space Efficient**: Tiny and Small font options for compact displays
- **Scalable**: Grow from 1 goal to 20 as your needs evolve
- **Non-Intrusive**: Overlay indicator that doesn't interfere with price action
- **Professional Design**: Clean, modern interface with cyber aesthetic
## 🎓 USE CASES
**Day Traders**: Track daily profit targets, trade count limits, max loss thresholds
**Swing Traders**: Monitor weekly/monthly goals, position management rules
**New Traders**: Learning milestones, strategy development checkpoints
**Experienced Traders**: Advanced risk management, portfolio objectives
## ⚙️ TECHNICAL DETAILS
- Version: Pine Script v5
- Type: Overlay Indicator
- Max Labels: 500
- Table-based display system
- No repainting
- Lightweight performance
## 🚀 GETTING STARTED
1. Add indicator to your chart
2. Set "Number of Goals" to your desired count (start small, scale up)
3. Customize goal names
4. Check boxes as you achieve goals
5. Watch your progress build!
## 📊 DISPLAY OPTIMIZATION
- Use "Tiny" or "Small" for maximum goals on small screens
- Use "Normal" or "Large" for standard monitors
- Use "Huge" for presentation or large displays
- Adjust position to avoid chart overlap
## 🎯 TRADING DISCIPLINE
This tool helps reinforce:
- Goal-oriented trading mindset
- Progress tracking accountability
- Milestone celebration
- Structured approach to trading development
---
**© viprasol**
*Designed for traders who take their goals seriously.*
Tracking

Apex Edge - London Open Session# Apex Edge - London Open Session Trading System
## Overview
The London Open Session indicator captures institutional price action during the first hour of the London forex session (8:00-9:00 AM GMT) and identifies high-probability breakout and retest opportunities. This system tracks the session's high/low range and generates precise entry signals when price breaks or retests these key institutional levels.
## Core Strategy
**Session Tracking**: Automatically identifies and marks the London Open session boundaries, creating a trading zone from the first hour's price range.
**Dual Entry Logic**:
- **Breakout Entries**: Triggers when price closes beyond the session high/low and continues in that direction
- **Retest Entries**: Activates when price returns to test the broken level as new support/resistance
**Performance Analytics**: Built-in win rate tracking displays real-time performance statistics over user-defined lookback periods, enabling data-driven optimization for each currency pair.
## Key Features
### Automated Zone Detection
- Precise London session timing with timezone offset controls
- Visual session boundaries with customizable colours
- Automatic high/low range calculation and display
### Smart Entry System
- Breakout confirmation requiring candle close beyond zone
- Retest detection with configurable pip distance tolerance
- Separate risk/reward ratios for breakout vs retest entries
- Visual entry arrows with clear trade direction labels
### Performance HUD
- Real-time win rate calculation over customizable periods (7-365 days)
- Total trades tracking with win/loss breakdown
- Average risk-reward ratio display
- Color-coded performance metrics (green >70%, yellow >50%, red <50%)
### PineConnector Integration
- Direct MT4/MT5 execution via PineConnector alerts
- Proper forex pip calculations for all currency pairs
- Customizable risk percentage per trade
- Symbol override capability for broker compatibility
- Automatic SL/TP level calculation in pips
## Critical Usage Requirements
### Pair-Specific Optimization
Each currency pair requires individual optimization due to varying volatility characteristics, institutional participation levels, and typical price ranges during London hours. The performance HUD is essential for identifying optimal settings before live trading.
**Recommended Testing Process**:
1. Apply indicator to desired currency pair and timeframe
2. Experiment with session timing - while 8:00-9:00 AM GMT is standard, some pairs may show improved performance with alternative hourly windows (e.g., 7:00-8:00 AM or 9:00-10:00 AM)
3. Adjust Stop Loss distances, Risk/Reward ratios, and Retest distances
4. Monitor win rate over 30+ day periods using the performance HUD
5. Only proceed with live alerts once consistent 60%+ win rates are achieved
6. Create separate optimized chart setups for each profitable pair/timeframe combination
### Timeframe Specifications
This indicator is specifically designed and tested for:
- **1-minute charts**: Optimal for capturing immediate institutional reactions
- **5-minute charts**: Balanced approach between noise reduction and opportunity frequency
Higher timeframes generally produce inferior results due to increased noise and reduced institutional edge during the London session window.
## Settings Configuration
### Session Timing
- **London Open/Close Hours**: Adjust for your chart's timezone
- **Rectangle End Time**: Set to 4:30 PM to stop signals before NY session close
- **Timezone Offset**: Ensure accurate London session capture
### Entry Parameters
- **Retest Distance**: 3-8 pips depending on pair volatility
- **Stop Loss Pips**: Separate settings for breakouts (10-15 pips) and retests (8-12 pips)
- **Risk/Reward Ratios**: Independent ratios for different entry types
### PineConnector Setup
- **License ID**: Your PineConnector license key
- **Symbol Override**: MT4/MT5 symbol names if different from TradingView
- **Risk Percentage**: Position size as percentage of account balance
- **Prefix/Comment**: Organize trades in terminal
## Manual Trading Limitations
Without PineConnector automation, traders face significant practical challenges:
**Settings Management**: Each currency pair requires different optimized parameters. Switching between charts means manually adjusting multiple settings each time, creating potential for errors and missed opportunities.
**Timing Sensitivity**: London Open signals can occur rapidly during high-volatility periods. Manual execution may result in slippage or missed entries.
**Multi-Pair Monitoring**: Tracking 4-11 currency pairs simultaneously while manually adjusting settings for each switch becomes impractical for most traders.
**Parameter Consistency**: Risk of using suboptimal settings when quickly switching between pairs, potentially compromising the careful optimization work.
## Recommended Workflow
1. **Historical Testing**: Use win rate HUD to identify profitable pairs and optimal parameters
2. **Demo Automation**: Test PineConnector alerts on demo accounts with optimized settings
3. **Live Implementation**: Deploy alerts only on proven profitable pair/timeframe combinations
4. **Ongoing Monitoring**: Regular review of performance metrics to maintain edge
## Risk Disclaimer
This indicator provides analysis tools and automation capabilities but does not guarantee profitable trading outcomes. Past performance does not predict future results. Users should thoroughly backtest and demo trade before risking live capital. The London session strategy works best during specific market conditions and may underperform during low volatility or unusual market environments.
## Support Requirements
Successful implementation requires:
- Basic understanding of London session market dynamics
- PineConnector subscription for automation features
- Patience for proper optimization process
- Realistic expectations about win rates and drawdown periods
This system is designed for serious traders willing to invest time in proper optimization and risk management rather than plug-and-play solutions.

DCA Investment Tracker Pro [tradeviZion]DCA Investment Tracker Pro: Educational DCA Analysis Tool
An educational indicator that helps analyze Dollar-Cost Averaging strategies by comparing actual performance with historical data calculations.
---
💡 Why I Created This Indicator
As someone who practices Dollar-Cost Averaging, I was frustrated with constantly switching between spreadsheets, calculators, and charts just to understand how my investments were really performing. I wanted to see everything in one place - my actual performance, what I should expect based on historical data, and most importantly, visualize where my strategy could take me over the long term .
What really motivated me was watching friends and family underestimate the incredible power of consistent investing. When Napoleon Bonaparte first learned about compound interest, he reportedly exclaimed "I wonder it has not swallowed the world" - and he was right! Yet most people can't visualize how their $500 monthly contributions today could become substantial wealth decades later.
Traditional DCA tracking tools exist, but they share similar limitations:
Require manual data entry and complex spreadsheets
Use fixed assumptions that don't reflect real market behavior
Can't show future projections overlaid on actual price charts
Lose the visual context of what's happening in the market
Make compound growth feel abstract rather than tangible
I wanted to create something different - a tool that automatically analyzes real market history, detects volatility periods, and shows you both current performance AND educational projections based on historical patterns right on your TradingView charts. As Warren Buffett said: "Someone's sitting in the shade today because someone planted a tree a long time ago." This tool helps you visualize your financial tree growing over time.
This isn't just another calculator - it's a visualization tool that makes the magic of compound growth impossible to ignore.
---
🎯 What This Indicator Does
This educational indicator provides DCA analysis tools. Users can input investment scenarios to study:
Theoretical Performance: Educational calculations based on historical return data
Comparative Analysis: Study differences between actual and theoretical scenarios
Historical Projections: Theoretical projections for educational analysis (not predictions)
Performance Metrics: CAGR, ROI, and other analytical metrics for study
Historical Analysis: Calculates historical return data for reference purposes
---
🚀 Key Features
Volatility-Adjusted Historical Return Calculation
Analyzes 3-20 years of actual price data for any symbol
Automatically detects high-volatility stocks (meme stocks, growth stocks)
Uses median returns for volatile stocks, standard CAGR for stable stocks
Provides conservative estimates when extreme outlier years are detected
Smart fallback to manual percentages when data insufficient
Customizable Performance Dashboard
Educational DCA performance analysis with compound growth calculations
Customizable table sizing (Tiny to Huge text options)
9 positioning options (Top/Middle/Bottom + Left/Center/Right)
Theme-adaptive colors (automatically adjusts to dark/light mode)
Multiple display layout options
Future Projection System
Visual future growth projections
Timeframe-aware calculations (Daily/Weekly/Monthly charts)
1-30 year projection options
Shows projected portfolio value and total investment amounts
Investment Insights
Performance vs benchmark comparison
ROI from initial investment tracking
Monthly average return analysis
Investment milestone alerts (25%, 50%, 100% gains)
Contribution tracking and next milestone indicators
---
📊 Step-by-Step Setup Guide
1. Investment Settings 💰
Initial Investment: Enter your starting lump sum (e.g., $60,000)
Monthly Contribution: Set your regular DCA amount (e.g., $500/month)
Return Calculation: Choose "Auto (Stock History)" for real data or "Manual" for fixed %
Historical Period: Select 3-20 years for auto calculations (default: 10 years)
Start Year: When you began investing (e.g., 2020)
Current Portfolio Value: Your actual portfolio worth today (e.g., $150,000)
2. Display Settings 📊
Table Sizes: Choose from Tiny, Small, Normal, Large, or Huge
Table Positions: 9 options - Top/Middle/Bottom + Left/Center/Right
Visibility Toggles: Show/hide Main Table and Stats Table independently
3. Future Projection 🔮
Enable Projections: Toggle on to see future growth visualization
Projection Years: Set 1-30 years ahead for analysis
Live Example - NASDAQ:META Analysis:
Settings shown: $60K initial + $500/month + Auto calculation + 10-year history + 2020 start + $150K current value
---
🔬 Pine Script Code Examples
Core DCA Calculations:
// Calculate total invested over time
months_elapsed = (year - start_year) * 12 + month - 1
total_invested = initial_investment + (monthly_contribution * months_elapsed)
// Compound growth formula for initial investment
theoretical_initial_growth = initial_investment * math.pow(1 + annual_return, years_elapsed)
// Future Value of Annuity for monthly contributions
monthly_rate = annual_return / 12
fv_contributions = monthly_contribution * ((math.pow(1 + monthly_rate, months_elapsed) - 1) / monthly_rate)
// Total expected value
theoretical_total = theoretical_initial_growth + fv_contributions
Volatility Detection Logic:
// Detect extreme years for volatility adjustment
extreme_years = 0
for i = 1 to historical_years
yearly_return = ((price_current / price_i_years_ago) - 1) * 100
if yearly_return > 100 or yearly_return < -50
extreme_years += 1
// Use median approach for high volatility stocks
high_volatility = (extreme_years / historical_years) > 0.2
calculated_return = high_volatility ? median_of_returns : standard_cagr
Performance Metrics:
// Calculate key performance indicators
absolute_gain = actual_value - total_invested
total_return_pct = (absolute_gain / total_invested) * 100
roi_initial = ((actual_value - initial_investment) / initial_investment) * 100
cagr = (math.pow(actual_value / initial_investment, 1 / years_elapsed) - 1) * 100
---
📊 Real-World Examples
See the indicator in action across different investment types:
Stable Index Investments:
AMEX:SPY (SPDR S&P 500) - Shows steady compound growth with standard CAGR calculations
Classic DCA success story: $60K initial + $500/month starting 2020. The indicator shows SPY's historical 10%+ returns, demonstrating how consistent broad market investing builds wealth over time. Notice the smooth theoretical growth line vs actual performance tracking.
MIL:VUAA (Vanguard S&P 500 UCITS) - Shows both data limitation and solution approaches
Data limitation example: VUAA shows "Manual (Auto Failed)" and "No Data" when default 10-year historical setting exceeds available data. The indicator gracefully falls back to manual percentage input while maintaining all DCA calculations and projections.
MIL:VUAA (Vanguard S&P 500 UCITS) - European ETF with successful 5-year auto calculation
Solution demonstration: By adjusting historical period to 5 years (matching available data), VUAA auto calculation works perfectly. Shows how users can optimize settings for newer assets. European market exposure with EUR denomination, demonstrating DCA effectiveness across different markets and currencies.
NYSE:BRK.B (Berkshire Hathaway) - Quality value investment with Warren Buffett's proven track record
Value investing approach: Berkshire Hathaway's legendary performance through DCA lens. The indicator demonstrates how quality companies compound wealth over decades. Lower volatility than tech stocks = standard CAGR calculations used.
High-Volatility Growth Stocks:
NASDAQ:NVDA (NVIDIA Corporation) - Demonstrates volatility-adjusted calculations for extreme price swings
High-volatility example: NVIDIA's explosive AI boom creates extreme years that trigger volatility detection. The indicator automatically switches to "Median (High Vol): 50%" calculations for conservative projections, protecting against unrealistic future estimates based on outlier performance periods.
NASDAQ:TSLA (Tesla) - Shows how 10-year analysis can stabilize volatile tech stocks
Stable long-term growth: Despite Tesla's reputation for volatility, the 10-year historical analysis (34.8% CAGR) shows consistent enough performance that volatility detection doesn't trigger. Demonstrates how longer timeframes can smooth out extreme periods for more reliable projections.
NASDAQ:META (Meta Platforms) - Shows stable tech stock analysis using standard CAGR calculations
Tech stock with stable growth: Despite being a tech stock and experiencing the 2022 crash, META's 10-year history shows consistent enough performance (23.98% CAGR) that volatility detection doesn't trigger. The indicator uses standard CAGR calculations, demonstrating how not all tech stocks require conservative median adjustments.
Notice how the indicator automatically detects high-volatility periods and switches to median-based calculations for more conservative projections, while stable investments use standard CAGR methods.
---
📈 Performance Metrics Explained
Current Portfolio Value: Your actual investment worth today
Expected Value: What you should have based on historical returns (Auto) or your target return (Manual)
Total Invested: Your actual money invested (initial + all monthly contributions)
Total Gains/Loss: Absolute dollar difference between current value and total invested
Total Return %: Percentage gain/loss on your total invested amount
ROI from Initial Investment: How your starting lump sum has performed
CAGR: Compound Annual Growth Rate of your initial investment (Note: This shows initial investment performance, not full DCA strategy)
vs Benchmark: How you're performing compared to the expected returns
---
⚠️ Important Notes & Limitations
Data Requirements: Auto mode requires sufficient historical data (minimum 3 years recommended)
CAGR Limitation: CAGR calculation is based on initial investment growth only, not the complete DCA strategy
Projection Accuracy: Future projections are theoretical and based on historical returns - actual results may vary
Timeframe Support: Works ONLY on Daily (1D), Weekly (1W), and Monthly (1M) charts - no other timeframes supported
Update Frequency: Update "Current Portfolio Value" regularly for accurate tracking
---
📚 Educational Use & Disclaimer
This analysis tool can be applied to various stock and ETF charts for educational study of DCA mathematical concepts and historical performance patterns.
Study Examples: Can be used with symbols like AMEX:SPY , NASDAQ:QQQ , AMEX:VTI , NASDAQ:AAPL , NASDAQ:MSFT , NASDAQ:GOOGL , NASDAQ:AMZN , NASDAQ:TSLA , NASDAQ:NVDA for learning purposes.
EDUCATIONAL DISCLAIMER: This indicator is a study tool for analyzing Dollar-Cost Averaging strategies. It does not provide investment advice, trading signals, or guarantees. All calculations are theoretical examples for educational purposes only. Past performance does not predict future results. Users should conduct their own research and consult qualified financial professionals before making any investment decisions.
---
© 2025 TradeVizion. All rights reserved.

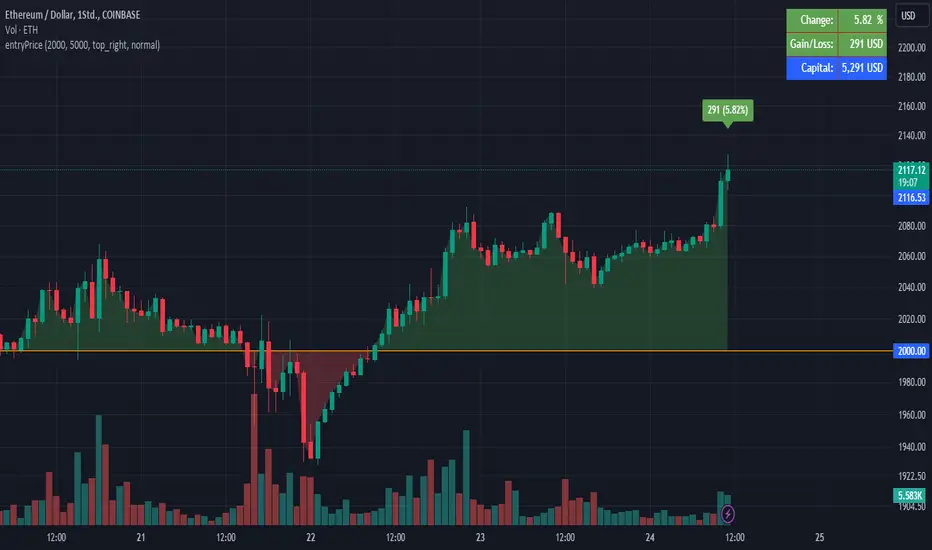
EntryPrice Gain&Loss IndicatorThis indicator takes (1) an entry price or average position price and (2) position size (denominator) to calculate current gain or loss and returns those as well as the position change in percent. It will also draw into the Chart and show relevant data in a table.
It is mainly supposed to help tracking an (average) spot position easily.
It is recommended to switch it to invisible when switching to other charts.
You can also use several instances of the indicator to track your positions in different assets.
Features:
- table position and text size can be adjusted
- colors can be changed
(recommending 25% opacity for plot backgrounds)
- several instances possible
(recommended to tuen indicator invisible when switching to other charts or analyzing
Version 1.0
lib_trackingLibrary "lib_tracking"
tracking highest and lowest with anchor point to track over dynamic periods, e.g. to track a Session HH/LL live and get the bar/time of the LTF wick that matches the HTF HH/LL
// DESIGN DECISION
// why anchored replacements for ta.highest / ta.highestbars / ta.lowest / ta.lowestbars:
// 1. they require a fixed length/lookback which makes it easier to calculate, but
// 2. this prevents us from tracking the HH/LL of a changing timeframe, e.g. live tracking the HH/LL of a running session or unfinished higher timeframe
// 3. tracking with anchor/start/reset flag allows to persist values until the next start/reset, so no other external storage is required
track_highest(value, reset, track_this_bar)
Parameters:
value (float)
reset (bool) : boolean flag to restart tracking from this point (a.k.a anchor)
track_this_bar (bool) : allows enabling and disabling of tracking, e.g. before a session starts or after it ends, values can be kept until next reset.
track_lowest(value, reset, track_this_bar)
Parameters:
value (float)
reset (bool) : boolean flag to restart tracking from this point (a.k.a anchor)
track_this_bar (bool) : allows enabling and disabling of tracking, e.g. before a session starts or after it ends, values can be kept until next reset.
track_hl_htf(htf, value_high, value_low)
Parameters:
htf (string) : the higher timeframe in pinescript string notation
value_high (float)
value_low (float)
Returns:

TradeTrackerLibrary "TradeTracker"
Simple Library for tracking trades
method track(this)
tracks trade when called on every bar
Namespace types: Trade
Parameters:
this (Trade) : Trade object
Returns: current Trade object
Trade
Has the constituents to track trades generated by any method.
Fields:
id (series int)
direction (series int) : Trade direction. Positive values for long and negative values for short trades
initialEntry (series float) : Initial entry price. This value will not change even if the entry is changed in the lifecycle of the trade
entry (series float) : Updated entry price. Allows variations to initial calculated entry. Useful in cases of trailing entry.
initialStop (series float) : Initial stop. Similar to initial entry, this is the first calculated stop for the lifecycle of trade.
stop (series float) : Trailing Stop. If there is no trailing, the value will be same as that of initial trade
targets (float ) : array of target values.
startBar (series int) : bar index of starting bar. Set by default when object is created. No need to alter this after that.
endBar (series int) : bar index of last bar in trade. Set by tracker on each execution
startTime (series int) : time of the start bar. Set by default when object is created. No need to alter this after that.
endTime (series int) : time of the ending bar. Updated by tracking method.
status (series int) : Integer parameter to track the status of the trade
retest (series bool) : Boolean parameter to notify if there was retest of the entry price
HarmonicPatternTrackingLibrary "HarmonicPatternTracking"
Library contains few data structures and methods for tracking harmonic pattern trades via pinescript.
method draw(this)
Creates and draws HarmonicDrawing object for given HarmonicPattern
Namespace types: HarmonicPattern
Parameters:
this (HarmonicPattern) : HarmonicPattern object
Returns: current HarmonicPattern object
method addTrade(this)
calculates HarmonicTrade and sets trade object for HarmonicPattern
Namespace types: HarmonicPattern
Parameters:
this (HarmonicPattern) : HarmonicPattern object
Returns: bool true if pattern trades are valid, false otherwise
method delete(this)
Deletes drawing objects of HarmonicDrawing
Namespace types: HarmonicDrawing
Parameters:
this (HarmonicDrawing) : HarmonicDrawing object
Returns: current HarmonicDrawing object
method delete(this)
Deletes drawings of harmonic pattern
Namespace types: HarmonicPattern
Parameters:
this (HarmonicPattern) : HarmonicPattern object
Returns: current HarmonicPattern object
HarmonicDrawing
Drawing objects of Harmonic Pattern
Fields:
xa (series line) : xa line
ab (series line) : ab line
bc (series line) : bc line
cd (series line) : cd line
xb (series line) : xb line
bd (series line) : bd line
ac (series line) : ac line
xd (series line) : xd line
x (series label) : label for pivot x
a (series label) : label for pivot a
b (series label) : label for pivot b
c (series label) : label for pivot c
d (series label) : label for pivot d
xabRatio (series label) : label for XAB Ratio
abcRatio (series label) : label for ABC Ratio
bcdRatio (series label) : label for BCD Ratio
xadRatio (series label) : label for XAD Ratio
HarmonicTrade
Trade tracking parameters of Harmonic Patterns
Fields:
initialEntry (series float) : initial entry when pattern first formed.
entry (series float) : trailed entry price.
initialStop (series float) : initial stop when trade first entered.
stop (series float) : current stop updated as per trailing rules.
target1 (series float) : First target value
target2 (series float) : Second target value
target3 (series float) : Third target value
target4 (series float) : Fourth target value
status (series int) : Trade status referenced as integer
retouch (series bool) : Flag to show if the price retouched after entry
HarmonicProperties
Display and trade calculation properties for Harmonic Patterns
Fields:
fillMajorTriangles (series bool) : Display property used for using linefill for harmonic major triangles
fillMinorTriangles (series bool) : Display property used for using linefill for harmonic minor triangles
majorFillTransparency (series int) : transparency setting for major triangles
minorFillTransparency (series int) : transparency setting for minor triangles
showXABCD (series bool) : Display XABCD pivot labels
lblSizePivots (series string) : Pivot label size
showRatios (series bool) : Display Ratio labels
useLogScaleForScan (series bool) : Use log scale to determine fib ratios for pattern scanning
useLogScaleForTargets (series bool) : Use log scale to determine fib ratios for target calculation
base (series string) : base on which calculation of stop/targets are made.
entryRatio (series float) : fib ratio to calculate entry
stopRatio (series float) : fib ratio to calculate initial stop
target1Ratio (series float) : fib ratio to calculate first target
target2Ratio (series float) : fib ratio to calculate second target
target3Ratio (series float) : fib ratio to calculate third target
target4Ratio (series float) : fib ratio to calculate fourth target
HarmonicPattern
Harmonic pattern object to track entire pattern trade life cycle
Fields:
id (series int) : Pattern Id
dir (series int) : pattern direction
x (series float) : X Pivot
a (series float) : A Pivot
b (series float) : B Pivot
c (series float) : C Pivot
d (series float) : D Pivot
xBar (series int) : Bar index of X Pivot
aBar (series int) : Bar index of A Pivot
bBar (series int) : Bar index of B Pivot
cBar (series int) : Bar index of C Pivot
dBar (series int) : Bar index of D Pivot
przStart (series float) : Start of PRZ range
przEnd (series float) : End of PRZ range
patterns (bool ) : array representing the patterns
patternLabel (series string) : string representation of list of patterns
patternColor (series color) : color assigned to pattern
properties (HarmonicProperties) : HarmonicProperties object containing display and calculation properties
trade (HarmonicTrade) : HarmonicTrade object to track trades
drawing (HarmonicDrawing) : HarmonicDrawing object to manage drawings
Average Cost (Costo Promedio)ENGLISH
This 'Average Cost' script allows the user to input and visualize profit or loss for different stocks (up to 50) with average cost and quantity data on a single chart. This is useful for tracking the profit or loss of each stock in real-time.
To use this script, the user should follow these steps:
1. Add the 'Average Cost' script to your TradingView chart.
2. In the script's configuration window, input the tickers, average costs, and quantity of shares for each ticker you want to monitor.
3. Click 'Accept' to apply the changes.
This script is primarily designed for stock markets, but can also be useful in other financial markets where the user is interested in tracking the performance of multiple assets.
ESPAÑOL
Este script de "Costo Promedio" permite al usuario ingresar y visualizar si hay ganancia o perdida para diferentes acciones (hasta 50) con los datos de costos promedio y cantidad de acciones en un solo gráfico. Esto es útil para realizar un seguimiento de la ganancia o pérdida de cada acción en tiempo real.
Para utilizar este script, el usuario debe seguir estos pasos:
1. Agregue el script "Costo Promedio" a su gráfico en TradingView.
2. En la ventana de configuración del script, ingrese los tickers, costos promedio y cantidad de acciones para cada ticker que desee monitorear.
3. Haga clic en "Aceptar" para aplicar los cambios.
Este script está diseñado principalmente para los mercados de acciones, pero también puede ser útil en otros mercados financieros donde el usuario esté interesado en rastrear el rendimiento de múltiples activos.

basilPort Portfolio Tracker Pro [basilChart]This script is helps giving detailed information about the portfolio.
Prominent features of this portfolio tracking indicator are:
- Chart of your portfolio: This portfolio tracker let’s you view the chart of your portfolio real-time.
- Visualized Profit/Loss: Indicator will let you know of your profit and loss on the chart.
- In-Depth Monitoring: Most Gained 1st, 2nd, 3rd and Most Lost 1st, 2nd, 3rd.
- All Time Highs: Let’s us view All Time Highs on the portfolio chart for each equity on the chart.
- 40 Different Symbols: Supports monitoring 40 different symbols at the same time, real-time.
- 10 Pair Detailed View: For the first 10 symbol in our portfolio, indicator supports viewing detailed info about each of them. Such as: Price, Cost, Qty, Profit Percentage, Chart TF Profit Percentage, Weight
basilPort Portfolio Tracker Pro indicator can be used to:
- Track your investments: The basilPort Portfolio Tracker allows you to enter all your investments and their associated details, such as the ticker symbol, purchase price, and quantity. It then calculates your total portfolio value, including gains and losses.
- Monitor portfolio performance: Provides an overview of your portfolio's performance over time. You can see how your portfolio is performing on a daily, weekly, or monthly basis, and compare it to the performance of the overall market.
- Analyze asset allocation: Helps you analyze your portfolio's asset allocation, which is the percentage of your portfolio invested in different symbols. You can use this information to adjust your portfolio and diversify your holdings.
- Set investment goals: You can use the Portfolio Tracker to set investment goals and track your progress towards achieving them. For example, you can set a goal of achieving a certain rate of return or accumulating a specific amount of wealth by a certain date.
Overall, the Portfolio Tracker is a useful tool for investors who want to monitor their portfolio's performance, evaluate their investment strategies, and make informed investment decisions.
Best and worst 3 performers in our portfolio:
From Data Window, script let’s us see the best and worst 3 performers in our portfolio. To know how to read it we follow this pattern:
- Check 1st Gained value.
- Find the nth symbol from script’s Inputs tab.
- Check 1st Gained to see its Profit Percentage.
An example scenario to reading Data Window is explained at the very end of the description.
Using the script:
- Add this script to the chart from indicators tab
- Set starting date for the basilGrid Portfolio Tracker Pro either by dragging and dropping the vertical line or by the date-time picker from indicator Inputs tab.
- Set symbols and enable them to monitor with this indicator.
- Set quantity and price information for the symbols you have selected.
- Set visual settings to tailor your experience.
basilPort Portfolio Tracker is an indicator that allows you to track and analyze the performance of your investment portfolio over time. It's a helpful tool for investors who want to monitor their holdings and evaluate their investment strategies.
In this example we used pair BTCUSDT 1h timeframe, our settings are:
Inputs Tab:
- Start Date: 2022-12-13 13:00
- Show All Time Highs: Unchecked
- Show Pair Data (First 10): Checked
- Show Total Data: Checked
Symbols:
- BINANCE:ETHUSDT Qty 4.2 Price 1 332
- BINANCE:BTCUSDT Qty 0.5 Price 17 469
- BINANCE:BNBUSDT Qty 20 Price 270
- BINANCE:AVAXUSDT Qty 200 Price 13.61
- BATS:PYPL Qty 50 Price 78.5
- BATS:AMZN Qty 40 Price 95.4
- BATS:ETSY Qty 40 Price 135.64
For example, if you check Data Window, you'll see the following:
An example scenario:
- Bought Portfolio Value 39142.98 => The cost of the portfolio
- Current Portfolio Value 39142.98 => The current value of the portfolio
- 1st Gained 2.00 => The most gained symbol's index. (Checking the Symbols what we see on the 2nd spot is this symbol, we can see this value indicates BINANCE:BTCUSDT)
- 1st Gained 28.09 => Means BINANCE:BTCUSDT is +%28.09
- 2nd Gained 4.00 => Again, after checking the Symbols, we now know what this value indicates. It is AVAXUSDT.
- 2nd Gained 18.59 => Means BINANCE:AVAXUSDT is +%18.59
..
And so on to Lost section. Only difference between Gained and Lost section indicates Lost equities.
This script's purpose is to make easier to have more control over the portfolio. With in depth data that’ll help with decision-making.

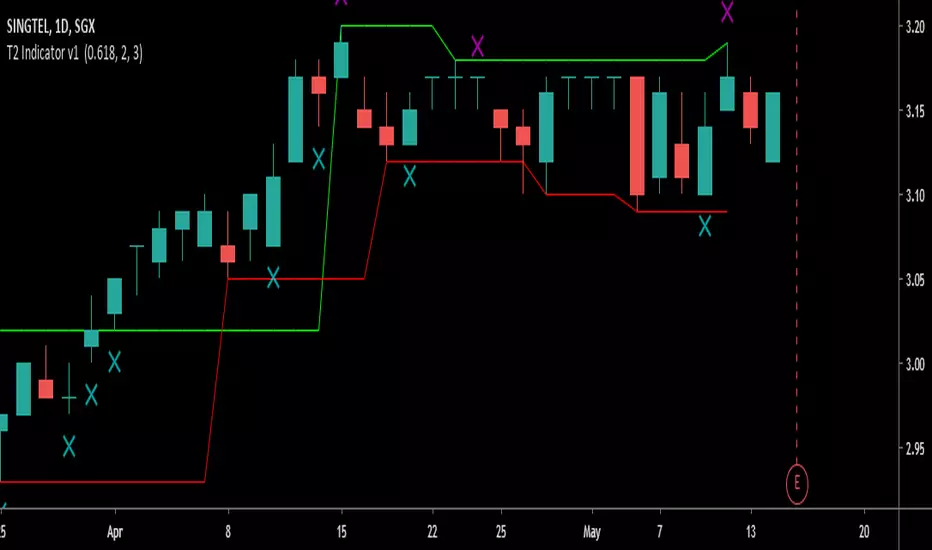
Trend Tracking Indicator v1The Purpose of this Script is to help the user track the trend by
1) Defining clearly Entry and Exit levels
2) Profit Protection Levels
3) Stay in a trend as long as possible
It automatically draws and updates the boxes dynamically as the trend progresses in Stair Stepping Behaviour in uptrend or downtrend
a) Darvas Box (5 Bar System)
b) Fractal Boxes (5 bar System)
There is a switch at the indicator interface for user to choose between Fractal or Darvas boxes to better represent the stock/Crypto/Commodity/Forex
pair the user is trading.
In the event that the trend gears up and runs up in a parabolic behaviour
Alternate Profit Protection Levels based on 2 Bar System is there to provide an alternative to tracking the trend and protecting profits.
In general being a price action indicator, it can apply to any assets or timeframe.
by Crypto DanX.
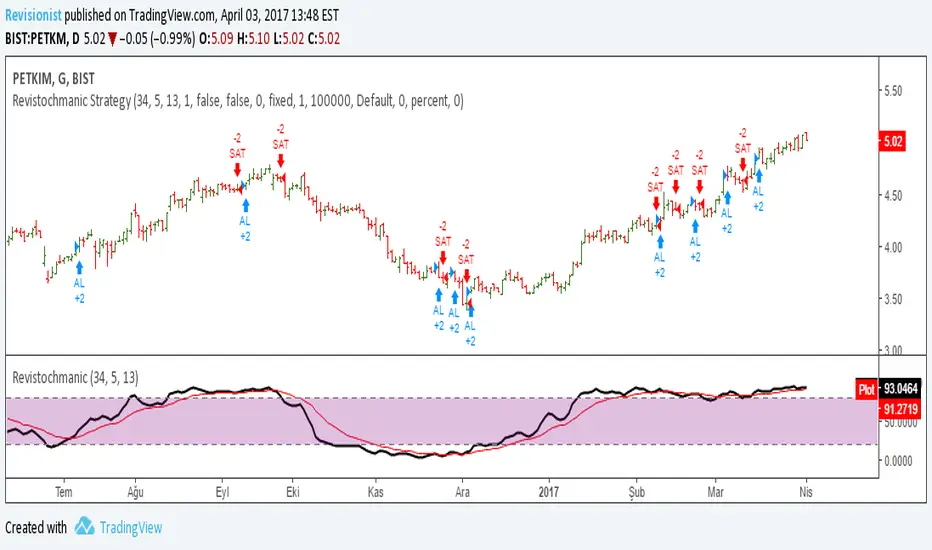
Revistochmanic StrategyRevistochmanic Wave is a stock tracking trends indicator & strategy for medium & long term investing.