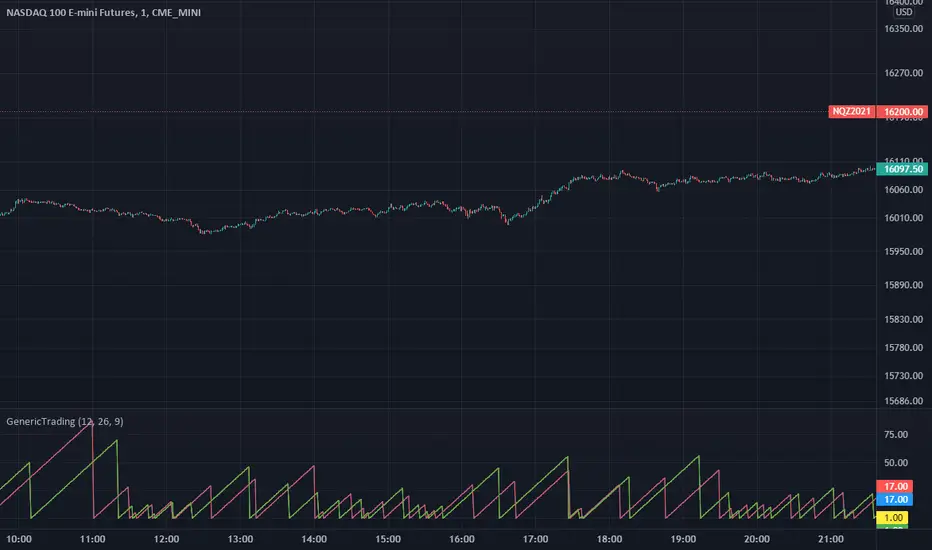
GenericTradingLibrary "GenericTrading"
This library aims to collect rare but useful operations for
get_most_recent_long_or_short_position_closed_index() : returns most recent long/short closed bar index.
get_most_recent_long_or_short_position_open_index() : returns most recent long/short closed bar index.
These two functions designed to help to speed up the coding for strategies that contains "re-enter" logic.
These two functions also could applies in the situations where time-count is needed in your condition.
Trade
Khair Day trade with profit lossBest used when applied for intraday trading. Users can customize length and deviation to fit their needs. Works best for high volatility stocks.
This strategy only works intraday intervals, so it means when you try to apply it to day/week/month it won't show any entry or exits.
Bollinger band breakout with non-standard deviation along with profit targets and stop loss.
There are 2 profit targets that can be adjusted based on individual preference.
This strategy minimizes risk and only opens trades when the probability of profitability is higher.

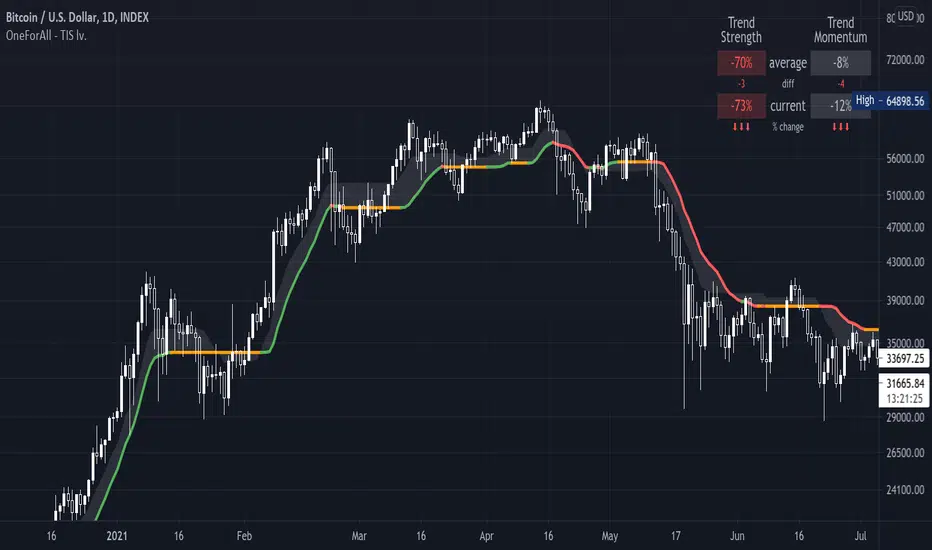
One For All - Trend Insight System (Light ver.)Introduction :
Compared to the TIS v1.0, this "light" version is simpler to use and to understand, hence it will suits the basic needs of traders and investors looking for a clear and user friendly indicator to assess the current trend situation for continuous markets. The settings allow an adaptation for call markets, but more backtesting needed at your discretion (see notes below on call markets).
The TIS takes price action, volume and volatility, to :
- provide a clear and easy to interpret global picture on the current trend siuations
- give hints for decent take profit and exit points
- help find support and resistance levels
- assess trend strength and momentum
Disclaimer :
The Trend Insight System (TIS) is among the most perfected trend following indicator. Built around the Verbatim (the main colored line), it is inspired by Tushar S. Chande's work on volatility, that I really enjoyed reworking in-depth and re-engineer from scratch, after some tweaks and managing to factor-in the volumes, the Verbatim was born.
The Verbatim is essentially a "smart" moving average that will adapt itself to the price action, the volatility and the volumes, in order to filter-out whipsaw price action and help the user clarify opportunities for trend trading. Since the various components of the TIS helps serve as Support & Resistance level (see examples below), it will also prove to be helpful for swing traders.
Please use with caution, proper risk management and along with your favorite oscillator, channels, candlestick reading and signals system (such as the Pattern Detection System that will be provided complimentary to the TIS, in a separate script).
Some explanation :
Verbatim line :
- Green shows a bullish trend, orange for consolidation and red for bearish trend
- When it consolidates, it can be extended to the right to be used as a Support & Resistance line
example use case :
In summary :
- A possible entry is when price action confirms over the consolidating (orange) Verbatim, or after the Verbatim turns green. Please note that they both can prove to be false trend start, so these signals are best used with other indicators for confirmation
- A possible exit point show up when the price action starts closing into the Verbatim, or even safer, when the price action confirms under the verbatim, again, to be used with other indicators on the side
Trend Strength and Momentum:
- Read the current status at a glance
- Trend strength is the relative position of each trend lines (most of which are hidden on this "light" version), from -100% (=bear power) to +100% (=bull power)
- Momentum is measuring the slope of the Verbatim (and another hidden "smart" trend line) also from -100% to +100%; trend lines pointing downwards = bears waking up / in force, horizontal = consolidation or upwards = bulls waking up/in force
Important notes :
While is a very powerful yet easy to read Technical Analysis tool, it has been fully optimized for continuous markets such as crypto.
It is highly advised to use the default settings provided as they have been backtested more thoroughly ("continuous market" and "close" input)
To prevent confusing casual users and to avoid overoptimization -risky at best and counter productive at worst, according to legendary traders such as Mark Douglas- this version has most of the customization settings locked out; volume integration, smoothing method used, smoothing constant, volatility setting, period of study. The settings left available are :
- continuous market / call market selection, selecting "continuous maket" will use a specifically designed method of calculation for volatility , based on ATR, while selecting "call market" will automatically use ATR for calculating the volatility , and
- input source selection for the volatility calculation, which only works for "continuous market".
The locked out settings might be included in the future in a more restricted yet complete "Expert mode" version.
End notes :
It will always be considered a work in progress to help bring out the best of trend analysis.
Suggestions are welcomed to make it a more user-friendly tool.
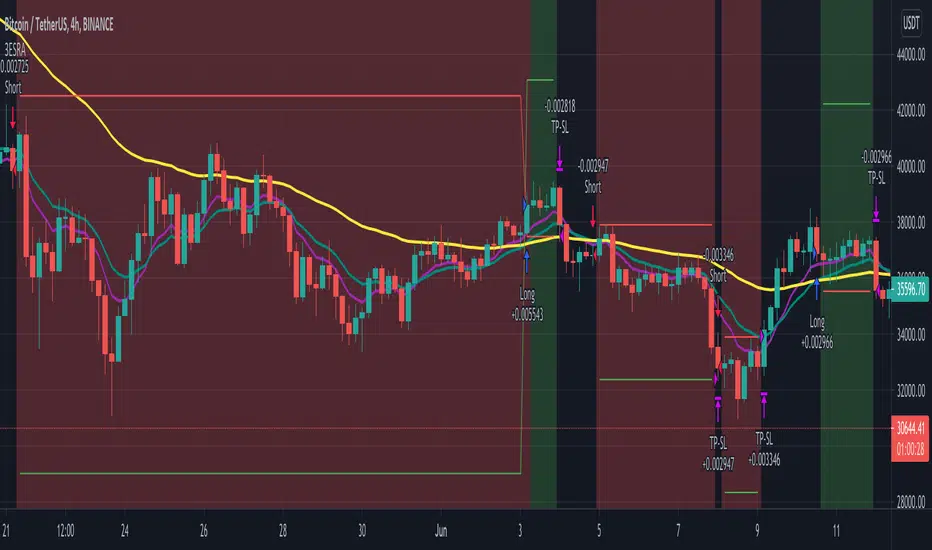
3 EMA + Stochastic RSI + ATR 3ESRA
v0.2a
Coded by Vaida Bogdan
3ESRA consists of a 3 EMA cross + a close above (for longs) the quickest EMA
or below (for shorts). Note that I've deactivated the RSI Cross Over/Under
(you can modify the code and activate it). The strategy also uses a stop loss
that's at 1 ATR distance from the entry price and a take profit that's at
4 times the ATR distance from the entry price.
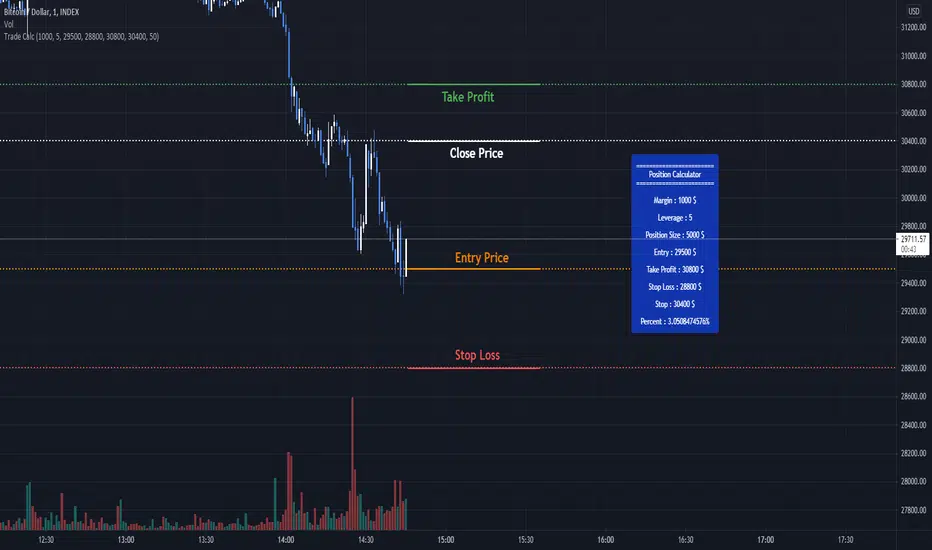
Trade Calculator by RealmixA clean Trade Calculator for any Asset, which calculates everything you need to know.
This script is a modified version of the Position Calculator by Mysteriown. Link:
I try to make it a bit better for Futures Trading.
One For All - Trend Insight System v1.0Introduction :
The TIS takes price action, volume and volatility, to :
- provite a clear and easy to interpret global picture on the current trend siuations
- give hints for good take profit and exit points (see local consolidation line)
- help find support and resistance levels
- assess trend strength and momentum
Disclaimer :
The Trend Insight System (TIS) is among the most perfected trend following indicator. Built around the Verbatim (the main colored line), it is inspired by Tushar S. Chande's work on volatility, that I really enjoyed reworking in-depth and re-engineer from scratch, after some tweaks and managing to factor-in the volumes, the Verbatim was born.
The Verbatim is essentially a "smart" moving average that will adapt itself to the price action, the volatility and the volumes, in order to filter-out whipsaw price action and help the user clarify opportunities for trend trading. Since the various components of the TIS helps serve as Support & Resistance level (see examples below), it will also prove to be helpful for swing traders.
Please use with caution, proper risk management and along with your favorite oscillator, channels, candlestick reading and signals system (such as the Pattern Detection System that will be provided complimentary to the TIS, in a separate script).
Some explanation :
Verbatim line :
- Green is bullish trend, orange for consolidation and red for bearish trend
- When it consolidates, it and be extended to the right to be used as a Support & Resistance line
example use case :
Local consolidation line :
- A more optimal way to find an exit point when we have missed a top formation
example use case :
Verbatim channel :
- A way to visualize price disequilibrium
example use case:
Verbatim cloud:
- Stronger Support and Resistance levels
- Price disequilibrium
- Consolidation range (when Verbatim is inside the cloud and did not go through)
example use case:
Trend Strength and Momentum:
- Read the current status at a glance
- Trend strength is the relative position of each trend lines, from -100% (=bear power) to +100% (=bull power)
- Momentum is measuring their slope also from -100% to +100%; trend lines pointing downwards = bears waking up / in force, horizontal = consolidation or upwards = bulls waking up/in force
Important notes :
While is a very powerful yet easy to read Technical Analysis tool, it has been fully optimized for continuous markets such as crypto.
Each item of the Trend Insigth System can be disabled to suit your personal use. It is highly advised to use the default settings provided.
To prevent confusing casual users and to avoid overoptimization -risky at best and counter productive at worst, according to legendary traders such as Mark Douglas- this version has most of the customization settings locked out; volume integration, smoothing method used, smoothing constant, volatility setting, period of study. The settings left available are :
- continuous market / call market selection, selecting "continuous maket" will use a specifically designed method of calculation for volatility, based on ATR, while selecting "call market" will automatically use ATR for calculating the volatility, and
- input source selection for the volatility calculation, which only works for "continuous market".
The locked out settings might be included in the future in a more restricted yet complete "Expert mode" version.
End notes :
It will always be considered a work in progress to help bring out the best of trend analysis.
Suggestions are welcomed to make it a more user-friendly tool.

Wide BarsSimple scripts show the wide range bars within in the look back period, visualizing the bigger momentum.
Added four exponential moving averages which define the trend of the instrument.
Wide range candles in the direction of overall trend on higher timeframes; give confluence of higher participation in the same direction.
Note : Decent volume above the average volume with wide range candle adds more value.

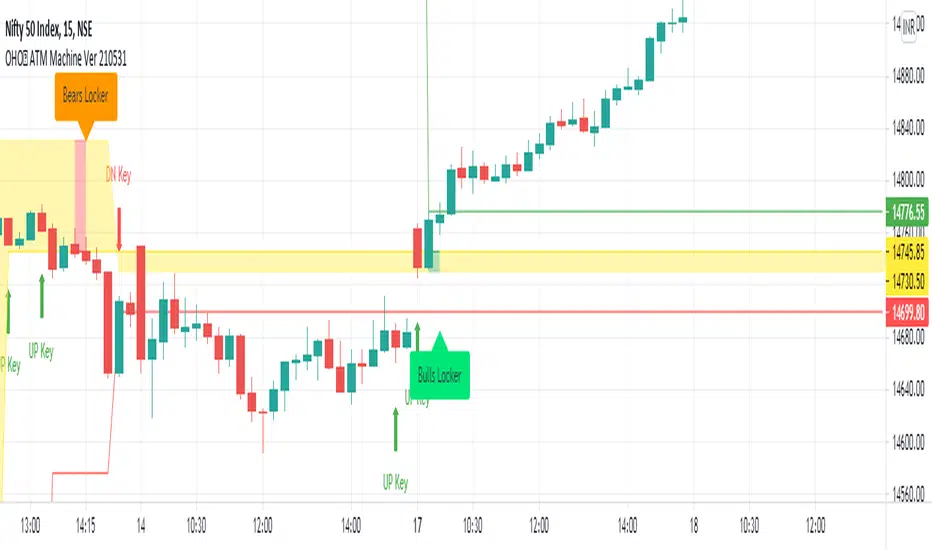
OHO ATM MachineStudies Used:
We have used different type of candle stick patterns, open, close, high, low, Moving Averages, volumes and Average True Ranges in creation of this indicator.
Usage:
It can be used for scalping and intra-day trading. It works best on Nifty 5 Minutes , 15 Minutes, 1 Hour, Daily, Weekly and Monthly Time Frames.
It provides easy to visualize multiple information:
1) It gives the correct Entry on Time. Yellow ATM Area, Means No Trade.
2) Fake Signals are shown when There is Sell Signal and Below is ATM Area.
3) Fake Signals are shown when There is Buy Signal and Above is ATM Area.
4) It gives proper Target at the time of Entry.
5) Stop Loss is Hit when The Candle Closes below ATM Area in Buying and vice versa.
6) No Trade is Recommended, when ATM Area is Yellow.
How to read OHO ATM Machine Indicator?
Buy - When ATM Area is Turned Green in Color First Time after Last Red.
Sell - When ATM Area is Turned Red in Color First Time after Last Green.
Stop Loss - When The Candle Closes below ATM Area in Buy Trade and When The Candle Closes above ATM Area in Sell Trade.
Target - Thin Green Line for Buy Trade and Thin Red for Sell Trade.
Trailing SL - We can Trail the Trade, till the Stop Loss is HIT.
Recommendations:
This can be used for Nifty, Bank Nifty, Stocks, Commodities, Bitcoin, Currency and any other tradable instrument.
What time frame should I use?
5 Minutes and 15 Minutes are best time-frames for Intra-day Trades.
15 Minutes and Hourly are best time-frames for Swing Trades.
Hourly and Daily are best time-frames for Short Term Trades.
But you can check different time-frames in Strategy Testing section or as per your requirements.
Disclaimer:
Past performance is not the guarantee of future performance.
For any type of queries kindly send us personal message.
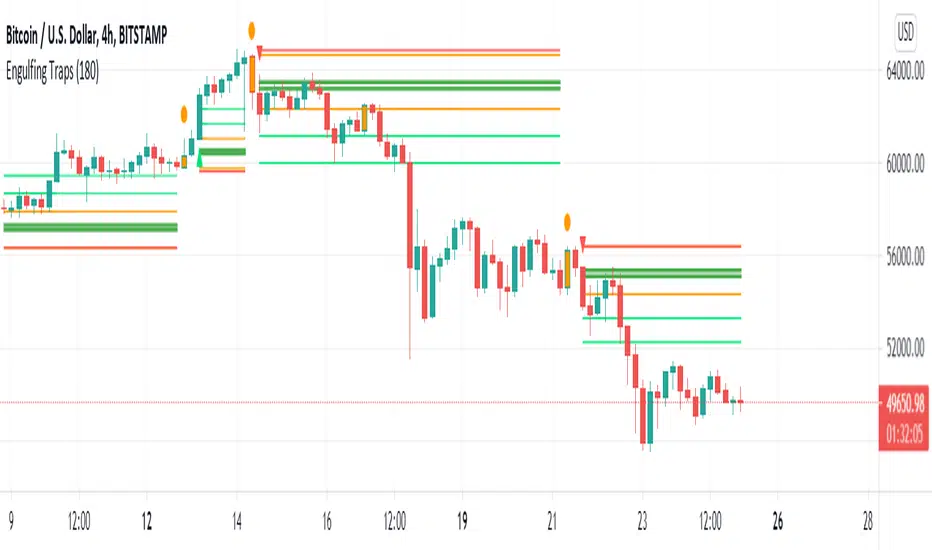
Engulfing Traps (Beta)This indicator scans the market for entries based on engulfing candles that "trap" candles (in terms of orders and price)
The indicator also detects killzones, which are basically supply and demand zones. We like to think of these as areas of which banks are placing their orders.
The indicator gives the 2 entry lines once the a breakout candle has appeared (red or green arrow on the engulfing)
Once the arrow appears on the breakout candle, the indicator will then draw:
-2 orange lines to box up the engulfing candle
-2 entry lines (dark green)
-SL line (red)
-2 Take profit lines (bright green)
New traps are not taken when a current trap is still active
*This indicator in no way is meant to be 100% accurate, please do your own analysis before placing any trades and trade with proper risk, as this market is extremely volatile and risky. Past profits don't guarantee future results*
FOR ACCESS: Please send us a private message to gain access to this indicator.
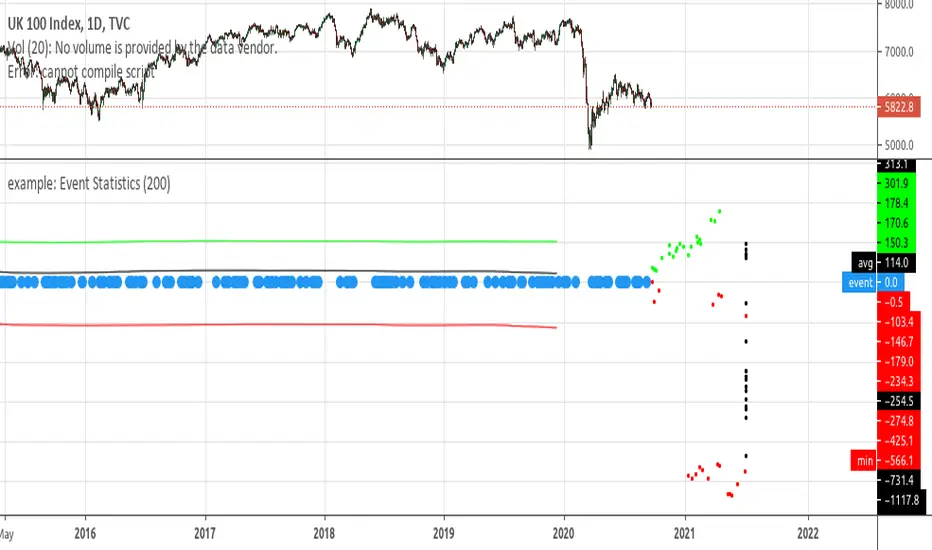
example: Event StatisticsEXPERIMENTAL:
A example on how to retrieve statistics from a recurring event.
Can be used to optimized strategy's, trade parameters, etc..
Alert of Cryptooo fox HYPER trading(CRYPTOOO FOX ( BCH ) long & short no repaint strategy)
Hello traders
- The alert of strategy is using higher time frame but it never repaint .
- The alert of strategy is working only in ( 10 % of equity ) you can change it as you want .
- When you use this alert you will get this message alert ( THIS INDICATOR MAY BE REPAINT )
and this is normal so we use higher time frame but as i said it ( never repaint )
- The alert of strategy is working in ( BCH / USDTP ) and ( BTC / USDTP) IN BINANCE FUTURE MARKET .
- I recommanded too much using ( 15 min , 30 min ) charts .
- This script is working in standard charts no ( heikien ashi or range ) charts .
- ( TO ACCES THIS SCRIPT PLEASE USE THE LINKS BELOW ) .

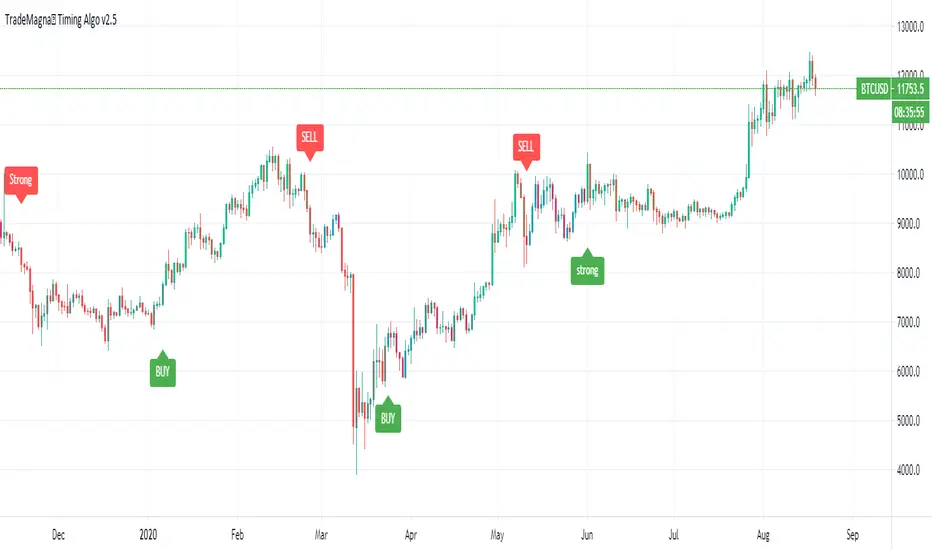
TradeMagna™ Timing Algo V2.5Over the years we've come up with three of the most profound problems that most traders struggle with:
1- when to take profits?!
2- how to hold my winning positions without overly thinking?
3- how can I get a trading system without conflicting indicators?
What makes TradeMagna Algo very unique is that it emphasizing the act of taking profit and be steady for the next position, and when you have a winning position it will let you keep it without overly thinking about closing it every while!
The main features you will find in our TradeMagna Algo V2 are standard buy&sell signals, strong signals, and candlestick coloring. All of these features don’t contradict each other but otherwise complement each other in an unprecedented way to be used as a complete trading system!
TradeMagna algo can identify synchronized trends “trend periods” and unsynchronized trends “ranging periods” when taking profits happens through range breakouts and multiple indicators working together under the hood without contradicting each other. Strong signals (Green or Red "Strong" tags) will trigger when either standard signals turned strong "synchronized", or when a new trend signal has triggered from purple candles.
When you get purple candles, it means to take profit and be steady for the next signal to trigger, or "be cautious" in your current position if the last triggered signal was strong.
Trend identifying strategies typically fails when markets are ranging and triggers many false signals, and to overcome this as best as possible, our purple candles indicate when strong signals may not be heading in the right direction; and that's what we mean by "be cautious" in your position...
Strong signals are the only signals for entering long or short positions and all standard buy and sell signals activate purple candles until it gets synchronized, so then it's safe to trade.
TradeMagna can be used on any market, and you can use either standard candlesticks, Heikin Ashi Candles (recommended), or TradeMagna Noise Removal (highly recommended) for spotting trends better as a swing trader.
Our strategy is ideally used for swing traders on higher timeframes such as 4H, 12H, 1D, 2D, 3D, 1W, and even on very high timeframes with good past results such as 1M, 3M on instruments like Bitcoin, currencies, Gold, or the S&P500, etc...
per our disclaimer on our website, if you are using this script you acknowledge that past performance is not necessarily indicative of future results, and no script can 100% guarantee success in trading.
You can use the link below to visit our website and gain access to the script.
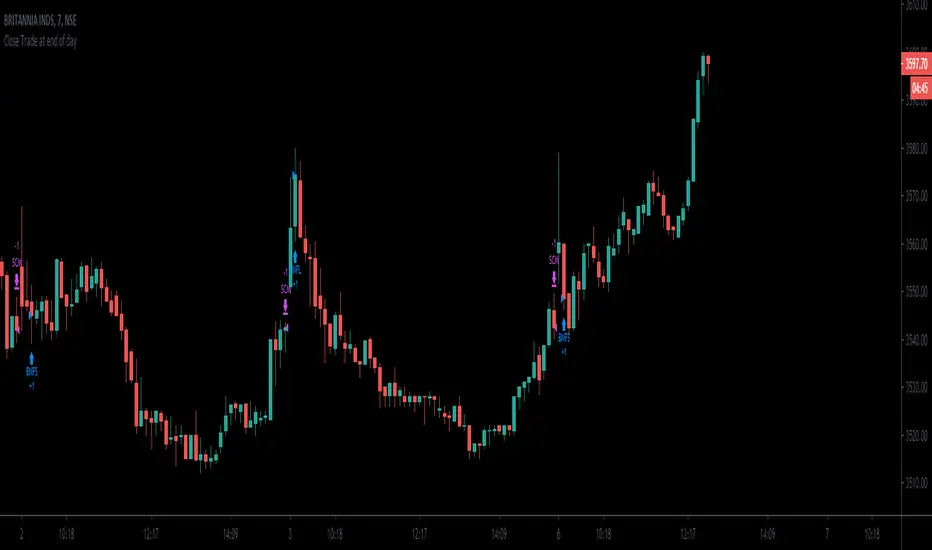
Close Trade at end of day script serves as an example how we can close trades at end of day.
can be session controlled or the time controlled.
the session should be adjusted to be earlier than the candle time.
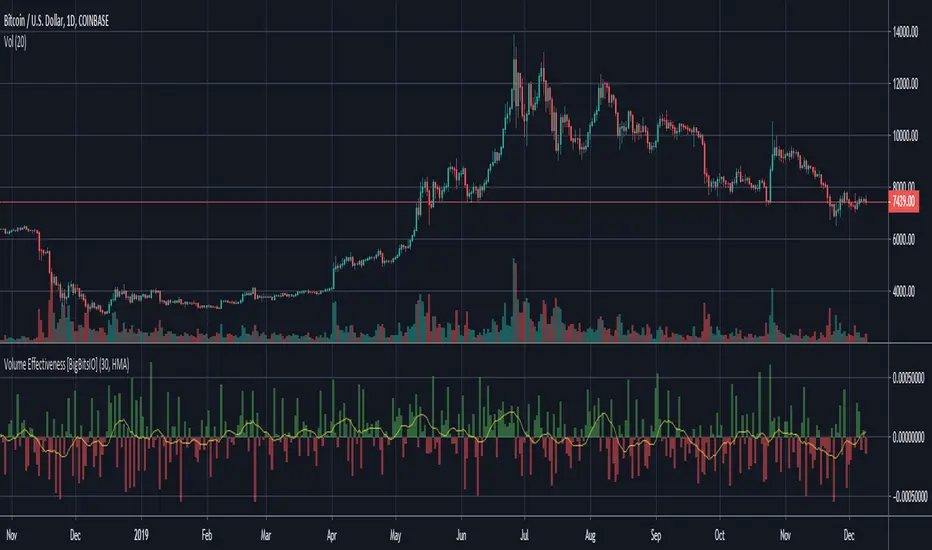
Volume Effectiveness [BigBitsIO]This Volume Effectiveness indicator is designed to allow users to try and identify how effective volume is on each candle, and smoothing those values over time to try to find trends.
Volume Effectiveness is the % change in price for each single unit of volume on the associated candle. The value can be positive or negative, but there is an option to just monitor an absolute value.
Features:
- Volume Effectiveness
- Toggle if Volume Effectiveness should be an absolute value
- Toggle visibility of bars
- Smoothed moving average of Volume Effectiveness
- Adjustable period on the smoothed moving average
- Several moving average types available to use for the smoothed moving average
- Toggle visibility of smoothed moving average
DK-Invest-Multi-Indicator-Background Color Signals-Testing OnlyThis is currently categorized as an "Invite Only" script and is being tested by a small number of users in the community. The goal is to release to the general community in the near future. The script will likely remain protected due to the amount of time invested in its development. This may change at some point in the future!
This script is unique in that it not only combines multiple indicators and multiple resolutions into a single view, but the source data is not derived directly from price. Rather it is built on a weighted point scale utilizing SMA trends and crosses spanning multiple resolutions. This point scale provides a slightly different and more predictive approach than typical indicators that are reacting to price changes.
Can be viewed with reliable buy/sell signals on any resolution from 5s to 480m. It depends only on preference and whether the goals are short-term or long-term trading.
<<< Please make sure to review Trading View's documentation regarding the use of alerts on scripts that span multiple resolutions. A reminder/warning will be generated for each new/updated alert because of this. Note: As TV explains, it's not a bug, it's just the nature of the beast when dealing with indicators that combine multiple resolutions onto a single chart. >>>
I will be adding some images of the backtesting results shortly. The script is showing some extremely good ROIs. Want to get through another round of QA testing prior to releasing results. Stay tuned.
An Alt coin version will also be added soon. BTC is a bit unique in its volume and timing of buy/sell signals, which is why there is a separate script for now.
Thank you for your understanding. Questions please add a comment. Still getting use to checking for comments, so apologies if there is a delay in responding!
DK Investments (just me right now :->)

ZomyzoX Scalp 1 MinuteEnglish
XBTBTC, BTCUSD , BTCUSDT is a strategy made to parity for 1 minute. Scalp is a very successful strategy for trading. It is free to use. Optionally, other strategies can be written.
Contact
Twitter: @zomyzox
Mail: oguzhan.yilmaz@hotmail.com.tr
Türkçe
XBTBTC, BTCUSD , BTCUSDT paritesi için 1 DK'da scalp trade için yazılmıştır. Scalp trade için başarılı buluyorum. Kullanımı ücretsizdir. İsteğe göre başka stratejilerde yazabilirim.
İletişim
Twitter: @zomyzox
Mail: oguzhan.yilmaz@hotmail.com.tr

SpreadTrade - Distance (ps4 ver. 2)This script implements a rebrushed distance-based pair trading strategy. In this strategy, normally they trade the difference between the prices of two instruments. This difference is also called spread. Here, however we’ll trade the difference between two time frames of one instrument. And that's the main trick. Common procedure consists of the following steps:
1. Select two CORRELATED stocks. Here we'll use the same instrument in different TFs.
2. Generate the spread by calculating the difference between the prices/instruments. For distance based pair trading, we need to (rescale the data first and then) check the distance between them.
3. Define the logic to trade the spread and generate the trading signals. In this example we’ll calculate the rolling mean and rolling standard deviation of the spread. Whenever the spread goes above a rolling mean by one standard deviation, we’ll short the spread expecting the mean reversion behavior to hold true. And whenever the spread goes below its rolling mean by one standard deviation, we’ll go long on the spread.
Mind that the meaning of the orange and blue signals depends on whether tf variable is smaller or larger than the built-in timeframe.multiplier variable, i.e. tf of the chart.
For details see analyticsprofile.com
Donate: PayPal (paypal.me)


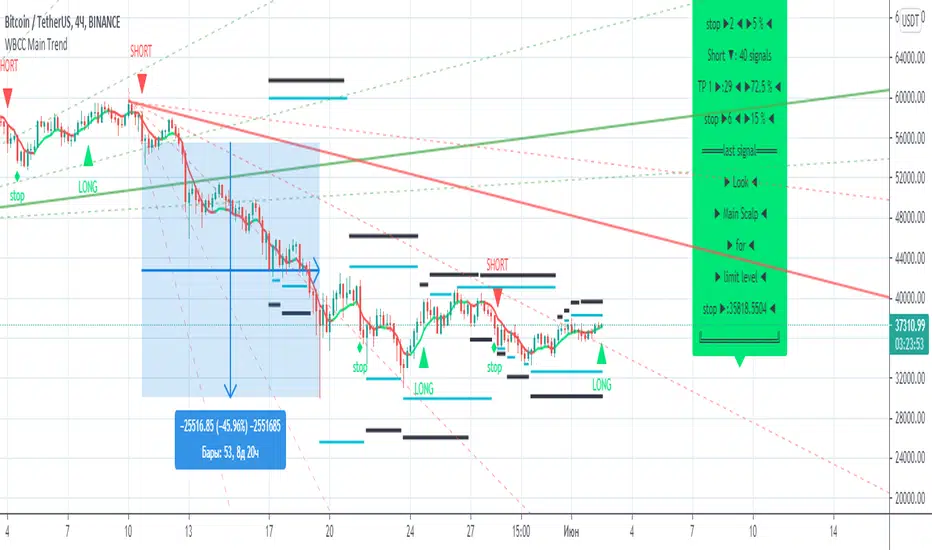
WBCC Main TrendИспользуется для определения движения основного тренда (Long/Short), а так же успешно может быть применен и на более маленьких временных интервалах.
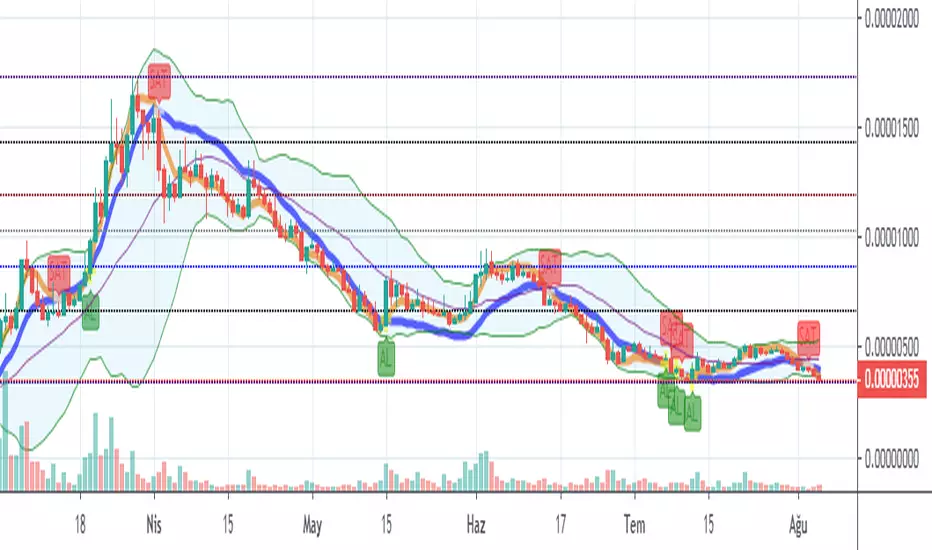
Günlük Al Sat Stratejileri / Day Trade StrategyMerhaba bu script ile günlük veya uzun vade için alım satım yapacağınız coinleri takip edebilirsiniz.DayTrade scriptini RSI ve MACD indikatörü ile beraber kullanırsanız daha net sonuçlar alırsınız.
Günlük alım satım yapacaksanız 5dk, 10dk ve 30dk periyotlarında coinlere göz atmalısınız.
Raven/Btc 15dk grafiği inceleyelim.DayTrade scriptini kullanırken sarı çizgi maviyi yukarı kestiğinde yükseliş başlangıcı olduğu için coini Al Aşağı keserse Sat.Tabiki bu scripti tek başına kullanmaktan ziyade RSI ve MACD indikatörü ile beraber kullanırsanız daha net sonuçlar alırsınız.Örnek bir resim ekleyeyim.
Görüldüğü üzere kırmızı ile işaretlediğim bölgede sarı çizgi yukarı kestiği halde rsı ve macd alım için net sonuç vermiyor.Yeşil bölgede ise DayTrade scripti, Rsı ve Macd alım sinyali veriyor ve coini alıyoruz.Sarı çizği mavi çizğiyi aşağı doğru kestiği zaman satış yapıyoruz.Tekrar yukarı kestiğinde alım yapılmalı.
RVN/BTC 1D grafik
350 satoshiden alınan Raven coin 1500 satoshiden satıldı.
Bittimi tabiki bitmedi :)
Sizi bilgisayar başında beklemekten kurtaran bir yöntemden bahsedeceğim.İstediğiniz zaman aralığında coini takip etmek istiyorsunuz ama sürekli pc başında beklemek istemiyorsanız kesişmelere alarm kurabilirsiniz.
Alım ve satım sinyallerinde hem bilgisayardan hemde tradingview uygulamalası üzerinden bildirim alabilirsiniz.
Üst paneldeki Saat işaretine tıklayın.5dk zaman dilimine göre alarm kuruyorum.Her kesişmede alarm çalacak ve uygulamayı kullanıyorsanız bildirim gelecek.Siz kaç dk takip etmek istiyorsanız ona göre alarm kurabilirsiniz.
Açılan penceredeki ayarları bu şekilde yapın
Herkese bol kazançlar.Bu sayede kazanç sağladıysanız kazancınızın bir kısmı ile düzenli olarak yardıma muhtaç insanlara yardım etmeyi unutmayız.
Faydalanılan kaynaklar www.tradingview.com