Backtest PRO Suite+ (Plug & Play)Hello traders
I. SCRIPTS ACCESS AND TRIALS
1. For the trial request access, they have to be done through my website .
2. My website URL is in this script signature at the very bottom (you'll have to scroll down a bit and going past the long description) and in my profile status available here : Daveatt
Due to the new scripts publishing house rules, I won't mention the URL here directly. As I value my partnership with TradingView very much, I prefer showing you the way for finding them :)
3. Many video tutorials explaining clearly how all our indicators work are available on your website > guides section.
4. You may also contact me directly for more information
II. Backtest PRO Suite+ (Plug & Play)
2.1 Forewords
This indicator is available only to our PRO 12 months users. YES! I said indicator, and not strategy or backtest for an excellent reason.
We wanted to make it as generic as possible and allow anyone to connect any indicator of his/her choice in a few clicks only.
This is NOT possible (in TradingView) with a strategy/backtest, but only with an indicator - that's why we worked on recoding the whole backtest logic as an indicator.
The PRO edition does not handle any pyramiding/re-entry - as such enters only once per trend by design. This feature is reserved for our PREMIUM users.
2.2 🔎 Concept 🔎
This is an indicator that I saw on TradingView and was introduced by the @Pinecoders account on TradingView.
I inspired myself from his Backtest Engine to offer a version more adapted to my vision - The benefits of connecting yourself any indicator to our Backtest engine are amazing and huge.
The concept can't be more simple. Imagine using any indicator and connecting to a backtest system in a single click.
You may connect your Algorithm Builder also to this complete backtesting system in a single click.
What's better between paying thousands for a backtest, or connecting yourself your indicator to your backtest with a click?
That was a rhetoric question, but you can still share your answer with me if you want to :)
III. The amazing benefits of our🔌&🕹️ (Plug&Play) system
Issue #1 💲 A BACKTEST SYSTEM IS COSTLY 💲
Hiring a developer to code a custom indicator is costly. For a custom backtest it's even more expensive as those scripts are very often way more complicated.
Now imagine, that now that you see your idea live on a chart, you'll realize you'll have to finance another backtest system, as the one you have is not compatible with your new idea.
Solution #1 💲💲 YOU COULD BE SAVING SOME MONEY 💲💲
just because it won't be needed to hire someone else for each of your trading idea.
We will never guarantee your success on the market, but THIS I stand by it any day any hour.
You can connect any indicator or your choice by updating your indicator slightly and connecting it to our Backtest engine. We send the tutorial for doing it to all our customers.
Issue #2 🕔 IT'S TIME-CONSUMING 🕔
Even if someone is doing all the coding for you, it might require days/weeks depending on your overall trading strategy/idea.
Without even counting the time for you to test/validate the work done and all the back-and-forth to fix all the issues.
Solution #2 SAVING TIME MIGHT EQUATES TO SAVING MONEY : 🕔 = 💲💲💲
I wish it could be as easy as going from weeks of coding to "1 single click" :)
I did the heavy-lifting, but you'll have to make the last effort the cross the finishing line. I made it easy for you to play with it and find a configuration that makes sense to YOU and for your strategy/asset/timeframe
Issue #3 ❌ IT'S COMPLICATED ❌
Someone did a backtest code for you, but... you can't update it because you either :
- don't know anything in programming
- ... and don't have time to learn (most of us have a job/family/...life)
- The system you have is way too specific for one of your previous idea, but can't be updated easily for your next trading ideas. I see a lot of traders nodding right now thinking "that's soooooo true !!!!"
Solution #3 🎉 WE MADE IT EASY AND FUN 🎉
Our goal is to externalize the technical stuff that you don't want to take care of - so that you can finally focus on your trading and optimizing your ideas. #bold #statement
In case you're wondering, no we're not reading your mind :), but we're also traders who didn't know how to code before and had to hire external programmers to do the heavy work for us.
You can be sure that most of the frustrations (trading, technical, ...) you have/had, we had them also and that's why we created this backtest indicator.
III. 🔌&🕹️
Hope you're ready to be impressed. Because, what I'm about to introduce, is my best-seller feature - and available across many of my indicators.
In TradingView, there is a feature called "Indicator on Indicator" meaning you can use an external indicator as a data source for another indicator.
I'm using that feature to connect any external indicator to our Backtest PRO Suite+ (Plug & Play) - hence the plug and play name. Please don't make it a plug and pray :) it's supposed to help you out, not to stress you even more
Let's assume you want to connect your Algorithm Builder Single Trend+ to your Backtest PRO Suite+
I mentioned an Algorithm Builder but you may connect any oscillator (MACD, On balance volume, stochastic RSI, True Strenght index, and many more..) or non-oscillator (divergence, trendline break, higher highs/lower lows, candlesticks pattern, price action, harmonic patterns, ...) indicators.
THE SKY IS (or more likely your imagination) is the limit :)
Fear no more. The Plug&Play technology allows you to connect it and use it the backtest calculations.
This is not magic, neither is sorcery, but certainly is way beyond the most awesome thing I've ever developed on TradingView (even across all brokers I know). #bolder #statement
TradingView is the best trading platform by far and I'm very grateful to offer my indicators on their website.
To connect your external indicator to ours, we're using a native TradingView feature, which is not available for all users.
It depends on your TradingView subscription plan ( More info here )
If you intend to use our Algorithm Plug&Play indicator, and/or our Backtest Plug&Play suites, then you must upgrade your TradingView account to enjoy those features.
We value our relationship with our customers seriously, and that's why we're warning you that a compatible TradingView account type is required - at least PRO+ or PREMIUM to add more than 1 Plug&Play indicator per account.
We go in-depth on our website why the Plug&Play is an untapped opportunity for many traders out there - URL available on my profile status and signature
IV. 📊 Make it nice! 📊
Now we're getting right into the fun stuff.
Let's explore briefly each display option (symbolized by a 👁️🗨️ in the Backtest UI) :
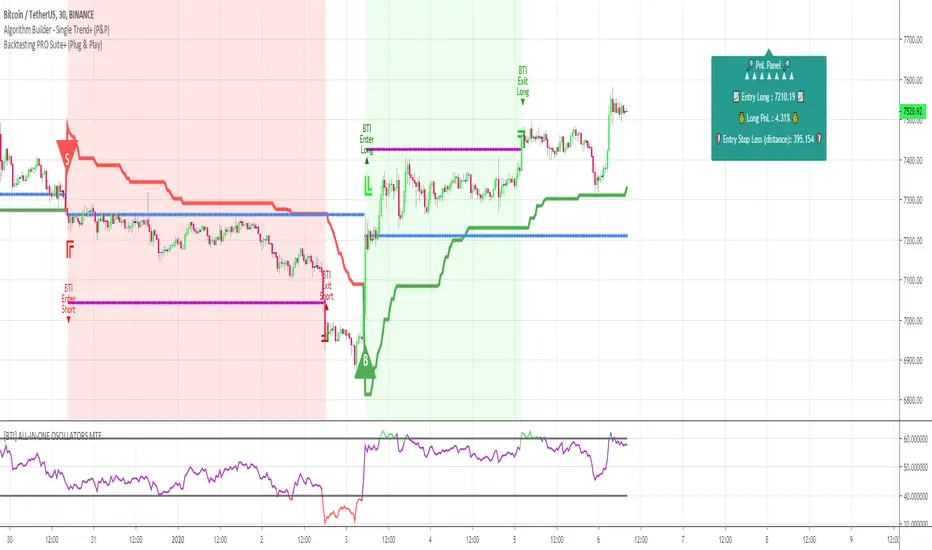
- Color Traded Background : Color the chart background is green when in a BUY trade, in red when in a SELL trade. If the Backtest is not in a trade, then the background won't be colored.
- Show Entry/Exit Markers : Displays the entries (Enter Long/Enter Short), and exits (Exit Long/Exit Short) labels.
- Show Entry Level :Displays a blue level line to easily identify the entry price of a trade.
- Show Take Profit Level : Display a purple line to visualize where the Take Profit level is (we'll explain below how to set it up).
- Show In-Trade Stops : Display the stop-loss
V. Backtesting filters
A backtest should have some filters helping the traders testing a few hypotheses. Well.... we included a ton of them - even for the PRO version
Once again, thank you @Pinecoders for the help and support you gave me
5.1 ▄ █ Position sizing █ ▄
- 1. % of Equity: If selected, the position size used is the input to the right of 1. % of Equity.
Example: The trader starts with a capital of 100K. After a winning trade, your total capital is $103K - for the next trade the position size will be 3% of $103K
- 2. % of Capital: If selected, the position size used is the input to the right of 2. % of Capital.
In other words, the position size will always be the same position size as calculated on the initial capital.
Example: The trader starts with a capital of 100K. After a winning trade, your total capital is $103K - for the next trade the position size will be 5% of $100K. (As 100K is the initial capital used in our dummy example)
5.2⛔ Entry Stops and In-Trade Stops ⛔
We didn't reinvent the wheel here. Any good backtest should offer an entry stop-loss and an in-trade stop-loss.
Giving only here also an example among all the use cases. For instance, the trader sets a stop-loss 2% at the time of entry on your trade, but once the trade moves in the desired direction, the trader might want a trailing stop-loss using a 4% input.
Example: A trader goes LONG on only 1 "ABC" stock evaluated $10 per share.
1) The entry-stop loss will be 2% away so set at $8
2) A candle
3) The trailing stop will activate, and move the stop-loss from the entry stop-loss level (=$8) to $8.32 (=4% move up from $8) - and so on, and so forth for each time the price moves 4% up
The entry and in-trade stop losses can absolutely be identicals. There is no universal rule, and as always you know the drill - all depends on your backtest, and indicator configurations as a whole.
Last, but not the least, selecting an Entry stop-loss is mandatory, but the in-trade stop-loss is not. Up to you to decide if the in-trade SL is needed for your Backtest strategy.
5.3 ❌ Hard Exits ❌
We included the MACD hard exit indicator in the backtest - as we did also for the Algorithm Builders.
The hard exit (or invalidation) is a fundamental part of my trading method.
I explained numerous times on TradingView, our website, and social media channels why I "love" this concept so much, and how it saved my trading account numerous times from getting savagely wrecked by the market.
5.4 💲💲 Take Profit 💲💲
We only included 1 level of Take Profit so far. We'll work on adding at least one more soon.
You can set your Take Profit level based on either a:
1- Fixed value
2 - Percentage value
5.5 📆 Date Range Filtering 📆
If enabled, the backtest only uses the data between the starting and the ending dates of the defined range.
5.6 ❗❗ Fees and Slippage ❗❗
Too often completely ignored by many traders, the fees can eat gains out quickly/deepen one's capital faster than expected.
⚠️The fees vary between brokers, and asset traded - it could be recommended to check on your broker page what are the fees for the asset on your chart, and insert that percentage number.
Another cost ignored, even more, is the Slippage.
i.e. think about a Stop-Loss being hit, and we're so confused because we see on the chart that NEVER the price came even close to your SL level, but... it got hit anyway.
Yes! we know how frustrating it is, but that's the game we're playing, and trading should never be about blaming the game, but only blaming the players/traders/ourselves.
Blaming the game constantly is likely to not end with good performance results, but accounting for this "risk", and being able to quantify it is an incredible hedge. #bold #statement #level #10000
5.7 🔔 Alerts 🔔
By design, the alerts aren't available for strategy scripts. But this script is an... indicator so why should we not enjoy all the cards in our hands the fullest.
We enabled the alerts on those Backtest Entry/Exit signals. You're welcome :)
VI. 📝 Where are the backtest results? 📝
Answer: in the Data Window section of your TradingView
Now the cherry on the cake if we might say so. A backtest is cool, but visualizing results is actually the end goal here.
The Data Window is dynamic - it means whenever you'll mouseover at a give time on your chart, the data on that panel automatically updates.
Let's assume you're backtesting your idea between Sept 1st, 2019, and Oct 1st, 2019.
If your mouse cursor is located (or hovered) at a candle on Sept 14th, 2019 (data chosen randomly for this example), then the data displayed only includes the results between Sept 1st, and Sept 14th.
More info available on our website with a nice tutorial video. Data window metrics and filters explained on our website
Here's what the data window looks like: imgur.com
If you have any doubt or question, please hit me up directly or ask in the comments section of this script.
I'll never claim I have the best trading methodology or the best indicators.
You only will judge and I'll appreciate all the questions and feedback you're sending my way.
They help me a ton to develop indicators based on all the requests I received.
Kind regards,
Dave
Trade Management
Algorithm Builder - Multiple Trends+ (Plug & Play)Hello traders
I. SCRIPTS ACCESS AND TRIALS
1. For the trial request access, they have to be done through my website .
2. My website URL is in this script signature at the very bottom (you'll have to scroll down a bit and going past the long description) and in my profile status available here : Daveatt
Due to the new scripts publishing house rules, I won't mention the URL here directly. As I value my partnership with TradingView very much, I prefer showing you the way for finding them :)
3. You may also contact me directly for more information
II. Algorithm Builder - Multiple Trends
2.1 Forewords
The Multiple Trends+ is the update of the Multiple Trends and includes a built-in Trade Manager and PnL/Risk-Reward Panel
This indicator is available only to our PREMIUM users. Our PREMIUM indicators offer more trading analysis capabilities and opportunities.
A few words of caution: the Algorithm Builders - Multiple Trends are more advanced and as such, would require slightly more time to be mastered.
They're not that much difficult, but we understand that designing a trading system with 2 trends might be slightly more complicated - however, there is nothing to be scared of :).
The time spent to learn how to use our PREMIUM tools might be rewarded handsomely.
2.2 Concept
The Algorithm Builder - Multiple Trends is made to detect the convergence of many unrelated indicators and give a BUY or SELL signal whenever all the selected sub-indicators are converging in the same direction.
This is an upgrade of the PRO package giving access to the Algorithm Builder - Single Trend - designed to show 1 unique entry per trend - whereas the Multiple Trends offers re-entries in the same direction of the trend if the indicator detects good convergences to accumulate more positions.
III. Plug & Play
Hope you're ready to be impressed. Because, what I'm about to introduce, is my best-seller feature - and available across many of my indicators.
In TradingView, there is a feature called "Indicator on Indicator" meaning you can use an external indicator as a data source for another indicator.
I'm using that feature to connect any external indicator to our Algorithm Builder Multiple Trends+ Plug & Play (hence the plug and play name).
Let's assume we have an RSI divergence indicator - which is not part of the Algorithm Builder - but noticed that the convergence of an RSI divergence and a MACD gives strong signals.
I mentioned an RSI divergence, but you may connect any oscillator (MACD, On balance volume, stochastic RSI, True Strenght index, and many more..) or non-oscillator (divergence, trendline break, higher highs/lower lows, candlesticks pattern, price action, harmonic patterns, ...) indicators.
THE SKY IS (or more likely your imagination) is the limit :)
Fear no more. The Plug&Play technology allows you to connect it and use it in the convergence/confluence calculations.
Hence, whenever the MACD and RSI divergence will be in the same direction every time you'll get a convergence.
PS: Whereas it's only the first time only because this is a Single trend edition.
To connect your external indicator to ours, we're using a native TradingView feature, which is not available for all users.
It depends on your TradingView subscription plan ( More info here )
If you intend to use our Algorithm Plug&Play indicator, and/or our Backtest Plug&Play suites, then you must upgrade your TradingView account to enjoy those features.
We value our relationship with our customers seriously, and that's why we're warning upfront you that a compatible TradingView account type is required - at least PRO+ or PREMIUM to add more than 1 Plug&Play indicator per account.
We go in-depth on our website why the Plug&Play is an untapped opportunity for many traders out there - URL available on my profile status and signature
IV. Multiple Trends versus Single Trend
4.1 Multiple Trends benefits
A friend asked us recently Why using the Multiple Trends if we can use the Single Trend in a smaller timeframe, and get more entries that way?
We thought this was an excellent question, but the answer is obvious.
Using a Single Trend on a smaller timeframe to solely getting more entries will reduce the security of the given trades.
We designed the Algorithm Builders to take a trade in an identified trend but reducing the timeframe too much will mostly increase your risk - and might lead to capital loss.
By the way, this is a universal rule valid also for a big majority of indicators.
We're absolutely not saying that the Single Trend won't work on small timeframes because actually it really does. But, if you find out a great configuration for your Single Trend, and want to get more signals without increasing your risk - then the Multiple Trends would be a very viable option.
4.2 Main signal versus secondary signals
For the main and secondary trends, the color green symbolizes any identified "BUY" trend. And the color red symbolizes any identified "SELL" trend.
-The MAIN trend symbol is unique and symbolized by a triangle.
- The SECONDARY (could also be called re-entries) trends are multiple and symbolized by a diamond.
In the Algorithm Builder indicator settings, they're identified with the Additional keyword.
4.3 How the convergences are calculated
Extremely important: The diamonds (or re-entries) are displayed, as long as a triangle (or main/primary signal) is displayed.
For a trend change (buy to sell or sell to buy), the system waits for ALL selected re-entries sub-indicators , to give a convergence/confluence in the opposite direction.
For example, let's assume a BUY/green convergence based on 3 indicators. One or Two of them going turning red, won't be enough for a trend change.
But, if all of them turn red, then we'll see a red triangle - signaling the beginning of a new downtrend.
4.4 Why multiple entries?
Here are a few use cases :
1. The main use case why we made those Multiple Trends indicators: A trader got invalidated or stopped out on a trade, but wants a system to let hin/her jump back in with a minimum of security. (security depending on the configuration of the Algorithm Builder as a whole).
This is very frustrating to get in a trade, being stopped out, and finally, see the trade going in the expected direction.
Even more frustrating to jump back in at the end of a trend, and get stopped out again - we all agree on this.
2. You want to add more positions on your main trade as your Algo Builder identified a solid trend - this is a nice way to possibly maximize your gains.
Once again, we don't/won't guarantee any performance result (not because we don't believe in our tools, but for legal reason), all depends on the time spent reading our documentation and playing with the Algo Builder - as explained on our Tutorials.
More info available on our website. URL available in this script signature and on my profile status.
V. Why the Algorithm Builder Multiple Trends+ may help you
I worked with many traders during my career, and their feedback about trading is often pretty similar.
They all tried a lot of complicated indicators, losing their capital, and finally getting back to the basics (even to the basic indicators if I might say)
The art is finding a good combination of indicators and setting strict money/risk management rules.
Easy in concept, but more than 90+% of traders lose money on the markets... which teach us that trading is not only about drawing trendlines, or using cool indicators but finding ways to ease our psychology while trading.
5.1 The Algorithm Builder trading framework
The sub-indicators (full list on our website) weren't chosen randomly. They're based on a trading method we've developed over the last 6 years - while working with traders and other trading quants.
The Algo Builders are made to detect a convergence - and as such, will give a signal once a trend has been identified.
They're not made to detect reversal but have been designed to give a signal when all sub-indicators are either ALL bullish (green) or ALL bearish (red).
We provide a framework based on indicators we selected because they:
1. make sense to be used altogether
2. work on asset classes like INDEX, CRYPTO, STOCK OPTIONS, FOREX, COMMODITIES
3. it may expand your knowledge about what detecting a convergence with pre-selected indicator really means
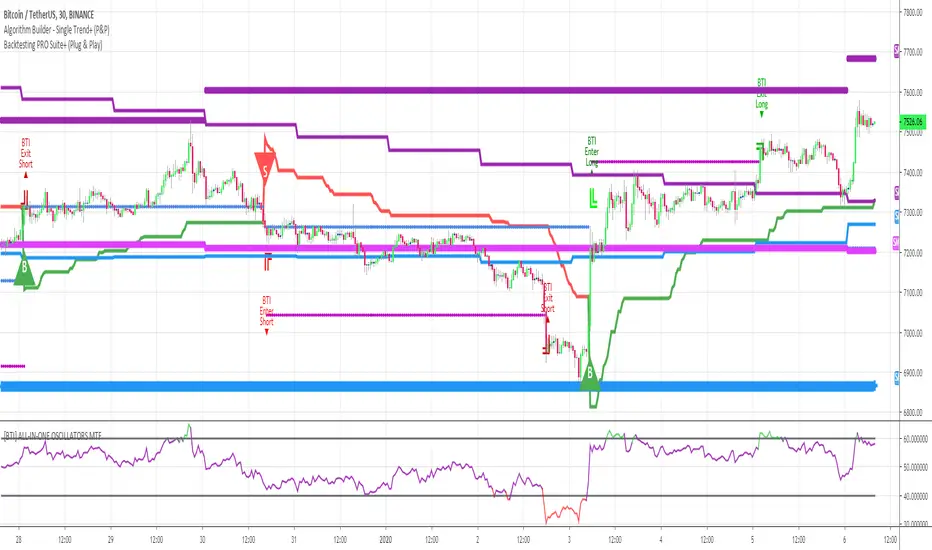
5.2 Supports and Resistances
The indicator displays the main algorithmic supports and resistances according to our trading method.
I think they're relevant for all asset classes, but you're absolutely free to use any different supports/resistances logic if you want to.
I'm not against it because I know that pivots, Fibonacci levels, etc. may work very well also.
5.3 Choose your favorite risk management algorithm
1/ Pre-defined Algo S/R method using:
- a supertrend of the stop-loss
- the nearest algorithmic resistances for the take profit levels.
2/ Define your own Stop-loss and Take-profits level in real-time
Stop-Loss Management
For what's following, let's assume that 2 is the stop-loss value you inserted in the indicator, and the Algorithm Builder gives a BUY signal.
This is NOT a recommendation at all, only an example to explain how this feature works.
- %Trailing: The Stop-Loss starts 2% away from the entry price - and will move up (because we're on a BUY trade as per our example) every time your trade will gain 2% profit
- Percentage: The Stop-Loss stays static 2% away from the entry price. There is no trailing here
- TP Trailing: This is a very awesome feature. The stop-loss is set 2% away when the trades start.
When the TP1 is hit, the stop-loss will be moved to the Entry price (also called breakeven).
When the TP2 is hit, the SL is moved to the previous TP1 position
- Fixed: Set the Stop-Loss at a fixed position (value should be in currency/units)
Take Profits Management
You can manage up to 2 take profit levels defined as a percentage or price value.
The expected input is in percentage value (for instance, setting the % target of TP1 to 2% will set the TP1 level 2% away from the entry price
5.4 Built-in Trade Manager
This is very likely the most loved utility script that we shared on TradingView.
It's included in your Algorithm Builder - Single Trend+, and will certainly help you immensely to analyze your charts and your trades.
We made sure that all the graphical elements on the chart will be updated in real-time whenever our user change anything on the indicator configuration.
You'll also be able to change the Trade Manager labels positions as you wish :)
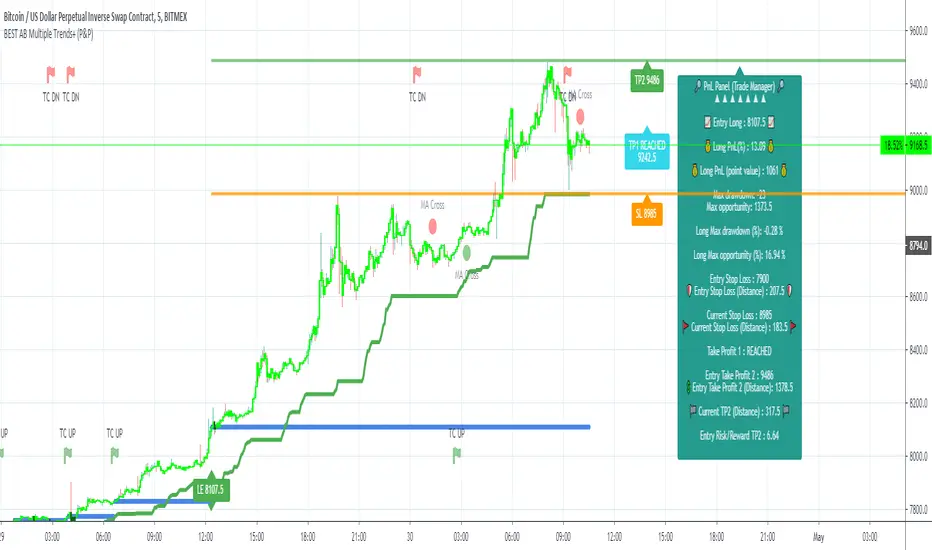
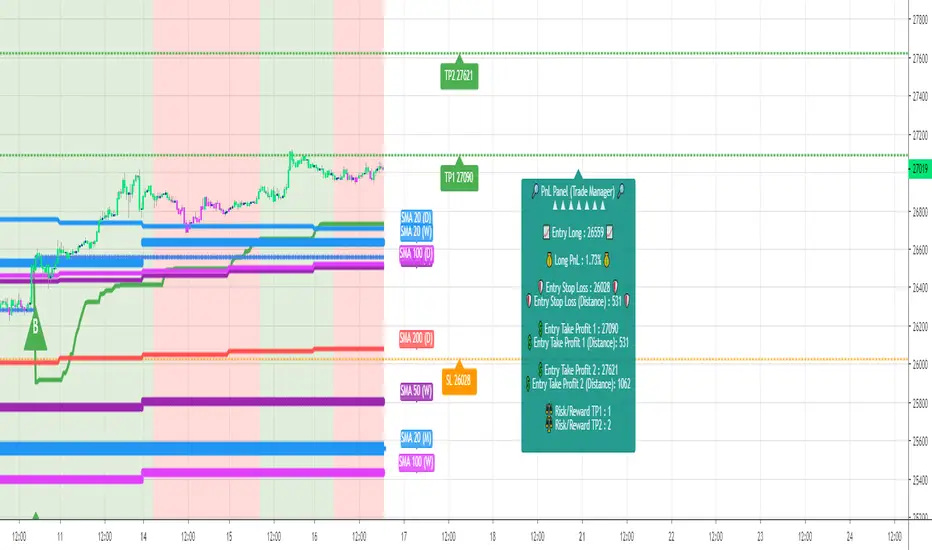
5.5 Built-in Risk-to-Reward Panel
The good stuff doesn't stop here.
You'll notice that this sometimes green (when in a LONG), sometimes red (when in a SHORT) panel at the right of your chart.
It displays for the selected trading algorithmic (see 2.3.2 above), a ton of useful real-time analytics.
- Entry Price: the price when the Algorithm Builder will give a signal.
- The Trade PnL in percentage.
- Entry Stop Loss: Distance (in currency/units) between the selected stop-loss algorithm (percent, trailing, TP trailing, etc.) and the entry price.
- Entry TP1: Distance (in currency/units) between the entry price and the first take profit
- Entry TP2: Distance (in currency/units) between the entry price and the second take profit
- Risk/Reward TP1: Using the Stop-loss distance at entry, and Take Profit 1 at entry to compute the risk-to-reward ratio.
- Risk/Reward TP2: Using the Stop-loss distance at entry, and Take Profit 2 at entry to compute the risk-to-reward ratio.
For more details, please check the guides section of my website. Links are in my signature and profile status.
5.6 Built-in PnL real-time calculations
YES!!!! you read it correctly
The panel displays the risk-to-reward ratios but also the PnL (Profit and Loss in percentage value) of the current and last trade
5.7 Hard Exits
Our trading method is known for the hard exits, also called invalidation.
The Single Trend+ includes a hard exit based on a MACD - settings are flexible and you may update them.
Having a stop-loss protecting your trade is a best practice - Protecting your stop-loss also from getting hit is incredible.
We prefer invalidate a few positions, even if sometimes we don't want to. Rather than the market hard exiting on us, and leaving with our hard-working money.
5.8 Alerts
Alerts are enabled for:
- BUY/SELL MAIN triangles signals
- BUY/SELL SECONDARY diamond signals
- Trade Manager alerts (Stop Loss, Take Profit 1, Take Profit 2)
- Hard Exits
VI. Pain points that we're trying to solve with our Algorithm Builders
Issue #1 There are many informations / indicators / strategies / backtests / noise. Finding the right ones is not a simple task.
Solution #1 A reliable system that removes the external noise is much needed in trading to stay "in the game".
Issue #2 Trading could be quite stressful - The majority doesn't lose in trading because technical analysis is hard, but because managing our psychology is one of the hardest things a human can do.
Solution #2 Some ways to reduce the "trading stress" could be: getting better quality signals and trading like a "machine". Forgetting about Twitter and trusting the system you designed.
Issue #3 Trading without strict rules and only based on what we feel, or what we think the market should do is the fastest way to kiss our money goodbye.
Only 1 indicator generally is not enough. Traders generally use a combination of several indicators but they're monitoring them individually.
It's normal then to feel exhausted at the end of the day ^^ (to say the least)... and exhaustion leads to mistakes which leads to..... (I'm sure you got it) ... capital loss.
Solution #3 As a trader, I needed a trading framework and a method. I offer our trading method but they're plenty others out there. We cannot claim obviously it's the best ever ....but let's say we're using those exact same
scripts ourselves for our trading. And this what we've been recommending our clients to trade with for the past years. Also, having a tool detecting the convergence of several indicators and giving 1 unique signal
for BUY/SELL position will save you a lot of time/energy, and perhaps might help you out getting better trading performance.
VII. Resolving a complex puzzle and having fun in the process
Trading has to stay a passion and not (only be) a source of intense stress.
The most successful traders I know are "trading geeks" - literally always looking for optimizing, searching for the best possible entries, setups, indicators, tools, etc.
For them, it's not even about the money anymore, but only about beating their previous performance.
Why are they doing this? Because it's fun
Might appears as a bold statement, but I guarantee that looking for setups is fun.
One of our users even told us, that it's like playing with "Legos" and we couldn't possibly agree more.
VIII. Designing a system that "makes sense"
Another bold statement now. Brace yourselves ladies and gentlemen
The Algorithm Builders allow to design trading systems quickly. What could takes days/weeks/months to find out... might be now within your reach in less than a few hours.
With a bit of practice, less than an hour might be enough per asset/timeframe to find a system that makes sense to you and adapted to your trading capital and psychology.
Assuming our users read our guides and are fully committed to learning a new way of trading - then we do guarantee you'll be able to design kick-ass trading systems that make sense.
"Making sense" doesn't mean at all it's guaranteed to win, it means you're the one defining the convergence of indicators, using your Algorithm Builder, and observe that most of the time - whenever there is a BUY signal, the candlesticks are going upwards - whenever there is a SELL signal, it's going downwards.
This is a necessary step to make real progress from a trading analyst perspective - and hopefully could lead to profits.
VIII. Algorithm Builder versus the main trader enemy(=psychology)
This indicator has the goal to help solving one of the MAIN issues encountered by traders.
Most of traders realize, they can't perform with only 1 indicator (or 1 price pattern or 1 price action) and need a combination of multiple indicators before getting in a trade.
Far from being a magic pill, if it could at least reduce the stress you have while trading, then we'll consider we made a great job - it's a technical "useless noise remover", and needs to be followed strictly.
Such trust in a trading system can only be built by testing your Algorithm Builder configuration on either:
1. a demo account
2. or a live account with small bids. And then, increasing progressively the bids if your capital increases progressively.
Though, you should still use your common sense. (for instance: if we get a BUY signal right on a big timeframe resistance we're hitting for the first time).
I'm aware this is a new way of trading but for many, and while we cannot foresee the future, neither predict performance, we believe it might save you a lot of time to find good signals.
My maximum level of happiness will be reached the day when our users will contact me and showing me setups being mine.
I'm sure that even I can learn from my users and, we can all learn from each other Algorithm Builder configuration
IX. What is a wrong or bad configuration?
Simply put. If you see that most of your signals react such as described below:
1. a buy triangle/diamond predicts, most of the time an upwards move
2. a sell triangle/diamond predicts, most of the time a downwards move
3. you estimated yourself the stop-loss needed to give enough room for your trades.
4. take profits based on algorithmic support and resistances or your own take profit method.
So what's a good Algorithm Builder configuration? A configuration you're happy with and makes sense.
A better Algorithm Builder setup is one used in demo or a live account w/ small bids for a few weeks, and you're consistent in your trading performance.
If you have any doubt or question, please hit me up directly or ask in the comments section of this script.
I'll never claim I have the best trading methodology or the best indicators. You only will be the judge, and I'll appreciate all the questions and feedback you're sending my way.
They help me a ton to develop indicators based on all the requests I received.
Kind regards,
Dave
Algorithm Builder - Single Trend+ (Plug&Play)Hello traders
I. SCRIPTS ACCESS AND TRIALS
1. For the trial request access, they have to be done through my website .
2. My website URL is in this script signature at the very bottom (you'll have to scroll down a bit and going past the long description) and in my profile status available here : Daveatt
Due to the new scripts publishing house rules, I won't mention the URL here directly. As I value my partnership with TradingView very much, I prefer showing you the way for finding them :)
3. You may also contact me directly for more information
II. Algorithm Builder - Single Trend+ Plug&Play
2.1 Concept
That script is an upgrade of the Single Trend:
The Algorithm Builder - Single Trend+ (Plug & Play) is made to detect the convergence of many unrelated indicators, and give a BUY or SELL signal whenever all the selected sub-indicators are converging in the same direction.
The Single Trend+ (Plug & Play) gives one single entry per identified trend - unlike the Multiple Trends editions (also available on my scripts page) which may give more than 1 entry per trend.
The traders select the sub-indicators they want, and see in real-time the BUY and SELL triangles being updated.
III. Plug & Play
Hope you're ready to be impressed. Because, what I'm about to introduce, is my best-seller feature - and available across many of my indicators.
In TradingView, there is a feature called "Indicator on Indicator" meaning you can use an external indicator as a data source for another indicator.
I'm using that feature to connect any external indicator to our Algorithm Builder Single Trend+ Plug & Play (hence the plug and play name).
Let's assume you have your RSI divergence indicator - which is not part of the Algorithm Builder - but noticed that the convergence of an RSI divergence and a MACD gives strong signals.
I mentioned an RSI divergence, but you may connect any oscillator (MACD, On balance volume, stochastic RSI, True Strenght index, and many more..) or non-oscillator (divergence, trendline break, higher highs/lower lows, candlesticks pattern, price action, harmonic patterns, ...) indicators.
Any indicator that displays visual signals are eligible for this feature .... in other words.... all possible indicators. You're welcome :)
THE SKY IS (or more likely your imagination) is the limit :)
Fear no more. The Plug&Play technology allows you to connect it and use it in the convergence/confluence calculations.
Hence, whenever the MACD and RSI divergence will be in the same direction for the first time, you'll get a signal. For the first time only because this is a Single trend edition - you may enter multiple times using our Algorithm Builders - Multiple Trends editions.
To connect your external indicator to ours, we're using a native TradingView feature, which is not available for all users.
It depends on your TradingView subscription plan ( More info here )
If you intend to use our Algorithm Plug&Play indicator, and/or our Backtest Plug&Play suites, then you must upgrade your TradingView account to enjoy those features.
We value our relationship with our customers seriously, and that's why we're warning you that a compatible TradingView account type is required - at least PRO+ or PREMIUM to add more than 1 Plug&Play indicator per account.
We go in-depth on our website why the Plug&Play is an untapped opportunity for many traders out there - URL available on my profile status and signature
IV. Why the Algorithm Builder Single Trend+ (Plug&Play) may help you
I worked with many traders during my career, and their feedback about trading is often pretty similar.
They all tried a lot of complicated indicators, losing their capital, and finally getting back to the basics (even to the basic indicators if I might say)
The art is finding a good combination of indicators and setting strict money/risk management rules.
Easy in concept, but more than 90+% of traders lose money on the markets... which teach us that trading is not only about drawing trendlines, or using cool indicators but finding ways to ease our psychology while trading.
4.1 The Algorithm Builder trading framework
The sub-indicators (full list on our website) weren't chosen randomly. They're based on a trading method we've developed over the last 6 years - while working with traders and other trading quants.
The Algo Builders are made to detect a convergence - and as such, will give a signal once a trend has been identified.
They're not made to detect reversal but have been designed to give a signal when all sub-indicators are either ALL bullish (green) or ALL bearish (red).
We provide a framework based on indicators we selected because they:
1. make sense to be used altogether
2. work on asset classes like INDEX, CRYPTO, STOCK OPTIONS, FOREX, COMMODITIES
3. it may expand your knowledge about what detecting a convergence with pre-selected indicator really means
4.2 Supports and Resistances
The indicator displays the main algorithmic supports and resistances according to our trading method.
I think they're relevant for all asset classes, but you're absolutely free to use any different supports/resistances logic if you want to.
I'm not against it because I know that pivots, Fibonacci levels, etc. may work very well also.
4.3 Choose your favorite risk management algorithm
1/ Pre-defined Algo S/R method using:
- a supertrend of the stop-loss
- the nearest algorithmic resistances for the take profit levels.
2/ Define your own Stop-loss and Take-profits level in real-time
Stop-Loss Management
For what's following, let's assume that 2 is the stop-loss value you inserted in the indicator, and the Algorithm Builder gives a BUY signal.
This is NOT a recommendation at all, only an example to explain how this feature works.
- %Trailing: The Stop-Loss starts 2% away from the entry price - and will move up (because we're on a BUY trade as per our example) every time your trade will gain 2% profit
- Percentage: The Stop-Loss stays static 2% away from the entry price. There is no trailing here
- TP Trailing: This is a very awesome feature. The stop-loss is set 2% away when the trades start.
When the TP1 is hit, the stop-loss will be moved to the Entry price (also called breakeven).
When the TP2 is hit, the SL is moved to the previous TP1 position
- Fixed: Set the Stop-Loss at a fixed position (value should be in currency/units)
Take Profits Management
You can manage up to 2 take profit levels defined as a percentage or price value.
The expected input is in percentage value (for instance, setting the % target of TP1 to 2% will set the TP1 level 2% away from the entry price
4.4 Built-in Trade Manager
This is very likely the most loved utility script that we shared on TradingView.
It's included in your Algorithm Builder - Single Trend+, and will certainly help you immensely to analyze your charts and your trades.
We made sure that all the graphical elements on the chart will be updated in real-time whenever our user change anything on the indicator configuration.
You'll also be able to change the Trade Manager labels positions as you wish :)
4.5 Built-in Risk-to-Reward Panel
The good stuff doesn't stop here.
You'll notice that this sometimes green (when in a LONG), sometimes red (when in a SHORT) panel at the right of your chart.
It displays for the selected trading algorithmic (see 2.3.2 above), a ton of useful real-time analytics.
- Entry Price: the price when the Algorithm Builder will give a signal.
- The Trade PnL in percentage.
- Entry Stop Loss: Distance (in currency/units) between the selected stop-loss algorithm (percent, trailing, TP trailing, etc.) and the entry price.
- Entry TP1: Distance (in currency/units) between the entry price and the first take profit
- Entry TP2: Distance (in currency/units) between the entry price and the second take profit
- Risk/Reward TP1: Using the Stop-loss distance at entry, and Take Profit 1 at entry to compute the risk-to-reward ratio.
- Risk/Reward TP2: Using the Stop-loss distance at entry, and Take Profit 2 at entry to compute the risk-to-reward ratio.
For more details, please check the guides section of my website. Links are in my signature and profile status.
4.6Hard Exits
Our trading method is known for the hard exits, also called invalidation.
The Single Trend+ includes a hard exit based on a MACD - settings are flexible and you may update them.
Having a stop-loss protecting your trade is a best practice - Protecting your stop-loss also from getting hit is incredible.
We prefer invalidate a few positions, even if sometimes we don't want to. Rather than the market hard exiting on us, and leaving with our hard-working money.
4.7 Alerts
Alerts are enabled for:
- BUY/SELL triangles signals
- Trade Manager (SL, TP1, TP2)
- Hard Exits
V. Pain points that we're trying to solve with our Algorithm Builders
Issue #1 There are many informations / indicators / strategies / backtests / noise. Finding the right ones is not a simple task.
Solution #1 A reliable system that removes the external noise is much needed in trading to stay "in the game".
Issue #2 Trading could be quite stressful - The majority doesn't lose in trading because technical analysis is hard, but because managing our psychology is one of the hardest things a human can do.
Solution #2 Some ways to reduce the "trading stress" could be: getting better quality signals and trading like a "machine". Forgetting about Twitter and trusting the system you designed.
Issue #3 Trading without strict rules and only based on what we feel, or what we think the market should do is the fastest way to kiss our money goodbye.
Only 1 indicator generally is not enough. Traders generally use a combination of several indicators but they're monitoring them individually.
It's normal then to feel exhausted at the end of the day ^^ (to say the least)... and exhaustion leads to mistakes which leads to..... (I'm sure you got it) ... capital loss.
Solution #3 As a trader, I needed a trading framework and a method. I offer our trading method but they're plenty others out there. We cannot claim obviously it's the best ever ....but let's say we're using those exact same
scripts ourselves for our trading. And this what we've been recommending our clients to trade with for the past years. Also, having a tool detecting the convergence of several indicators and giving 1 unique signal
for BUY/SELL position will save you a lot of time/energy, and perhaps might help you out getting better trading performance.
VI. Resolving a complex puzzle and having fun in the process
Trading has to stay a passion and not (only be) a source of intense stress.
The most successful traders I know are "trading geeks" - literally always looking for optimizing, searching for the best possible entries, setups, indicators, tools, etc.
For them, it's not even about the money anymore, but only about beating their previous performance.
Why are they doing this? Because it's fun
Might appears as a bold statement, but I guarantee that looking for setups is fun.
One of our users even told us, that it's like playing with "Legos" and we couldn't possibly agree more.
VII. Designing a system that "makes sense"
Another bold statement now. Brace yourselves ladies and gentlemen
The Algorithm Builders allow to design trading systems quickly. What could takes days/weeks/months to find out... might be now within your reach in less than a few hours.
With a bit of practice, less than an hour might be enough per asset/timeframe to find a system that makes sense to you and adapted to your trading capital and psychology.
Assuming our users read our guides and are fully committed to learning a new way of trading - then we do guarantee you'll be able to design kick-ass trading systems that make sense.
"Making sense" doesn't mean at all it's guaranteed to win, it means you're the one defining the convergence of indicators, using your Algorithm Builder, and observe that most of the time - whenever there is a BUY signal, the candlesticks are going upwards - whenever there is a SELL signal, it's going downwards.
This is a necessary step to make real progress from a trading analyst perspective - and hopefully could lead to profits.
VII. Algorithm Builder versus the main trader enemy(=psychology)
This indicator has the goal to help solving one of the MAIN issues encountered by traders.
Most of traders realize, they can't perform with only 1 indicator (or 1 price pattern or 1 price action) and need a combination of multiple indicators before getting in a trade.
Far from being a magic pill, if it could at least reduce the stress you have while trading, then we'll consider we made a great job - it's a technical "useless noise remover", and needs to be followed strictly.
Such trust in a trading system can only be built by testing your Algorithm Builder configuration on either:
1. a demo account
2. or a live account with small bids. And then, increasing progressively the bids if your capital increases progressively.
Though, you should still use your common sense. (for instance: if we get a BUY signal right on a big timeframe resistance we're hitting for the first time).
I'm aware this is a new way of trading but for many, and while we cannot foresee the future, neither predict performance, we believe it might save you a lot of time to find good signals.
My maximum level of happiness will be reached the day when our users will contact me and showing me setups being mine.
I'm sure that even I can learn from my users and, we can all learn from each other Algorithm Builder configuration
VIII. What is a wrong or bad configuration?
Simply put. If you see that most of your signals react such as described below:
1. a buy triangle predicts, most of the time an upwards move
2. a sell triangle predicts, most of the time a downwards move
3. you estimated yourself the stop-loss needed to give enough room for your trades.
4. take profits based on algorithmic support and resistances or your own take profit method.
So what's a good Algorithm Builder configuration? A configuration you're happy with and makes sense.
A better Algorithm Builder setup is one used in demo or a live account w/ small bids for a few weeks, and you're consistent in your trading performance.
If you have any doubt or question, please hit me up directly or ask in the comments section of this script.
I'll never claim I have the best trading methodology or the best indicators. You only will be the judge, and I'll appreciate all the questions and feedback you're sending my way.
They help me a ton to develop indicators based on all the requests I received.
Kind regards,
Dave
Algorithm Builder - Single Trend+ (MTF)Hello traders
I. SCRIPTS ACCESS AND TRIALS
1. For the trial request access, they have to be done through my website .
2. My website URL is in this script signature at the very bottom (you'll have to scroll down a bit and going past the long description) and in my profile status available here : Daveatt
Due to the new scripts publishing house rules, I won't mention the URL here directly. As I value my partnership with TradingView very much, I prefer showing you the way for finding them :)
3. You may also contact me directly for more information
II. Algorithm Builder - Single Trend+ (MTF)
2.1 Concept
MTF means Multi Timeframes - we all agree that saying MTF is nicer and easier than multi-timeframe.
That script is an upgrade of the Single Trend:
The Algorithm Builder - Single Trend+ (Multiple Timeframes/MTF) is made to detect the convergence of many unrelated indicators, and give a BUY or SELL signal whenever all the selected sub-indicators - each may be using a different timeframe - are converging in the same direction.
Now sit tight because what's going to be announced will be awesome. Are you ready for it?... :)
The MTF version allows to detect the convergence for indicators in different timeframes. Each indicator has its own timeframe - expanding, even more, your trading analysis capabilities.
In other words, you could, for instance, detects the convergence of an H1 MACD with an H2 Supertrend, and why not also adding an m30 Moving Averages cross in the mix.
The Single Trend+ MTF gives one single entry per identified trend - unlike the Multiple Trends editions (also available on my scripts page) which may give more than 1 entry per trend.
The traders select the sub-indicators they want, and see in real-time the BUY and SELL triangles being updated.
2.2 Why the Algorithm Builder Single Trend may help you
I worked with many traders during my career, and their feedback about trading is often pretty similar.
They all tried a lot of complicated indicators, losing their capital, and finally getting back to the basics (even to the basic indicators if I might say)
The art is finding a good combination of indicators and setting strict money/risk management rules.
Easy in concept, but more than 90+% of traders lose money on the markets... which teach us that trading is not only about drawing trendlines, or using cool indicators but finding ways to ease our psychology while trading.
2.3 The Algorithm Builder trading framework
The sub-indicators (full list on our website) weren't chosen randomly. They're based on a trading method we've developed over the last 6 years - while working with traders and other trading quants.
The Algo Builders are made to detect a convergence - and as such, will give a signal once a trend has been identified.
They're not made to detect reversal but have been designed to give a signal when all sub-indicators are either ALL bullish (green) or ALL bearish (red).
We provide a framework based on indicators we selected because they:
1. make sense to be used altogether
2. work on asset classes like INDEX, CRYPTO, STOCK OPTIONS, FOREX, COMMODITIES
3. it may expand your knowledge about what detecting a convergence with pre-selected indicator really means
2.3.1 Supports and Resistances
The indicator displays the main algorithmic supports and resistances according to our trading method.
I think they're relevant for all asset classes, but you're absolutely free to use any different supports/resistances logic if you want to.
I'm not against it because I know that pivots, Fibonacci levels, etc. may work very well also.
2.3.2 Choose your favorite risk management algorithm
1/ Pre-defined Algo S/R method using:
- a supertrend of the stop-loss
- the nearest algorithmic resistances for the take profit levels.
2/ Define your own Stop-loss and Take-profits level in real-time
Stop-Loss Management
For what's following, let's assume that 2 is the stop-loss value you inserted in the indicator, and the Algorithm Builder gives a BUY signal.
This is NOT a recommendation at all, only an example to explain how this feature works.
- %Trailing: The Stop-Loss starts 2% away from the entry price - and will move up (because we're on a BUY trade as per our example) every time your trade will gain 2% profit
- Percentage: The Stop-Loss stays static 2% away from the entry price. There is no trailing here
- TP Trailing: This is a very awesome feature. The stop-loss is set 2% away when the trades start.
When the TP1 is hit, the stop-loss will be moved to the Entry price (also called breakeven).
When the TP2 is hit, the SL is moved to the previous TP1 position
- Fixed: Set the Stop-Loss at a fixed position (value should be in currency/units)
Take Profits Management
You can manage up to 2 take profit levels defined as a percentage or price value.
The expected input is in percentage value (for instance, setting the % target of TP1 to 2% will set the TP1 level 2% away from the entry price
2.3.3 Built-in Trade Manager
This is very likely the most loved utility script that we shared on TradingView.
It's included in your Algorithm Builder - Single Trend+, and will certainly help you immensely to analyze your charts and your trades.
We made sure that all the graphical elements on the chart will be updated in real-time whenever our user change anything on the indicator configuration.
You'll also be able to change the Trade Manager labels positions as you wish :)
2.3.4 Built-in Risk-to-Reward Panel
The good stuff doesn't stop here.
You'll notice that this sometimes green (when in a LONG), sometimes red (when in a SHORT) panel at the right of your chart.
It displays for the selected trading algorithmic (see 2.3.2 above), a ton of useful real-time analytics.
- Entry Price: the price when the Algorithm Builder will give a signal.
- The Trade PnL in percentage.
- Entry Stop Loss: Distance (in currency/units) between the selected stop-loss algorithm (percent, trailing, TP trailing, etc.) and the entry price.
- Entry TP1: Distance (in currency/units) between the entry price and the first take profit
- Entry TP2: Distance (in currency/units) between the entry price and the second take profit
- Risk/Reward TP1: Using the Stop-loss distance at entry, and Take Profit 1 at entry to compute the risk-to-reward ratio.
- Risk/Reward TP2: Using the Stop-loss distance at entry, and Take Profit 2 at entry to compute the risk-to-reward ratio.
For more details, please check the guides section of my website. Links are in my signature and profile status.
2.3.5 Hard Exits
Our trading method is known for the hard exits, also called invalidation.
The Single Trend+ includes a hard exit based on a MACD - settings are flexible and you may update them.
Having a stop-loss protecting your trade is a best practice - Protecting your stop-loss also from getting hit is incredible.
We prefer invalidate a few positions, even if sometimes we don't want to. Rather than the market hard exiting on us, and leaving with our hard-working money.
2.3.6 Alerts
Alerts are enabled for:
- BUY/SELL triangles signals
- Trade Manager (SL, TP1, TP2)
- Hard Exits
III. Pain points that we're trying to solve with our Algorithm Builders
Issue #1 There are many informations / indicators / strategies / backtests / noise. Finding the right ones is not a simple task.
Solution #1 A reliable system that removes the external noise is much needed in trading to stay "in the game".
Issue #2 Trading could be quite stressful - The majority doesn't lose in trading because technical analysis is hard, but because managing our psychology is one of the hardest things a human can do.
Solution #2 Some ways to reduce the "trading stress" could be: getting better quality signals and trading like a "machine". Forgetting about Twitter and trusting the system you designed.
Issue #3 Trading without strict rules and only based on what we feel, or what we think the market should do is the fastest way to kiss our money goodbye.
Only 1 indicator generally is not enough. Traders generally use a combination of several indicators but they're monitoring them individually.
It's normal then to feel exhausted at the end of the day ^^ (to say the least)... and exhaustion leads to mistakes which leads to..... (I'm sure you got it) ... capital loss.
Solution #3 As a trader, I needed a trading framework and a method. I offer our trading method but they're plenty others out there. We cannot claim obviously it's the best ever ....but let's say we're using those exact same
scripts ourselves for our trading. And this what we've been recommending our clients to trade with for the past years. Also, having a tool detecting the convergence of several indicators and giving 1 unique signal
for BUY/SELL position will save you a lot of time/energy, and perhaps might help you out getting better trading performance.
III. Resolving a complex puzzle and having fun in the process
Trading has to stay a passion and not (only be) a source of intense stress.
The most successful traders I know are "trading geeks" - literally always looking for optimizing, searching for the best possible entries, setups, indicators, tools, etc.
For them, it's not even about the money anymore, but only about beating their previous performance.
Why are they doing this? Because it's fun
Might appears as a bold statement, but I guarantee that looking for setups is fun.
One of our users even told us, that it's like playing with "Legos" and we couldn't possibly agree more.
IV. Designing a system that "makes sense"
Another bold statement now. Brace yourselves ladies and gentlemen
The Algorithm Builders allow to design trading systems quickly. What could takes days/weeks/months to find out... might be now within your reach in less than a few hours.
With a bit of practice, less than an hour might be enough per asset/timeframe to find a system that makes sense to you and adapted to your trading capital and psychology.
Assuming our users read our guides and are fully committed to learning a new way of trading - then we do guarantee you'll be able to design kick-ass trading systems that make sense.
"Making sense" doesn't mean at all it's guaranteed to win, it means you're the one defining the convergence of indicators, using your Algorithm Builder, and observe that most of the time - whenever there is a BUY signal, the candlesticks are going upwards - whenever there is a SELL signal, it's going downwards.
This is a necessary step to make real progress from a trading analyst perspective - and hopefully could lead to profits.
V. Algorithm Builder versus the main trader enemy(=psychology)
This indicator has the goal to help solving one of the MAIN issues encountered by traders.
Most of traders realize, they can't perform with only 1 indicator (or 1 price pattern or 1 price action) and need a combination of multiple indicators before getting in a trade.
Far from being a magic pill, if it could at least reduce the stress you have while trading, then we'll consider we made a great job - it's a technical "useless noise remover", and needs to be followed strictly.
Such trust in a trading system can only be built by testing your Algorithm Builder configuration on either:
1. a demo account
2. or a live account with small bids. And then, increasing progressively the bids if your capital increases progressively.
Though, you should still use your common sense. (for instance: if we get a BUY signal right on a big timeframe resistance we're hitting for the first time).
I'm aware this is a new way of trading but for many, and while we cannot foresee the future, neither predict performance, we believe it might save you a lot of time to find good signals.
My maximum level of happiness will be reached the day when our users will contact me and showing me setups being mine.
I'm sure that even I can learn from my users and, we can all learn from each other Algorithm Builder configuration
VI. What is a wrong or bad configuration?
Simply put. If you see that most of your signals react such as described below:
1. a buy triangle predicts, most of the time an upwards move
2. a sell triangle predicts, most of the time a downwards move
3. you estimated yourself the stop-loss needed to give enough room for your trades.
4. take profits based on algorithmic support and resistances or your own take profit method.
So what's a good Algorithm Builder configuration? A configuration you're happy with and makes sense.
A better Algorithm Builder setup is one used in demo or a live account w/ small bids for a few weeks, and you're consistent in your trading performance.
If you have any doubt or question, please hit me up directly or ask in the comments section of this script.
I'll never claim I have the best trading methodology or the best indicators. You only will be the judge, and I'll appreciate all the questions and feedback you're sending my way.
They help me a ton to develop indicators based on all the requests I received.
Kind regards,
Dave

Algorithm Builder - Single Trend+Hello traders
I. SCRIPTS ACCESS AND TRIALS
1. For the trial request access, they have to be done through my website .
2. My website URL is in this script signature at the very bottom (you'll have to scroll down a bit and going past the long description) and in my profile status available here : Daveatt
Due to the new scripts publishing house rules, I won't mention the URL here directly. As I value my partnership with TradingView very much, I prefer showing you the way for finding them :)
3. You may also contact me directly for more information
II. Algorithm Builder - Single Trend+
2.1 Concept
That script is an upgrade of the Single Trend:
The Algorithm Builder - Single Trend+ was made to detect the convergence (also called confluence) of many unrelated indicators, giving a BUY or SELL signal whenever all the selected sub-indicators are converging in the same direction.
The Single Trend gives one single entry per identified trend - unlike the Multiple Trends editions (also available on my scripts page) which may give more than 1 entry per trend.
The traders select the sub-indicators they want, and see in real-time the BUY and SELL triangles being updated.
2.2 Why the Algorithm Builder Single Trend may help you
I worked with many traders during my career, and their feedback about trading is often pretty similar.
They all tried a lot of complicated indicators, losing their capital, and finally getting back to the basics (even to the basic indicators if I might say)
The art is finding a good combination of indicators and setting strict money/risk management rules.
Easy in concept, but more than 90+% of traders lose money on the markets... which teach us that trading is not only about drawing trendlines, or using cool indicators but finding ways to ease our psychology while trading.
2.3 The Algorithm Builder trading framework
The sub-indicators (full list on our website) weren't chosen randomly. They're based on a trading method we've developed over the last 6 years - while working with traders and other trading quants.
The Algo Builders are made to detect a convergence - and as such, will give a signal once a trend has been identified.
They're not made to detect reversal but have been designed to give a signal when all sub-indicators are either ALL bullish (green) or ALL bearish (red).
We provide a framework based on indicators we selected because they:
1. make sense to be used altogether
2. work on asset classes like INDEX, CRYPTO, STOCK OPTIONS, FOREX, COMMODITIES
3. it may expand your knowledge about what detecting a convergence with pre-selected indicator really means
2.3.1 Supports and Resistances
The indicator displays the main algorithmic supports and resistances according to our trading method.
I think they're relevant for all asset classes, but you're absolutely free to use any different supports/resistances logic if you want to.
I'm not against it because I know that pivots, Fibonacci levels, etc. may work very well also.
2.3.2 Choose your favorite risk management algorithm
1/ Pre-defined Algo S/R method using:
- a supertrend of the stop-loss
- the nearest algorithmic resistances for the take profit levels.
2/ Define your own Stop-loss and Take-profits level in real-time
Stop-Loss Management
For what's following, let's assume that 2 is the stop-loss value you inserted in the indicator, and the Algorithm Builder gives a BUY signal.
This is NOT a recommendation at all, only an example to explain how this feature works.
- %Trailing: The Stop-Loss starts 2% away from the entry price - and will move up (because we're on a BUY trade as per our example) every time your trade will gain 2% profit
- Percentage: The Stop-Loss stays static 2% away from the entry price. There is no trailing here
- TP Trailing: This is a very awesome feature. The stop-loss is set 2% away when the trades start.
When the TP1 is hit, the stop-loss will be moved to the Entry price (also called breakeven).
When the TP2 is hit, the SL is moved to the previous TP1 position
- Fixed: Set the Stop-Loss at a fixed position (value should be in currency/units)
Take Profits Management
You can manage up to 2 take profit levels defined as a percentage or price value.
The expected input is in percentage value (for instance, setting the % target of TP1 to 2% will set the TP1 level 2% away from the entry price
2.3.3 Built-in Trade Manager
This is very likely the most loved utility script that we shared on TradingView.
It's included in your Algorithm Builder - Single Trend+, and will certainly help you immensely to analyze your charts and your trades.
We made sure that all the graphical elements on the chart will be updated in real-time whenever our user change anything on the indicator configuration.
You'll also be able to change the Trade Manager labels positions as you wish :)
2.3.5 Built-in Risk-to-Reward Panel
The good stuff doesn't stop here.
You'll notice that this sometimes green (when in a LONG), sometimes red (when in a SHORT) panel at the right of your chart.
It displays for the selected trading algorithmic (see 2.3.2 above), a ton of useful real-time analytics.
- Entry Price: the price when the Algorithm Builder will give a signal.
- The Trade PnL in percentage.
- Entry Stop Loss: Distance (in currency/units) between the selected stop-loss algorithm (percent, trailing, TP trailing, etc.) and the entry price.
- Entry TP1: Distance (in currency/units) between the entry price and the first take profit
- Entry TP2: Distance (in currency/units) between the entry price and the second take profit
- Risk/Reward TP1: Using the Stop-loss distance at entry, and Take Profit 1 at entry to compute the risk-to-reward ratio.
- Risk/Reward TP2: Using the Stop-loss distance at entry, and Take Profit 2 at entry to compute the risk-to-reward ratio.
For more details, please check the guides section of my website. Links are in my signature and profile status.
2.3.6 Hard Exits
Our trading method is known for the hard exits, also called invalidation.
The Single Trend+ includes a hard exit based on a MACD - settings are flexible and you may update them.
Having a stop-loss protecting your trade is a best practice - Protecting your stop-loss also from getting hit is incredible.
We prefer invalidate a few positions, even if sometimes we don't want to. Rather than the market hard exiting on us, and leaving with our hard-working money.
2.3.7 Alerts
Alerts are enabled for:
- BUY/SELL triangles signals
- Trade Manager (SL, TP1, TP2)
- Hard Exits
III. Pain points that we're trying to solve with our Algorithm Builders
Issue #1 There are many informations / indicators / strategies / backtests / noise. Finding the right ones is not a simple task.
Solution #1 A reliable system that removes the external noise is much needed in trading to stay "in the game".
Issue #2 Trading could be quite stressful - The majority doesn't lose in trading because technical analysis is hard, but because managing our psychology is one of the hardest things a human can do.
Solution #2 Some ways to reduce the "trading stress" could be: getting better quality signals and trading like a "machine". Forgetting about Twitter and trusting the system you designed.
Issue #3 Trading without strict rules and only based on what we feel, or what we think the market should do is the fastest way to kiss our money goodbye.
Only 1 indicator generally is not enough. Traders generally use a combination of several indicators but they're monitoring them individually.
It's normal then to feel exhausted at the end of the day ^^ (to say the least)... and exhaustion leads to mistakes which leads to..... (I'm sure you got it) ... capital loss.
Solution #3 As a trader, I needed a trading framework and a method. I offer our trading method but they're plenty others out there. We cannot claim obviously it's the best ever ....but let's say we're using those exact same
scripts ourselves for our trading. And this what we've been recommending our clients to trade with for the past years. Also, having a tool detecting the convergence of several indicators and giving 1 unique signal
for BUY/SELL position will save you a lot of time/energy, and perhaps might help you out getting better trading performance.
IV. Resolving a complex puzzle and having fun in the process
Trading has to stay a passion and not (only be) a source of intense stress.
The most successful traders I know are "trading geeks" - literally always looking for optimizing, searching for the best possible entries, setups, indicators, tools, etc.
For them, it's not even about the money anymore, but only about beating their previous performance.
Why are they doing this? Because it's fun
Might appears as a bold statement, but I guarantee that looking for setups is fun.
One of our users even told us, that it's like playing with "Legos" and we couldn't possibly agree more.
V. Designing a system that "makes sense"
Another bold statement now. Brace yourselves ladies and gentlemen
The Algorithm Builders allow to design trading systems quickly. What could takes days/weeks/months to find out... might be now within your reach in less than a few hours.
With a bit of practice, less than an hour might be enough per asset/timeframe to find a system that makes sense to you and adapted to your trading capital and psychology.
Assuming our users read our guides and are fully committed to learning a new way of trading - then we do guarantee you'll be able to design kick-ass trading systems that make sense.
"Making sense" doesn't mean at all it's guaranteed to win, it means you're the one defining the convergence of indicators, using your Algorithm Builder, and observe that most of the time - whenever there is a BUY signal, the candlesticks are going upwards - whenever there is a SELL signal, it's going downwards.
This is a necessary step to make real progress from a trading analyst perspective - and hopefully could lead to profits.
VI. Algorithm Builder versus the main trader enemy(=psychology)
This indicator has the goal to help solving one of the MAIN issues encountered by traders.
Most of traders realize, they can't perform with only 1 indicator (or 1 price pattern or 1 price action) and need a combination of multiple indicators before getting in a trade.
Far from being a magic pill, if it could at least reduce the stress you have while trading, then we'll consider we made a great job - it's a technical "useless noise remover", and needs to be followed strictly.
Such trust in a trading system can only be built by testing your Algorithm Builder configuration on either:
1. a demo account
2. or a live account with small bids. And then, increasing progressively the bids if your capital increases progressively.
Though, you should still use your common sense. (for instance: if we get a BUY signal right on a big timeframe resistance we're hitting for the first time).
I'm aware this is a new way of trading but for many, and while we cannot foresee the future, neither predict performance, we believe it might save you a lot of time to find good signals.
My maximum level of happiness will be reached the day when our users will contact me and showing me setups being mine.
I'm sure that even I can learn from my users and, we can all learn from each other Algorithm Builder configuration
VII. What is a wrong or bad configuration?
Simply put. If you see that most of your signals react such as described below:
1. a buy triangle predicts, most of the time an upwards move
2. a sell triangle predicts, most of the time a downwards move
3. you estimated yourself the stop-loss needed to give enough room for your trades.
4. take profits based on algorithmic support and resistances or your own take profit method.
So what's a good Algorithm Builder configuration? A configuration you're happy with and makes sense.
A better Algorithm Builder setup is one used in demo or a live account w/ small bids for a few weeks, and you're consistent in your trading performance.
If you have any doubt or question, please hit me up directly or ask in the comments section of this script.
I'll never claim I have the best trading methodology or the best indicators. You only will be the judge, and I'll appreciate all the questions and feedback you're sending my way.
They help me a ton to develop indicators based on all the requests I received.
Kind regards,
Dave
Any MA bands (TMA bands V2)Hi everyone
Website will be opening very shortly :) Sorting out the last details and we're so excited to finally roll-out our different Algorithm Builders for you guys
Forewords
This present script is an evolution of the TMA bands . I would never have expected that script to become so popular to be honest
This is not only a study or idea but a really proven method and I'm glad that many of you are using it already. But please, whenever you see a new script out there, even if it looks cool and promising, please test it on a demo account for a week or on a LIVE account but with tiny amounts every time.
Many times, what you see on the chart is not what will happen in reality. I know that most of you will agree and I know exactly why we see this behavior... I'll give more details in a later post
I have plenty of methods like that one and I'll detail them on my website (and a bit on TradingView) starting next month
TMA bands on steroids
Someone asked me privately to make a generic version of the TMA bands and make it compatible with other standards Moving Average types. That's it for the specifications really as I didn't do much than re-using some piece of my own code
Suggested (but not mandatory) methodology
1) The Take Profit 1 is the middle line, Take Profit 2 is the opposite band.
2) Once the TP1 is hit, set your Stop Loss to breakeven
3) Once the TP2 is hit, if you still want to stay in the trade, set your Stop Loss to the TP1
It will be a powerful tool in your arsenal for some scalp/intraday trades
Wishing you all of you a great and profitable day
PS
It's strictly forbidden to republish this script without my explicit approval. All my posts are copyrighted from now on
Obviously you can use but not republish and get the credit or even worse... some money from your own clients
Dave
____________________________________________________________
Be sure to hit the thumbs up. Building those indicators take a lot of time and likes are always rewarding for me :) (tips are accepted too)
- If you want to suggest some indicators that I can develop and share with the community, please use my personal TRELLO board
- I'm an officially approved PineEditor/LUA/MT4 approved mentor on codementor. You can request a coaching with me if you want and I'll teach you how to build kick-ass indicators and strategies
Jump on a 1 to 1 coaching with me
- You can also hire for a custom dev of your indicator/strategy/bot/chrome extension/python
Disclaimer:
Trading involves a high level of financial risk, and may not be appropriate because you may experience losses greater than your deposit. Leverage can be against you.
Do not trade with capital that you can not afford to lose. You must be aware and have a complete understanding of all the risks associated with the market and trading. We can not be held responsible for any loss you incur.
Trading also involves risks of gambling addiction.
Please notice I do not provide financial advice - my indicators, strategies, educational ideas are intended to provide only some source code for anyone interested in improving their trading
The proprietary indicators and strategies developed by Best Trading Indicator, the object of intellectual property rights are and remain the exclusive property of Best Trading Indicator, at the exclusion of images and videos and texts free of rights or provided by the Company or external legal or physical person.
No assignment of intellectual property rights is carried out through these Terms and Conditions.
Any total or partial reproduction, modification or use of these properties for any reason whatsoever is strictly prohibited without the express written authorization of the Company.

Two MM Cross (Signal version)Hi everyone
This is a dummy two MM cross script to be used for the Trade Manager
I'll publish a video explaining how to use the Trade Manager as I received many questions.
This was my fault for not being clear enough. A video will do great wonders here
Dave

Trade Manager (Open Source Version)Hello my young padawans looking for the FORCE to get richer on your next trade
I got pinged at least three times today asking where the hell is the indicator of the day. You asked, I delivered :)
Here's your free open-source Trade Manager Version. My associates might kill me for sharing that one... anyway this is a real GIFT.
I won't share such quality indicators too often for FREE so hope you'll appreciate its value. It can really help with your day to day trading (on top of making your charts looking more awesome)
This is an even better version compared to my previous Trade Manager Trade-Manager . It's basically a standalone version, meaning you'll have to update with 2 lines your own indicator and follow my educational post from yesterday (pasted it below also) to learn how to do it
Please read this educational post I published for you before proceeding further : How-to-connect-your-indicator-with-the-Trade-Manager
From here you normally connected the data source of your own indicator to the Trade Manager. If not, here's a reminder of the article mentionned above
Step 1 - Update your indicator
For the screenshot you see above, I used this indicator : Two-MM-Cross-MACD/ . "But sir are you really advertising your other indicators here ??" ... hmmm.... YES but I gave them for free so ... stop complaining my friend :)
Somewhere in the code you'll have a LONG and a SHORT condition. If not, please go back to study trading for noobs (I'm kidding !!!)
So it should look to something similar
nUP = ma_crossover and macd_crossover
nDN = ma_crossunder and macd_crossunder
What you will need to add at the very end of your script is a Signal plot that will be captured by the Trade Manager. This will give us :
// Signal plot to be used as external
// if crossover, sends 1, otherwise sends -1
Signal = (nUP) ? 1 : (nDN) ? -1 : na
plot(Signal, title="Signal")
The Trade Manager engines expects to receive 1 for a bullishg signal and -1 for bearish .
Step 2 - Add the Trade Manager to your chart and select the right Data Source
I feel the questions coming so I prefer to anticipate :) When you add the Trade Manager to your chart, nothing will be displayed. THIS IS NORMAL because you'll have to select the Data Source to be "Signal"
Remember our Signal variable from the Two MM Cross from before, now we'll capture it and.....drumb rolll...... that's from that moment that your life became even more AWESOME
The Engine will capture the last signal from the MM cross or any indicator actually and will update the Stop Loss, Take Profit levels based on the parameters you set on the Trade Manager
It should work with any indicator as long as you're providing a plot Signal with values 1 and -1 . In any case, you can change the Trade Manager you'll find a better logic for your trading
Now let's cover the different parameters of the tool
It should be straightforward but better to explain everything here
+Label lines : if unchecked, no SL/TPs/... will be displayed
+Show Stop Loss Signal : Will display the stop loss label. You have the choice between three options :
By default, the Stop Loss is set to NONE. You'll have to select a different option to enable the Stop Loss for real
++Percentage : Will set the SL at a percent distance from the price
++Fixed : SL fixed at a static price
++Trailing % : Trailing stop loss based on percentage level
The following is a KEY feature and I got asked for it many times those past two days. I got annoyed of getting the same request so I just did it
++Trailing TP: Will move the Stop Loss if the take profit levels are hit
Example: if TP1 is hit, SL will be moved to breakeven. If TP2 is hit, SL will be moved from TP1 to TP2
+Take Profit 1,2,3 : Visually define the three Take Profit levels. Those are percentage levels .
Meaning if you set TP1 = 2, it will set the TP1 level 2% away from the entry signal
Please note that once a Take profit level is reached, it will magically disappear. This is to be expected
I'll share in the future a way more complete version with invalidation, stop loss/take profits based on indicator, take profit based on supports/resistances, ...
I believe is such a great tool because can be connected to any indicator. I confess that I tried it only with a few... if you find any that's not working with the Trade manager, please let me know and I'll have a look
PS
I want to give a HUUUUUUUGE shoutout to the PineCoders community who helped me finishing it
Wishing you all the best and a pleasant experience with my work
David

Trade ManagerHello everyone
Hoped you had a great weekend and are ready for what's coming this week
I'll never fail to satisfy my audience on TradingView and I'll start by sharing some heavy stuff.... Imagine the most amazing thing you had in your life. You got it ? now multiply this good feeling by 100 !!! OK... now I have a tool that is beyond that litteraly. Don't believe me, here's the Trade Manager ladies and gentlemen, I could barely contain my excitement this weekend to share it with the community
I wasn't sure of sharing it but you guys did a great job with my other indicators giving me constructive feedback to improve them. Also, those helping me with such feedback usually get the indicator for a lifetime access for free.
Please read this educational post I published for you before proceeding further : How-to-set-an-indicator-to-work-with-the-Trade-manager/
From here you normally connected the data source of your own indicator to the Trade Manager. If not, here's a reminder of the article mentionned above
Step 1 - Update your indicator
Somewhere in the code you'll have a LONG and a SHORT condition. If not, please go back to study trading for noobs (I'm kidding !!!)
So it should look to something similar
macrossover = crossover(MA1, MA2)
macrossunder = crossunder(MA1, MA2)
What you will need to add at the very end of your script is a Signal plot that will be captured by the Trade Manager. This will give us :
// Signal plot to be used as external
// if crossover, sends 1, otherwise sends -1
Signal = macrossover ? 1 : macrossunder ? -1 : na
plot(Signal, title="Signal")
The Trade Manager engines expects to receive 1 for a bullishg signal and -1 for bearish .
Step 2 - Add the Trade Manager to your chart and select the right Data Source
I feel the questions coming so I prefer to anticipate :) When you add the Trade Manager to your chart, nothing will be displayed. THIS IS NORMAL because you'll have to select the Data Source to be "Signal"
Remember our Signal variable from the Two MM Cross from before, now we'll capture it and.....drumb rolll...... that's from that moment that your life became even more AWESOME
The Engine will capture the last signal from the MM cross or any indicator actually and will update the Stop Loss, Take Profit levels based on the parameters you set on the Trade Manager
Now I'll cover the different parameters of the tool
It should be straightforward but better to explain everything here
+Label lines : if unchecked, no SL/TPs/... will be displayed
+Show indicators : This does nothing. Tradingview doesn't give the possibility to set Labels on an UI so we have to use this hack with a useless checkbox
+Show PnL Panel : Will show a Panel at the right of your chart with the PnL updated for the last position only. In a future version, I'll make it work to list maybe the previous N positions defined by the user
+Show Stop Loss Signal : Will display the stop loss label. You have the choice between three options :
++Percentage : Will set the SL at a percent distance from the price
++Fixed : SL fixed at a static price
++SuperTrend : Trailing stop loss based on Supertrend
'll add many more options this week for sure
+Take Profit 1,2,3 : Visually define the three Take Profit levels
Please note that once a Take profit level is reached, it will magically disappear. This is to be expected
This indicator is a first draft of what I believe is such a great tool because can be connected to any indicator. I confess that I tried it only with a few... if you find any that's not working with the Trade manager, please let me know and I'll have a look (for free)
I'm so excited to share it with all of you and that's the best possible way I could ever dreamt of to start the week with my TradingView community
Wishing you all the best and a pleasant experience with my work
David
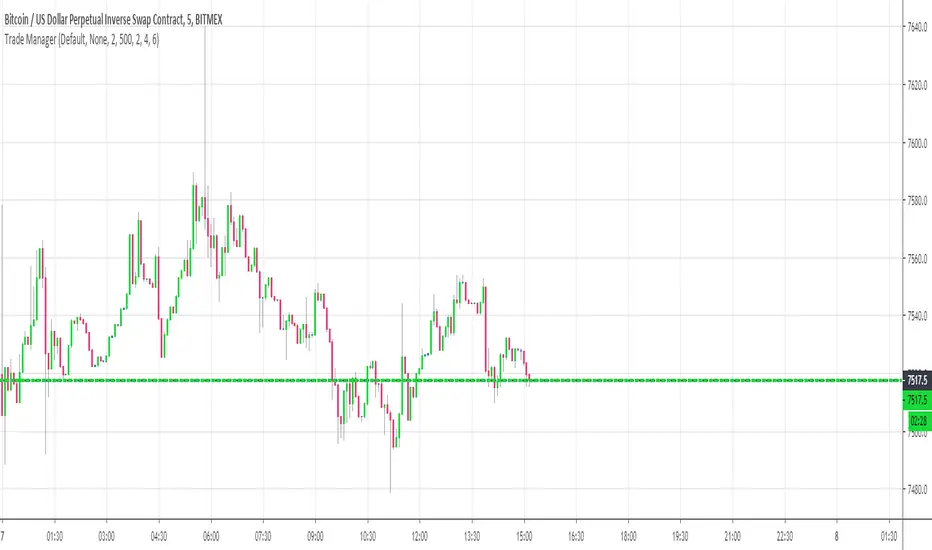
Musashi-TrendBarsThis is a script that has a unique approach to trending. This offers a multi-phase concept of trending, which is shown by a multitude of colors. This non-repainting indicator will predict the phases of trend change and progression. This script is under research at this point, and is considered an alpha version.
LEGAL STUFF:
Risk Disclosure
Futures , forex, stock, crypto and derivative trading contains substantial risk and is not for every investor. An investor could potentially lose all or more than the initial investment. Risk capital is money that can be lost without jeopardizing ones’ financial security or life style. Only risk capital should be used for trading and only those with sufficient risk capital should consider trading. Past performance is not necessarily indicative of future results
Hypothetical Performance Disclosure
Hypothetical performance results have many inherent limitations, some of which are described below. no representation is being made that any account will or is likely to achieve profits or losses similar to those shown; in fact, there are frequently sharp differences between hypothetical performance results and the actual results subsequently achieved by any particular trading program. One of the limitations of hypothetical performance results is that they are generally prepared with the benefit of hindsight. In addition, hypothetical trading does not involve financial risk, and no hypothetical trading record can completely account for the impact of financial risk of actual trading. for example, the ability to withstand losses or to adhere to a particular trading program in spite of trading losses are material points which can also adversely affect actual trading results. There are numerous other factors related to the markets in general or to the implementation of any specific trading program which cannot be fully accounted for in the preparation of hypothetical performance results and all which can adversely affect trading results