Why Holding Bitcoin Beats Trading It for Most PeopleI don’t want to be offensive, but I can speak from experience.
Most people would make more money simply by holding Bitcoin than by trying to leverage trade it.
The data is clear. More than 95% of people lose money in crypto, mainly because of leverage and greed. I do trade Bitcoin as well, with a portion of my capital, and I’m doing fine. In 2025, I had 20 Bitcoin trades with a quite good win ratio:
Trading can work, but only for a small minority, and usually after years of experience.
🧪 Let’s compare it with my HODL portfolio (the bigger part).
I bought Bitcoin back in 2018. Here: The price today is more than 30× above my initial entry. That alone has produced far more gains than active trading over the same period.
🧪 Let’s put this into perspective.
To achieve a 30× return through trading over six years, you would need to generate more than 76% per year, every year. In simple terms, that means turning $10,000 into $300,000 purely through trading. That level of performance would require exceptional skill, discipline, and time, while increasing position size after every trade to compound and avoiding major mistakes.
🧪 And here is the problem — avoiding major mistakes.
Everyone makes mistakes in trading or in predicting the price. I was wrong with my target for this cycle: and I was not alone. In this post from Excavo, we can see how big players and institutions were wrong as well and completely missed the predictions No one can predict the market with 100% accuracy.
⁉️ So why people think they can outsmart the market on lower timeframes?
Because they chase quick gains in altcoins or believe they can make money in the market with leverage. Most can’t. Most lose.
📌 Let’s compare it:
1️⃣ Being wrong as a trader — stress, time wasted on screens, and you are losing money.
2️⃣ Being wrong as a long-term holder — no stress, you have more time to accumulate more BTC into your cold wallet and do almost nothing.
Don’t get me wrong, being a hodler is also not easy. I faced a drop from 69K to 15K. If you don’t understand Bitcoin and don’t have conviction, the FUD news, which often appears near the lows, can destroy you and force you to sell.
If you don’t know much about BTC, I suggest you study it. I’ll give you just three points here, but there is much more.
✅Central banks will not stop printing money; your purchasing power will continuously go down.
✅Bitcoin has a fixed supply of 21 million coins.
Not approximately. Not subject to change. Exactly 21 million.
✅By 2030, 99% of all Bitcoins will be mined. The rest will be mined over the next 100 years.
So what to do?
Of course, we are traders — we are going to trade. But I suggest you separate capital for trading and trade only with that. Never trade your long-term investment.
If you don’t have any physical BTC in your cold wallet, your ultimate goal should be to get to 1 Bitcoin and hold it long term, untouched.
🛡️ Here is how to behave.
On the chart below, I have spotted that BTC is flipping bearish and we could potentially go to 70K, and if a strong bear market hits, I believe it could dip below 50K:
1️⃣ As a trader - I flipped my bias to the bearish side and took a few shorts recently on a crypto exchange.
2️⃣ As an investor - I do nothing. I will be DCAing and building my long-term position. Remember, by 2030, 99% of BTC will be mined. M2 money supply will expand. Block rewards will be halved. The price will most likely be much higher.
I promised myself I’d become the person I once needed the most as a beginner. Below are links to a powerful lessons I shared on Tradingview. Hope it can help you avoid years of trial and error I went thru.
📊 Sharpen your trading Strategy
⚙️ 100% Mechanical System - Complete Strategy
🔁 Daily Bias – Continuation
🔄 Daily Bias – Reversal
🧱 Key Level – Order Block
📉 How to Buy Lows and Sell Highs
🎯 Dealing Range – Enter on pullbacks
💧 Liquidity – Basics to understand
🕒 Timeframe Alignments
🚫 Market Narratives – Avoid traps
🐢 Turtle Soup Master – High reward method
🧘 How to stop overcomplicating trading
🕰️ Day Trading Cheat Code – Sessions
🇬🇧 London Session Trading
🔍 SMT Divergence – Secret Smart Money signal
📐 Standard Deviations – Predict future targets
🎣 Stop Hunt Trading
💧 Liquidity Sweep Mastery
🔪 Asia Session Setups
🧠 Level Up your Mindset
🛕 Monk Mode – Transition from 9–5 to full-time trading
⚠️ Trading Enemies – Habits that destroy success
🔄 Trader’s Routine – Build discipline daily
💪 Get Funded - $20 000 Monthly Plan
🧪 Winning Trading Plan
🛡️ Risk Management
🏦 Risk Management for Prop Trading
📏 Risk in % or Fixed Position Size
🔐 Risk Per Trade – Keep consistency
Adapt useful, Reject useless and add what is specifically yours.
David Perk
Trading Plan

How Smart Money Trap Retailer 22 Dec 2025This video explains how smart money traps retail traders by focusing on how institutional participants think and operate as a coordinated group rather than as individuals. The discussion highlights how liquidity is created around obvious price levels, how collective positioning works, and why retail traders often react emotionally while smart money plans strategically.
The objective of this video is to build awareness about smart money behavior, team-based execution, and liquidity-driven market movement, helping viewers understand market dynamics from a learning perspective rather than a signal-based approach.

WELCOME TO THE SCALPING ANT ECOSYSTEM
Thank you for your purchase and trust.
You now have access to the Premium TradingView Indicator Suite.
What Happens Next
• Your TradingView username will be granted access
• Access is done manually to ensure protection and security
• Normal activation time: 0–12 hours
• You will receive a confirmation when access is completed
🧠 How Your Access Works
All scripts are:
• Invite-Only
• Non-repainting
• Professional trading tools
• Designed for structure, clarity, and disciplined execution
📩 Need Support?
If you require help, have questions, or something is not working, contact me directly via:
Whop Support → Message Seller
I respond as fast as possible.
⚠️ Trading Disclaimer
This product does not guarantee profits. Trading involves risk and requires responsible risk management. You are fully responsible for your trading decisions.
Trade with structure.
Trade with discipline.
— The Scalping Ant

Backtesting vs Reality. A Year on the Charts - Lessons for 2026Backtesting is not optional. And this has nothing to do with being a beginner exploring a new trading strategy or a professional trader.
Think about UFC fighters. Think about boxers. Think about elite athletes at the highest level of their sport. They are champions. They already proved themselves. Yet they still train. Three, four, five times a week. They don’t stop just because they “made it”.
💊 Trading is no different.
If you stop training, you slowly lose your edge. You become sloppy. Emotional. Overconfident. And the market will remind you very fast who is in charge.
For us as traders, training means backtesting, forward testing, and reviewing our own trades. At least once a week. Ideally bi-weekly. This is our gym. This is our sparring session. This is where mistakes are exposed without costing real money.
This article is not about how to backtest. TradingView already gives you simple tools for that. Everyone can click candles and simulate trades.
3️⃣0️⃣0️⃣ is your number
If you run at least 300 trade backtests on any trade pattern, this is what happen to you:
• No pattern guessing or fitting to price action
• No overthinking — you just follow the same setup you know works
• Fixed SL and TP, fixed RR — no guesswork
• You know your win rate %
• You know your risk-reward %
• Repetitiveness builds confidence and clarity
• Confidence and clarity lead to improvements
• Improvements lead to mastery over time
‼️ Again a statistical edge is only possible through a mechanical trading approach and proper backtesting. If you’ve done your backtests and have statistical data on a large sample, let’s say:
📌 Win Rate: 65%
That means out of 100 trades, you’ll win 75 — but there can still be 25 losses.
You never know the distribution of wins and losses, you only know that you’ll win over a series of trades.
📌 Average RR: 2.3
That means for every $100 you risk, you’ll win $230 if you’re right, and lose $100 if you’re wrong.
The reality is always different than backtest, in reality you will perform worse. Here is what you should at least achieve Here is also important to consider your ability to hold in the trade. Its amazing to catch 1:5 risk reward trades, but it mostly comes with low win ratio in other words, you will get stopped out few times until you get big trade. Also 1:5 risk reward usually has a pullback during the move. Can you face it without emotions being affected?
Most importantly, you finally understand something every professional lives by: you don’t know the distribution of the trades.
You may have a 65% percent win rate. It still means that you can have 35 losses out of 100 traders. Remember distribution of wins and losses is random , you never know outcome of next trade.
It could be win win loss win. Or loss loss loss win win. Or a brutal streak of seven losses before the market pays you back.
✅✅❌✅❌❌✅✅✅✅❌✅
When wins and losses are evenly distributed it's quite comfortable to continue in opening new trades. You still believe your strategy and it's simply normal to have loss time to time.
✅❌❌❌✅❌❌❌❌❌✅✅
But what you gonna do when such a streak comes? Are you gonna doubt your strategy? Are you gonna look for different strategy? Remember 65% success rate means 35 possible losses out of 100. If 20 losses comes in a row your long term statistics still was not broken.
Dont think this cant happen to you. If this didnt happen to you yet, you are not trading for long enough. It will come and it's better to be prepared.
📌 Lets look at the Monte Carlo simulation with our 65% win ratio and 2RR
As we can see on the picture below if you start with 10K and follow your strategy in a short period of one month we can face drawdown and end unprofitable even when we did everything right.https://www.tradingview.com/x/lcWQSlUa/ Why? We did everything right and we have positive winning ratio and Risk reward
📌 Random distribution of the trades
I don't win every trade, you don't win every trade. No one does. Trading is longterm game and short term result can be a bit random. Because you are might trend trader and market can stay in the range during some months or you are a reversal trader and its still trading against you. So how to beat it - Time.
📌 Lets improve Risk reward to 2.3
You will be getting slightly bigger wins so every loosing streak will be recovered faster.
And you should not stay in the prolonged drawdowns for long periods 📌 Lets improve win ration to 70%
And its even better less often you got loss and 2.3 RR recover slightly better. 🧪 The above is what I have been able to get from my backtests, it means I should have a quite easy and profitable year. So let's examine what was the reality and if I did all right.
✅ 2025 Statistical Overview
My average R:R came out at 2.36. That tells me something very clear. Trades around 2.3R are the ones that hit cleanly. They run smoothly without deep pullbacks. They feel controlled. From experience, 2.3R is my sweet spot. That’s where I’m comfortable. That’s where my edge is strongest.
✅ Macro Outlook - Total Trades - Win RR - RR Across the year, I took 198 trades. Win rate was 62%. Total R was around 200. If I risked 1% per trade, that’s roughly 200% for the year. I personally risked slightly more, but that’s not the point of this post. On paper, this is solid data. But the real lessons came when I broke it down month by month.
✅ Monthly Results
Some months had win rates around 75, 78, even 80%. Other months dropped below 65%. Some went as low as 50% or even 33%. When I compared this with trade frequency, the pattern was obvious. Every month where I took more than 15 trades, my performance dropped. August was the worst example. Almost 30 trades. Worst month of the year.
‼️ This tells me something very simple. When I trade less, I wait for my best setups. When I trade more, I force trades. 15 trades per month is the sweet spot. Less really is more.
✅ Days of the week
Monday had a win rate of only 44%. Low R. Low quality. Clear message. Mondays are not worth it for me as it's mostly where market makers are setting initial balance for the week. Tuesday, Wednesday, and Thursday are usually strong for me as Monday range manipulation is great setup.
📍 Friday was one of the best days. (not big data sample to confirm)
Why? Because if it was a specific week with a strong moves earlier in the week, Friday often gives clean pullbacks or reversals. The market is tired. Liquidity behaves differently. Those setups are easier to manage.
✅ Trading Sessions
The highest win rate came from New York and the PM session. Late London into late New York.Most major reversals start late in the day. They continue into Asia. Sometimes the best entries are at the end of the session, not the beginning. If you wait for the next morning, you’re often late. Being in position overnight, when it makes sense, has paid off for me many times.
✅ Trading Pairs
I traded multiple FX pairs & Alt-coins, but mostly traded EUR and GBP, CHF, USD Index and Bitcoin as well. Although I had a great trades on the Gold overall it was losing for me. Best performers for me were Bitcoin, EUR, GBP, USD, and CHF. That’s where my edge lives. That’s what I’ll focus on.
✅ Trading Models & Timeframes
I use 2 Trading models. Model 3 is in development. Model 0 means I didn't stick to strategy. Model 1 is my main weapon. Best consistency. Best overall profit. Not always the highest R, but the most reliable. Model 2 and Model 3 also performed well. (Model 3 small data sample)
‼️ Model 0 is the problem.
Model 0 means I entered without confirmation. Trading on feeling. Impulse. Ego.
I must stop doing this.
✅ CLS Range - Timeframes
Daily and weekly levels worked best for me. Monthly works sometimes, but holding trades that long doesn’t suit my personality and H4 although it produced good results, trading this CLS ranges would mean spending too much time behind the charts. ✅ HTF Key Levels and LTF Entry Levels
You don’t need fifty type of the key levels. Although I trade also FVG and IFVG. Most of my trades comes from Order block. You don’t need to know everything. You need one or two tools that you truly master. That’s it. This is how backtesting came to reality, as you can see reality is different, but I was quite close.
Data from the past year are not based only a strategy, but also my behavior. Which is clear reflection of my mistakes - Now I know what to do to be even better in 2026.
🔑 Key Point for the Strategy in 2026
- Average target around 2.3R.
- Maximum 15 trades per month.
- No Mondays.
- Focus on New York and PM sessions.
- Trade only EUR, GBP, DXY, CHF, and Bitcoin.
- Stick to Models 1, 2, and 3. Eliminate Model 0.
- Daily and weekly ranges only.
- Order blocks as primary key levels.
📌 How to turn it in to a $24 000 a month in 4 steps?
Magic of 3% Yes, you actually need to make only a 3% a month. Is it difficult ? No, It's not. You need 3 wins with 1:2 RR while risking 0.5% Risk.
1️⃣ Your Ultimate goal
-$100K Funded account - 3% Gain - 80% Profit split = $2400 Payout
2️⃣ Let's take it to $24 000 a Month
- Don't try to increase your % gains per month, increase your capital under management
3️⃣ Get another 4 x $ 100K Challenges pass them
- You will have $500K AUM:
- $ 500 000 - 3% Gain - 80% Profit split = $12 000
4️⃣ Reinvest buy another 3 - 5 challenges
Aim for $ 1000 000 funded across few solid props firms. 🎯 $ 1000 000 - 3% gain - 80% Profit Split = $24 000 Payout
🎯 $ 1000 000 - 3% gain - 80% Profit Split = $24 000 Payout
🎯 $ 1000 000 - 3% gain - 80% Profit Split = $24 000 Payout
Lets goo !!!
I promised myself I’d become the person I once needed the most as a beginner. Below are links to a powerful lessons I shared on Tradingview. Hope it can help you avoid years of trial and error I went thru.
📊 Sharpen your trading Strategy
⚙️ 100% Mechanical System - Complete Strategy
🔁 Daily Bias – Continuation
🔄 Daily Bias – Reversal
🧱 Key Level – Order Block
📉 How to Buy Lows and Sell Highs
🎯 Dealing Range – Enter on pullbacks
💧 Liquidity – Basics to understand
🕒 Timeframe Alignments
🚫 Market Narratives – Avoid traps
🐢 Turtle Soup Master – High reward method
🧘 How to stop overcomplicating trading
🕰️ Day Trading Cheat Code – Sessions
🇬🇧 London Session Trading
🔍 SMT Divergence – Secret Smart Money signal
📐 Standard Deviations – Predict future targets
🎣 Stop Hunt Trading
💧 Liquidity Sweep Mastery
🔪 Asia Session Setups
🧠 Level Up your Mindset
🛕 Monk Mode – Transition from 9–5 to full-time trading
⚠️ Trading Enemies – Habits that destroy success
🔄 Trader’s Routine – Build discipline daily
💪 Get Funded - $20 000 Monthly Plan
🧪 Winning Trading Plan
🛡️ Risk Management
🏦 Risk Management for Prop Trading
📏 Risk in % or Fixed Position Size
🔐 Risk Per Trade – Keep consistency
Adapt useful, Reject useless and add what is specifically yours.
David Perk

THE 16 BIGGEST TRADING MISTAKES: WHY MOST TRADERS FAILBefore you take the plunge into the live markets, consider these common mistakes you should avoid. Whether you are trading Crypto, Forex, or Stocks, these are the main reasons new traders fail to become profitable.
1. TRADING WITHOUT A STOP LOSS
You should have a stop-loss order for every trade you take. If you start taking losses on a trade, the stop-loss prevents you from losing more than you can handle.
2. ADDING TO A LOSING DAY TRADE
Averaging down is adding to your position (the price you purchased the trade at) as the price moves against you, in the mistaken belief that the trend will reverse.
3. RISKING MORE THAN YOU CAN AFFORD TO LOSE
You should set a percentage for the amount you are willing to lose in a day. If you can afford a 3% loss in a day, you should discipline yourself to stop at that point.
4. GOING ALL IN
Traders might have had several losing trades in a row, which creates a revenge seeking streak. If you risk too much you are making a mistake, and mistakes tend to compound.
5. TRYING TO ANTICIPATE THE NEWS
Instead of anticipating the direction that news will take the market, have a strategy that gets you into a trade after the news release. You can profit from the volatility without all the unknown risks.
6. CHOOSE THE WRONG BROKER
Depositing money with a broker is the biggest trade you will make. If it is poorly managed, in financial trouble, or an outright trading scam, you could lose all your money.
7. TAKE MULTIPLE TRADES THAT ARE CORRELATED
If you see a similar trade setup in multiple pairs, there is a good chance those pairs are correlated. If you take multiple day trades at the same time, make sure they move independently of each other.
8. TRADING WITHOUT A PLAN
If a trader doesn't have a trading plan, it results in unnecessary gambles. Create a trading plan and test it on a demo account before trying it with real money.
9. OVER-LEVERAGING
While this feature requires less personal capital per trade, the possibility of enhanced loss is real. The use of leverage magnifies gains and losses, so managing the amount of leverage is key.
10. LACK OF TIME HORIZON
Each trading approach aligns itself to varying time horizons, therefore understanding the strategy will lead to gauging the estimated time frame used per trade.
11. MINIMAL RESEARCH
Studying the market as it should be, will bring light to market trends, timing of entry/exit points and fundamental influences as well. The more time dedicated to the market, the greater the understanding of the product itself.
12. POOR RISK-TO-REWARD RATIOS
A minimum risk:reward a trader should aim is 1:3, any trade setups below this shouldn't be taken.
13. EMOTION BASED TRADING
Traders frequently open additional positions after losing trades to compensate for the previous loss. These trades usually have no educational backing either technically or fundamentally.
14. INCONSISTENT TRADING SIZE
Trading size is crucial to every trading strategy. Many traders trade inconsistent lot sizes. Risk then increases and could potentially erase account balances.
15. TRADING ON NUMEROUS MARKETS
Many novice traders look to trade on multiple markets without success due to lack of understanding. Unfortunately, many traders entered at the "FOMO or Euphoria" stage which resulted in significant losses.
16. NOT REVIEWING TRADES
Frequent use of a trading journal will allow traders to identify possible strategic flaws along with successful facets.
SUMMARY
Trading is not a get-rich-quick scheme; it is a business of managing risk. If you can eliminate these 16 errors from your daily routine, you are already ahead of 90% of market participants.
Which of these mistakes is the hardest for you to avoid? Let me know in the comments below!
Disclaimer: This content is for educational purposes only. Trading involves significant risk.

How to Break Out of the Cycle of Blowing Your Trading AccountIf you’ve been trading for over two years and still keep blowing your account, unless you do what I outline below, you’ll stay trapped in the same cycle.
Why You’re Still Blowing Your Account
There are two main reasons:
You’re overrisking or overleveraging.
You’re in a sustained losing streak caused by a bad trading plan or not following one at all.
But the real reason runs much deeper than that.
The Root of the Problem
Most people get into trading because they have a rebellious streak. you want to break away from social norms and create a life that gives you freedom. You want freedom to travel, to provide for your family your way, to buy what you want, when you want.
Somewhere along the way, you tied freedom to rebellion. You believe that to be free, you must resist rules and do things your own way.
That mindset is the same one that leads you to:
Overtrade or revenge trade.
Ignore your trading rules.
Blow your account, again and again.
Break commitments in other areas of life too.(relationship, debt, laws)
Freedom vs. Rebellion
Here’s the truth: freedom and rebellion are opposites.
Think about it.
When has a rebellious nation ever enjoyed the kind of freedom that comes with security, access, prosperity, and opportunity?
Compare Sudan, a country in constant conflict, with Switzerland, which has enjoyed peace and stability for decades.
Where do people live better, freer lives?
So, if you want true freedom, you must break the paradigm by seeing the contradiction between what you believe and what actually works.
What True Freedom Requires
To be free, you need the very things you’ve been avoiding:
Structure
Rules
Regulation
Obedience
That’s where discipline, respect for authority, and consistency begin.
In trading:
The market is the authority.
Your trading plan is the law.
Only through obedience to both will you ever achieve real trading freedom.
Build Discipline from the Ground Up
How you do anything is how you do everything.
Start with the small things:
Make your bed every morning.
Keep your home tidy.
Follow a schedule.
Track your income and expenses like a business owner.
When you build discipline in everyday habits, it naturally extends to how you trade.
Eventually, you’ll see how ridiculous it is to trade without a solid plan or to keep breaking your own rules.
That’s the moment your paradigm shifts and you finally break the cycle of blowing your account.
God bless and wishing you profitability in 2026

How to Stop Guessing and Start Trading with IntentThe Psychology Behind Trading Decisions
Estimates suggest that only about 5% of human brain activity is conscious . The remaining 95% operates at a subconscious level — outside our direct control and awareness. If this is true, then in trading, most decisions are also made unconsciously.
As Somerset Maugham once said:
“ Money is a sixth sense — without it, you cannot fully use the other five. ”
Money goes far beyond being a simple medium of exchange. It becomes an emotional and psychological factor that directly affects our sense of security, freedom, and control .
Investing and trading are among the few fields where participants work directly with money for the purpose of increasing it . And this is exactly where the trap lies — one that almost all beginners, and even experienced traders, fall into.
Why Trading Is Psychologically Different from Business
When the object of activity is not a product, not a service, and not a process, but money itself , the psyche begins to respond differently.
Consider a motherboard manufacturer. Their activity generates income only after the product is sold. There is always distance between the action and the money :
development
production
logistics
marketing
distribution
time
Profit in such a business is the result of a well-built system , not the outcome of each individual action.
In trading and investing, this distance disappears.
Money is no longer the result — it becomes the direct object of work.
Every decision is instantly reflected in the account balance
Every mistake becomes an immediate loss
Every winning trade delivers instant emotional reward
At this point, money ceases to be a neutral tool and turns into a psychological trigger .
How the Market Hijacks Decision-Making
Fear of loss intensifies.
Greed increases.
Decision-making accelerates.
Choices are no longer driven by logic, but by automatic reactions :
fear of loss
greed
the need to be right
the urge to quickly recover losses
The market constantly provokes these reactions. Without structure, a trader begins to act impulsively — even while believing that everything has been “ carefully thought through .”
The Illusion of Rationality
A sense of rational process emerges:
the chart is analyzed
arguments for entry are found
exit levels are reconsidered
Yet without pre-defined rules , these actions are not logic. They are attempts to justify a decision made under the influence of the moment.
Trading turns into a sequence of chaotic market decisions:
mental pressure builds
motivation fades
fatigue sets in
internal tension accumulates
Each new trade begins to feel like a way to “ fix ” the previous one.
In such an environment, the trader stops managing risk and starts being managed by emotions .
An illusion of control appears:
just a bit more analysis, one more argument — and the market has to respond correctly.
If this sounds familiar, you know the feeling.
Why Most Losses Actually Happen
Most losses occur not because of poor analysis, but because the plan was not fixed before entry .
When trade management is no longer handled by a strategy, it is taken over by the psyche.
And the psyche cannot work with probabilities — it can only:
avoid pain
seek pleasure
Where Logical Trading Begins
Logical trading begins where the subconscious has nothing left to decide .
All key questions are answered in advance:
What is a valid trigger and confirmation for entry?
When and how will I exit?
How do I interpret mistakes?
Under what conditions do I not trade?
How is risk managed?
At the moment of execution, the trader does not think — he executes .
And the fewer decisions that must be made while in a position, the lower the chance that those decisions will be driven by fear or hope .
The Role of a Trading Strategy
So how can this be achieved?
The answer is a trading strategy.
A trading strategy is not :
a set of indicators
a “favorite setup”
A trading strategy is a formalized logic of actions that exists before entering the market.
It answers all key questions in advance and leaves no room for improvisation at the moment when pressure is highest.
Crucially, the strategy must be documented — not only in your head, but on paper or in digital form — so the market has no chance to confuse you.
What a Solid Trading Strategy Defines
A complete strategy clearly specifies:
which method of analysis is used
under what market conditions trading makes sense
how a trade idea is formed
what time of day trading is conducted
which analytical tools are used and how they are interpreted
where the trade idea is proven wrong
specifics of trading different assets
how risk and position size are calculated
how the trade is managed after entry
how mistakes are reviewed and analyzed
A strategy is not something you “feel”
If it can be changed during the trade — it is not a strategy
Strategy vs. Losses
It is important to understand:
A strategy does not eliminate losses. It eliminates chaos.
A loss within a strategy is a planned expense , not a mistake.
A mistake is a rule violation driven by emotion .
When a strategy is clearly defined and tested, the trader’s role is reduced to execution .
At this point:
you stop “feeling the market”
you start working with probabilities
A single trade no longer matters.
What matters is the series , the statistics , the long run .
That is why professionals think not in terms of profit or loss, but in terms of process .
Final Thought
A trading strategy takes over the 95% of decisions that were previously made subconsciously.
The trader is left with only one task:
Follow the system..
Enjoy!

A Step Back For Developing My Trading PhilosophyI am now halting or my activities to develop a trading plan, and going back to the drawing board not to build a new trading plan, but for developing my trading philosophy.
I know that any business needs to establish itself based on a philosophy. When I got into trading, I totally forgot about that and started my journey concentrating on learning the different trading schools, technical analysis and technical indicators...etc.
This is the beauty of hitting a wall. It makes the mind ask questions and search for better ways. Success does not do that. Success makes us keep moving forward without even a glimpse on the basics of things. Only when things do not work, we go back to see how we can do it right, and by doing so, we are forced to back to the basics and forced to enforce the foundations of whatever we intend to build.
The past weeks were a roller-coaster, were a trading plan works beautifully, then it collapses on me. This made me try to find answers, but thankfully this time, I didn't go to try to learn about a different trading school or a different tools to design a better trading plan, but rather, made me go back to the foundations and ask myself about my trading philosophy.
I came up with two areas of focus; Understanding price cause and effect, and understanding the dynamics of the asset that I am trading. I deleted all the 28 tabs of the 28 currency pairs, and now I am going to educate myself about one pair only.
I am going to use the "Replay Feature" on TradingView, and will go back to the beginning of the year 2025, and start building up my charts to understand only this pair, and what I would want to understand is what affects the price to move.

Gold vs Real Estate: Which Is Safer?Gold vs Real Estate: Which One Truly Keeps Your Money Safe in Uncertain Times?
When markets turn unstable, the first question that always comes up is: “ How do I keep my money safe ?”
Almost immediately, two familiar names are put on the scale: gold and real estate .
One is a globally recognized defensive asset.
The other is a tangible asset tied to land and long-term growth cycles.
But safety does not lie in the name of the asset — it lies in how you use it .
Safety does not mean “never going down”
Many people mistakenly believe that a safe asset is one that never declines in price. In reality, every asset goes through corrections .
True safety means:
When you need cash, can you actually convert it?
When markets deteriorate, can you withstand the psychological and cash-flow pressure?
When the cycle shifts, does that asset help you survive?
And this is exactly where gold and real estate begin to diverge.
Gold — safety through liquidity and defense
Gold is considered safe because it does not depend on a single economy . When inflation rises, crises emerge, or confidence in fiat currencies weakens, gold is often chosen as a safe haven.
Gold’s greatest strength is liquidity . It can be converted into cash almost instantly, nearly anywhere in the world. This makes gold an effective defensive tool during periods of strong market volatility.
However, gold does not generate cash flow . Its price can also move sideways for long periods, requiring patience and a capital-preservation mindset rather than a get-rich-quick mentality.
Real estate — safety through tangibility and long-term value
Real estate feels safe because it is tangible and familiar . The land remains. The property remains. Over the long term, real estate tends to appreciate alongside economic growth and urbanization.
In addition, real estate can generate rental income , something gold cannot offer. For investors with stable capital and no pressure to rotate funds quickly, this is a major advantage.
The trade-off, however, is low liquidity . When markets weaken or credit conditions tighten, selling property can take a long time. If leverage is involved, this so-called “safe asset” can quickly become a financial burden.
The core difference: time horizon and flexibility
Gold suits investors who value flexibility and fast response .
Real estate suits those with long-term vision, substantial capital, and the ability to endure cycles .
Gold helps you defend in the short to medium term .
Real estate helps you build wealth over the long term .
No asset replaces the other.
They differ only in their role within your financial strategy .

Why We Think Retail Trader Exit Their Position | Smart MoneyThis video explains why retail traders often exit their positions early, especially on the first candle. The discussion focuses on how early volatility, emotional reactions, lack of structure clarity, and liquidity-driven price behavior can force premature exits. By observing first-candle behavior and market structure, the video highlights common mistakes that lead traders to exit before the market reveals its true intent.
The purpose of this video is to build awareness around early-session price behavior and help understand why retail traders struggle to hold positions—purely from an educational and price-action perspective.

Liquidity Sweep: All the Info You Ever Need to ConquerHi whats up guys, today lets try to do it in a bullet points instead of writing my stories.
• Liquidity is the reason price moves.
• Markets move toward areas where orders are stacked.
• Most orders sit above highs and below lows.
• That’s why price keeps attacking those areas again and again. 🧪 What a liquidity sweep really is
• A liquidity sweep is a move beyond a clear high or low.
• Its purpose is to trigger clustered stop losses.
• It is not personal and not about your stop.
• It is required so larger players can enter or exit positions. 🧪 Why most traders get caught
• Traders enter at obvious levels inside ranges.
• They usually use tight stop loss
• These areas become liquidity pools.
• Price must visit them before a real move starts. 🧪 Double tops and bottoms
• Repeated reactions are not strength.
• They are preparation.
• Every touch builds more resting stops.
• Triple tops and bottoms are even more attractive.
• Never enter before price runs into them. 🧪 How I read market structure
• I don’t focus on patterns in isolation.
• I focus on where liquidity is being collected.
• Structure is simply the path price takes to grab orders.
• The real move usually starts after the sweep.
1️⃣ USDCHF Sweep and Long - CIOD confirmation click picture👇https://www.tradingview.com/chart/USDCHF/2AbnD2TR-USDCHF-I-Daily-CLS-range-I-Key-Level-FVG-I-HTF-CLS/ 2️⃣ USDJPY Sweep andLong - CIOD confirmation - Click picture 👇https://www.tradingview.com/chart/USDJPY/j18Eh18R-USDJPY-Weekly-CLS-I-Key-Level-OB-Model-1/ 3️⃣ AUDUSD Turtle Sweep and short - CIOD confirmation click picture👇https://www.tradingview.com/chart/AUDUSD/YzC7vNOf-AUDUSD-I-Daily-CLS-range-I-Manipulation-I-Short/
📌 Up Trend - Trade Stop Hunt (LQ Sweep) buy below the lows
– Highs are broken
– Lows are respected
– Liquidity below is being cleaned 📌 Down Trend - Trade Stop hunts (LQ Sweep) sell above the highs
– Lows are broken
– Highs are respected
– Liquidity above is being cleaned 🧪 Stop hunts are not random
• Quick wicks at range extremes are intentional.
• Trendline breaks often appear before reversals.
• Breakout traders provide liquidity.
• The move after the stop hunt is what matters.
1️⃣ EURUSD Short Click picture below to see how price action formed 👇https://www.tradingview.com/chart/EURUSD/vgXOeYfG-EURUSD-Daily-Range-LQ-taken-Rates-cut-was-priced-in/ 2️⃣ GBPUSD Short Click picture below to see how price action formed 👇https://www.tradingview.com/chart/GBPUSD/FKtc84k9-GBPUSD-Daily-CLS-Liqudity-taken-Model-1-Oposing-side-target/ 3️⃣ USDCHF Long Click picture below to see how price action formed 👇https://www.tradingview.com/chart/USDCHF/WrvLuU3j-USDCHF-Daily-CLS-Model-Long-from-KL-rates-cut-is-priced-in/ It's effective because it capitalizes on the retail traders classic mistakes- FOMO and trading break out of the highs and selling the lows. While market makers are doing the opposite (don't get me wrong, Im also retail trader and you are too) trading so called smart money concepts doesn't make us smart money traders.
🧪 How I use stop hunts
• I never enter at the first touch of a level.
• I wait for price to go through it.
• Only after the sweep do I look for entries.
• This gives better timing and tighter risk.
📌 Bearish Scenario - (LTF view) - price (yellow has structured movements and should be crating AMD profiles on the edge of the range. We need to drop to LTF to read the structure. 📌 Bullish Scenario ITF view - Price should not have candle close below the range on the same timeframe otherwise setup is invalidated and new range created. 🧪 Where liquidity sweeps matter most
• Range highs and lows
• Previous week high or low
• Clear swing extremes
• Higher-timeframe key levels
• Daily and weekly ranges 🧪 CLS strategy connection
• Liquidity sweep is the foundation of my CLS approach.
• Fake breakouts create urgency and FOMO.
• Late buyers and sellers get trapped.
• I trade against that behavior.
🧠 Having mechanical system with backtested data is your EDGE.
💪 That is what makes you DISCIPLINED TRADER.
📌 Bullish continuation setups
Model 1 - Entry after manipulation - 50% target
Model 2 - Entry on pullback on level between 61.8 - 80% pullback 📌 Bearish Continuation setups
Model 1 - Entry after manipulation - 50% target
Model 2 - Entry on pullback on level between 61.8 - 80% pullback 🧪 Manipulation phase
• No manipulation means no institutional move.
• Liquidity must be taken first.
• Big candles after sweeps signal readiness.
• That is where opportunity appears.
🧪 Basic CLS workflow
• Define higher-timeframe trend
• Define the range near a key level
• Wait for price to sweep the high or low
• No candle close outside the range on that timeframe
• Enter only after manipulation
📌 Bullish LTF Range within HTF Range
Analyze HTF range and define models, then drop it to your TF and trade your ranges with the HTF range. Always follow the same process only on the LTF - Lower timeframe. 📌 BearishLTF Range within HTF Range
Analyze HTF range and define models, then drop it to your TF and trade your ranges with the HTF range. Always follow the same process only on the LTF - Lower timeframe. 🧪 Why this approach fixes psychology
• Rules remove hesitation
• Backtesting builds confidence
• Losses become expected data points
• Overtrading naturally disappears
🧪 Brief note on SMT
• Sometimes price moves without LQ sweep its because of SMT
• In other words Sweep has happen on correlated pair so it doesn't have to happen on the we are looking for.
• If it’s not at a key level, I ignore it.
📌 SMT EURUSD and GBPUSD Example
GU - just shallow manipulation but creates clean OB
EU - Deeper manipulation but OB created later.
🧪 Final perspective
• Liquidity is sweep / Stop hunt / manipulation is happening ona key levels where mostly traders enters false break to the wrong side and those who has been right are now taken out.
📌 Example of manipulation
Less informed traders bought early and other group of Turtles selling the break out of the lows, they are wrong on the lows. Sellers were used as liqudity and buyers are now trapped in the long where price reverse against them.
I promised myself I’d become the person I once needed the most as a beginner. Below are links to a powerful lessons I shared on Tradingview. Hope it can help you avoid years of trial and error I went thru.
📊 Sharpen your trading Strategy
⚙️ 100% Mechanical System - Complete Strategy
🔁 Daily Bias – Continuation
🔄 Daily Bias – Reversal
🧱 Key Level – Order Block
📉 How to Buy Lows and Sell Highs
🎯 Dealing Range – Enter on pullbacks
💧 Liquidity – Basics to understand
🕒 Timeframe Alignments
🚫 Market Narratives – Avoid traps
🐢 Turtle Soup Master – High reward method
🧘 How to stop overcomplicating trading
🕰️ Day Trading Cheat Code – Sessions
🇬🇧 London Session Trading
🔍 SMT Divergence – Secret Smart Money signal
📐 Standard Deviations – Predict future targets
🎣 Stop Hunt Trading
🧠 Level Up your Mindset
🛕 Monk Mode – Transition from 9–5 to full-time trading
⚠️ Trading Enemies – Habits that destroy success
🔄 Trader’s Routine – Build discipline daily
💪 Get Funded - $20 000 Monthly Plan
🛡️ Risk Management
🏦 Risk Management for Prop Trading
📏 Risk in % or Fixed Position Size
🔐 Risk Per Trade – Keep consistency
Adapt what is useful. Reject what is not. Add something of your own.
David Perk aka Dave FX Hunter

Why We Should Plan Logical Stop-LossThis video explains why using a logical stop-loss is important in trading and how stop-loss placement should be based on market structure rather than emotions. The discussion focuses on understanding where price invalidates an idea, how illogical stop placement increases risk, and why logical stop-loss levels help

THE PSYCHOLOGY OF TRADING: WHY MOST TRADERS LOSE?You have probably heard that most people who attempt trading end up losing money. There’s a
good reason for this, and the reason is primarily that most people think about trading in the
wrong light.
Most people come into the markets with unrealistic expectations, such as thinking they are
going to quit their jobs after a month of trading or thinking they are going to turn $1,000 into
$100,000 in a few months. These unrealistic expectations work to foster an account-destroying
trading mindset because traders feel too much pressure or “need” to make money.
When you begin trading with this pressure, you inevitably end up trading emotionally—which is
the fastest way to lose your money.
To be specific, let’s break down the 4 Main Emotional Factors that destroy portfolios: FOMO,
Fear, Revenge, and Greed.
__________________________________________________________________________________
1. FOMO (Fear of Missing Out)
FOMO is an emotional state experienced by almost everyone. For traders, it is accelerated by
feelings of jealousy, envy, and impatience. The depth of these emotions is intensified by the
fast-acting environment of the Crypto and Forex markets.
How to Avoid FOMO:
● Develop a Routine: Trading is often a singular, lonesome pursuit. Eliminate distractions
and focus on identifying key market spots to tune out external chatter. Avoid social
media outlets and ungrateful attitudes.
● Be Present Minded, Future Thinking: Just because a trade is lost does not mean the
following transactions will follow suit. There are always more trading opportunities. Stay
present-minded yet have your scope set upon the future goals of your trading.
● Employ a Trading Plan: No plan is perfect, but a well-developed plan covers most
eventualities, helping you invest with lower risk exposure and more consistency.
Establish short-term, medium, and long-term trading goals.
● Take Joy from Trading: FOMO stems from insecurity and greed. Once a trader grasps
this truth, they can cast out this reckless state and trade with maximum potential.
__________________________________________________________________________________
2. GREED (The Account Destroyer)
There’s an old saying regarding markets: “Bulls make money, bears make money, and pigs
get slaughtered.”
This means if you are a "greedy pig" in the markets, you are almost certainly going to lose.
Greed acts as a trader’s kryptonite. When the desire for wealth clouds logic, traders make fatal
mistakes such as:
● Not taking profits because they think a trade will go on forever.
● Adding to a position simply because the market moved slightly in their favor (without
logical price action reasons).
● Using excessive leverage to maximize potential gains.
● Doubling down on losing trades (The Martingale Strategy).
Advice for Avoiding Greed:
Think of greed as the counterpart to discipline. Traders who are well-poised and consistent are
less likely to fall victim to greed. It is critical that every trader consistently follow trading plans;
otherwise, the likelihood of slipping into destructive habits is far greater.
__________________________________________________________________________________
3. FEAR
Fear often arises after a trader hits a series of losing trades or suffers a loss larger than what
they are emotionally capable of absorbing.
When fear takes over, you hesitate. You might see a perfect setup that aligns with your strategy, but you freeze because you are afraid of losing again. Or, you might cut a winning trade too early because you are terrified the market will turn against you. Fear paralyzes your ability to execute your edge.
__________________________________________________________________________________
4. REVENGE TRADING
Revenge trading is a natural emotional response when a trader suffers a significant loss. The
idea is to recover the money immediately. The thinking is: "If I put on another trade right now, I can win it back."
Usually, this "expected" winning trade turns into a losing trade—often bigger than the first one.
5 Effective Ways to Fight Revenge Trading:
1. Step Back Temporarily: Take a day or two off. If you must be in the markets, trade
incredibly small, but the best course is to walk away.
2. Make a Self-Assessment: Once you are emotion-free, analyze what led to the loss.
Was it a bad strategy, or bad execution?
3. Assess Market Conditions: Is the market too volatile? Are there no solid trends?
Sometimes the best trade is no trade.
4. Assess Your Strategy: Check your entry and exit criteria. Did you actually see a setup,
or did you force a trade out of anger?
5. Make Necessary Adjustments: Note the feedback, learn the lesson, and mentally
"throw" the bad trade away. Affirm to yourself: "That is how I will do it next time."
__________________________________________________________________________________
SUMMARY
Trading is simple, but it is not easy. The charts are the easy part; managing your own mind is
where the real work begins. Identify these four emotions— FOMO, Fear, Greed, and
Revenge —and suppress them the moment they arise.
Are you controlling your emotions, or are they controlling your portfolio? Let me know in
the comments below.
__________________________________________________________________________________
Disclaimer: This content is for educational purposes only. Trading involves significant risk.

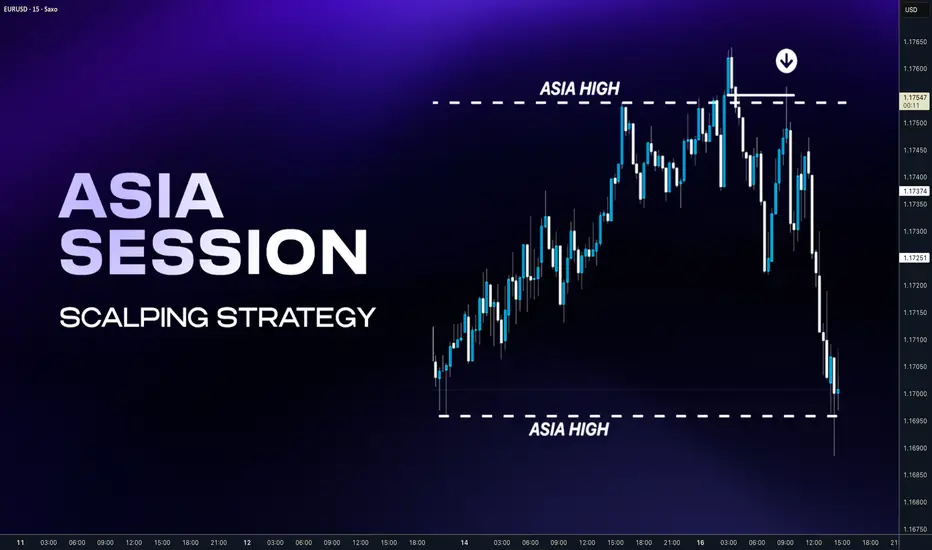
Understand Asia Session & Conquer London SetupsAsia is the “setup session.” Price often builds a tight box, prints equal highs and lows, and leaves obvious resting liquidity. London loves to raid that liquidity because it’s easy fuel. But before we go to the concept of how to trade it's also good to know why it is created. We already know that FX markets are controlled by CLS Market maker. Do we know it 100% ? No, but they trade almost 7 Trillion daily volume which is almost entire daily FX volume. This company is aggregator the many other bigger ones, they are collecting the orders during the the Asia and processes continuous settlement, during the next day the liquidity is found on the markets. (Im not promoting or something like that, this is institutional player which 99.9% of use here will not have access) Thats where they destroy most less informed traders, not purposely but their work is so effective that small % of traders succeed in this game.
🧩 Simplicity of the concept
You don't trade in the Asia session, Let Asia build the trap , Let price raid one side. Wait for proof it’s done raiding Enter on the retrace, not in the raid and trade contininuation during the London. In the scalping version . You can trader just one side of Asia range to the other side. This requires precisions on lower timeframes. Im planning to explain this later in the next post. For now let's do continuation setups during the London Session.
📌 Asian Session
Low volatility & accumulation phase — the market usually consolidates inside a tight range after the previous New York close. If the Asia session is trending, London will be continuation setup.
📌 London Session
The highest-probability setups often occur during this session.
If Asia was tight range, London usually manipulates the Asian range sweeping stops above or below then reverses and starts the true daily move. London will be Reversal setup. Often sets the daily high or low of the day
❌ Don't overthink it you need to understand HTF Bias
I you dont have HTF Bias your win ration will decrease, you will be frustrated and than you will typically jump to another strategy, like you did it already many times.
⁉️ Always start with question - Where is the liquidity
Always follow the Daily / Weekly candle close. Yes Daily and Weekly !! Even when you are trading intraday. You intraday trades must be within HTF flow. IT means you will not have a trade every day if you want hight win rate. You must be patient.
📈 Continuation
If todays daily candle closed above previous days high and its still not reaching the key level, then liquidity is above todays high. Why ? Because people have intentions to sell highs to early, so and price will most likely go there. So we are bullish. Bullish Close 📈 Reversal
If todays candle wicked above previous day high, but closed below , then we can expect liquidity is below Previous days low. Why? Because mostl likely traders entered fake high break out they put SL below days low. It's signs of reversal. Yes that simple it is. For more details scroll down and find my posts about Daily Bias.
🧩 4 X Potential Frameworks
If you drill what I will show you bellow you will see it on the charts happening at least 2 times a week. If you apply this to the 3 pairs. You got 6 high probability setups . Add patience and risk management = You will conquer the forex trading
🧪 London Continuation Bearish setup
•Narrative: Asia did the manipulation → London does the continuation.
• Asia session already made a manipulation into a key level
• Price displaced away from that level
• CIOD / OB on M15 or H1 before London open • H1: Asia runs above the stops above H1 high into a key level
• It gets rejected and followed by order block and displacement
• At London open, price retraces into M15 premium key level and continues in the same direction
❌Invalidation: the manipulation high/low from Asia session
🧪 London Continuation Bullish setup
• Narrative: Asia did the manipulation → London does the continuation.
• Asia session already made a manipulation into a key level
• Price displaced away from that level
• CIOD / OB on M15 or H1 before London open • H1: Asia runs bellow the stops above H1 high into a key level
• It gets rejected and followed by order block and displacement
• At London open, price retraces into M15 discount key level and continues in the same direction
❌Invalidation: the manipulation high/low from Asia session
🧪 London Reversal Bearish setup
• Narrative: London performs the manipulation → price reverses.
• Asia session consolidates near a higher timeframe key level
• London open initiates the manipulation into the key level
• Price reject at the key level and created M15 order block • H1: Asia consolidates Bellow Key Level
• London opens, price runs Asia high into that Key Level
• M15 breaks down → Change in order flow → clean short setup
• Target: higher timeframe draw on liquidity (e.g., previous day low)
❌Invalidation: the London session high (manipulation point)
🧪 London Reversal Bullish setup
• Narrative: London performs the manipulation → price reverses.
• Asia session consolidates near a higher timeframe key level
• London open initiates the manipulation into the key level
• Price reject at the key level and created M15 order block • H1: Asia consolidates above the Key Level
• London opens, price runs Asia high into that Key Level
• M15 breaks up → Change in order flow → clean short setup
• Target: higher timeframe draw on liquidity (e.g., previous day low)
❌Invalidation: the London session low (manipulation point)
‼️ In trading, you make most money by making precisely best decisions and controlling your risk. Hence understanding the different probabilistic scenarios we can start focusing on quality over quantity by avoiding lower probability conditions. The aim is to improve our decision making process by knowing when it's better to trade and when not.
❌ Low Probability London Session Conditions
• After a series of 3 consecutive bullish daily candles - Avoid Longs.
• After a series of 3 consecutive bearish daily candles - Avoid Shorts.
• After FOMC event that produces an extreme range.
• Ahead of NFP and CPI data release
• Multiple high and medium impact news events.
• The Asian Range is has been trending and is larger than 40 pips.
• If the Asian Range is not visually consolidating.
• Absence of a candle range
✅ High Probability London Session Conditions
• The market has recently reacted off of Daily /H4 key level
• The Asian Range is visually a consolidating and smaller than 40 pips.
• Presence of a clean visual candle range
• Presence of a higher timeframe key level.
• Clean higher timeframe draw on liquidity.
✅ High Probability Intraday Setups
The highest importance is placed on the H TF Daily or 4h direction:
• Clean orderflow.
• Clean higher timeframe draw on liquidity and directional bias.
• Strong price based narrative.
• Strong time based narrative.
• 4h candle range
• 4h Key level.
• Key time
❌ Common mistakes (quick and painful)
Trading every day, even when Asia is messy and wide
Entering during the sweep instead of after displacement
Stop too tight inside noise instead of beyond the actual swept point
Ignoring higher timeframe bias and wondering why London runs you over
Not journaling screenshots of the sweep + confirmation + entry (then you “feel” like it works, but you don’t know)
---------------------------
I promised myself I’d become the person I once needed the most as a beginner. Below are links to a powerful lessons I shared on Tradingview. Hope it can help you avoid years of trial and error I went thru.
📊 Sharpen your trading Strategy
⚙️ 100% Mechanical System - Complete Strategy
🔁 Daily Bias – Continuation
🔄 Daily Bias – Reversal
🧱 Key Level – Order Block
📉 How to Buy Lows and Sell Highs
🎯 Dealing Range – Enter on pullbacks
💧 Liquidity – Basics to understand
🕒 Timeframe Alignments
🚫 Market Narratives – Avoid traps
🐢 Turtle Soup Master – High reward method
🧘 How to stop overcomplicating trading
🕰️ Day Trading Cheat Code – Sessions
🇬🇧 London Session Trading
🔍 SMT Divergence – Secret Smart Money signal
📐 Standard Deviations – Predict future targets
🎣 Stop Hunt Trading
🧠 Level Up your Mindset
🛕 Monk Mode – Transition from 9–5 to full-time trading
⚠️ Trading Enemies – Habits that destroy success
🔄 Trader’s Routine – Build discipline daily
💪 Get Funded - $20 000 Monthly Plan
🧪 Winning Trading Plan
🛡️ Risk Management
🏦 Risk Management for Prop Trading
📏 Risk in % or Fixed Position Size
🔐 Risk Per Trade – Keep consistency
Never stop learning
David Perk aka Dave FX Hunter ⚔️
When to Trade — When to Stay OutHi everyone,
In the way I approach the market, I don’t see trading as a reflexive reaction to price movements. I see it as a structured decision-making process , built on clearly defined conditions. The market is active all the time, but constant activity alone does not create tradable opportunities. Acting without clear conditions means confusing movement with real advantage.
That’s why every decision starts with an analysis of the broader context . I only consider getting involved when the market structure is coherent, price dynamics are readable, and the environment allows for a clear assessment of risk. When the market becomes unstable, fragmented, or dominated by noise, every attempt to enter inevitably weakens decision quality. In those moments, staying out of the market is not passivity—it’s a rational act of protection .
Once the context is validated, my absolute priority becomes risk management . Before evaluating any potential reward, I need to know exactly where my scenario is invalidated. Without that information, no trade can be justified. A stop-loss is not an emotional safety net; it’s a fundamental part of decision logic. When risk is clearly defined and limited, the outcome of a trade becomes a matter of probabilities, not hope.
Even so, in a technically favorable environment, a decision remains fragile if it’s made in an unhealthy mental state . The market doesn’t punish analysis mistakes as much as it punishes execution errors driven by emotion. Any decision influenced by urgency, fear of missing out, or the desire to recover a previous loss immediately breaks the integrity of the process. In those conditions, not trading is the only decision aligned with discipline .
This is exactly why I consider the ability not to intervene a core skill. Most of the time, the market does not offer a structure with a clear edge. Being constantly in a position is neither an obligation nor a goal. Preserving capital, maintaining mental clarity, and protecting decision discipline are prerequisites for sustainable performance.
In conclusion , knowing when to trade and when to stay out is not a technical issue—it’s a mindset. When action is limited to genuinely favorable contexts and inaction is fully accepted as a strategic choice, trading stops being a chase for short-term results and becomes a controlled risk-management process . At that point, long-term performance is neither accidental nor emotional—it’s built on logic.
Wishing you profitable and disciplined trading.

Mistakes I am Making In Implementing My Own Forex Trading PlanI know that we all want to see material of Forex Trading plans that actually work and bring in profit. We don't want to waste our time with what doesn't work.
Still, in this video I am talking about my lack of discipline in applying my own Forex trading plan which made me lose focus and get into a losing streak.
My Win/Loss ratio is still better, my balance is still above its initial amount, but to me all that is not important. Many people are result oriented, I am not. I am process oriented.
I need to trust my process. If I think that I have a solid Forex trading plan then I should follow it. If I am making changing to it then the plan needs changing.
My next steps are as follows:
1) Stop trading the Demo account and use the Replay Feature of TradingView to get more experience in implementing my own plan. With this action point, I will also discover if the current plan is profitable or if it needs changes.
2) Back to Education: I found a new Forex Educational Resource that I want to check out, and see if there is anything of that value there. This resource seems to be going deeper into SMC and teaches advanced areas to better understand liquidity.
I hope this video is helpful and a good reminder of the importance of discipline in Forex trading.

MASTERING RISK MANAGEMENT: THE SURVIVAL SYSTEM FOR TRADERSRisk management is not just a safety net; it is the specific system used to control losses and protect your trading capital. Without a strict risk plan, even a highly profitable strategy will eventually fail. A few bad trades should never have the power to wipe out your account.
WHY IT IS CRUCIAL
Markets are inherently unpredictable. No matter how good the analysis is, probabilities dictate that losses will occur. Risk management:
1. Protects against emotional trading (fear and greed).
2. Ensures long-term survival so you can stay in the game long enough to be profitable.
3. Stabilizes your equity curve, avoiding massive drawdowns.
OUR CORE RISK RULES
1. PER TRADE RISK LIMIT
Never risk more than 0.7% to 2% of your total account balance on a single trade. This ensures that a losing streak does not destroy your capital.
Example:
If you have a $10,000 account, your maximum risk per trade should be between $70 and $200.
2. DAILY LOSS LIMIT
Do not open too many positions simultaneously. You must have a hard stop for the day. Your total daily loss limit should be a maximum of 15% of your portfolio. If you hit this limit, stop trading immediately for the day to prevent emotional revenge trading.
KEY TOOLS FOR RISK CONTROL
Use a Risk Calculator to automate your position sizing. Do not guess your lot size.
Stop Loss (SL): An order that automatically exits a losing trade at a specific price. This is your insurance policy. Never trade without it.
Take Profit (TP): An order that locks in gains at predefined levels.
Risk-to-Reward Ratio (RRR):
Always aim for 1:2 or better. This means if you are risking 50 pips/5%, your target should be at least 100 pips/10%. With a 1:2 ratio, you can be wrong 50% of the time and still be profitable.
ADVANCED TACTIC: MOVING STOP-LOSS TO ENTRY (BREAK-EVEN)
Moving the Stop-Loss to the Entry price is a technique used to eliminate risk exposure in an active trade. It involves adjusting your stop loss level to the exact price where you entered the market.
Why do this?
If the trade reverses against you after moving to entry, you lose $0. You have eliminated the risk while keeping the potential for profit open.
ADVANCED TACTIC: CLOSING PART OF A TRADE (PARTIALS)
You do not have to close 100% of a trade at once. Closing a portion (partial closing) is vital for managing psychology and banking revenue.
By taking profits on 50% or 75% of a position, you lock in gains immediately. You can then leave the remaining portion of the trade running to catch a larger trend with zero stress, as you have already banked profit.
COMING UP NEXT
In the next article, we will be diving into Types of Traders & Their Risk Management Styles
Disclaimer: This content is for educational purposes only and does not constitute financial advice. Trading involves significant risk.
- Tuffy (Team Mubite)
#RiskManagement #CapitalProtection #TradingSurvival #RiskReward

5 Must-Know Tips for Trading Gold. XAUUSD Must Know Secrets
After more than 9 years of Gold trading, I decided to reveal 5 essential trading tips , that will save you a lot of money, time and effort.
Of course, these trading recommendations won't make you rich, but they will certainly help you to avoid a lot of losing trades.
Whether you are new to Gold trading or an experienced trader, these insights will dramatically improve your trading.
Don't trade gold with a small account
I always repeat to my students that in gold trading, the risk per trade should not exceed 1% of a trading account.
It means that if your trades close with stop loss, you should lose maximum 1% of your deposit.
For the majority of the day trading and swing strategies, you will require at least 2000$ deposit to risk 1% per trade. Trading with a smaller account size, it will be challenging to follow this risk management principle of not exceeding 1%
Here is a day trade on Gold.
With a stop loss of 619 pips and a trading account of 10000$,
a lot size for this trade will be 0.02.
If the trade closes on stop loss, total risk will be 100$ or 1% of a trading account.
With a 100$ account, trading with a minimal lot 0.01, your potential risk will be 50$ or half of your trading account.
Check spreads
Spread may dramatically fluctuate on Gold.
High spreads can make it difficult for day traders to catch small price movements, reducing the profit potential of their trades.
Wide spreads can lead to slippage , where day traders may end up buying at a higher price and selling at a lower price than expected, increasing the risk of losses.
Gold has the lowest spreads during London and New York sessions,
while trading the Asian session is not recommended.
Personally, I don't trade Gold if the spread exceeds 100 pips.
In the picture above, you can see a current spread on Gold.
It is 30 pips. It is a relatively low spread, so we can trade.
Don't trade on US holidays
When US banks are closed, liquidity drops substantially on Gold.
It leads to increased spreads and higher probabilities of manipulations,
reduced volatility and very slow market.
For that reason, it is better not to trade Gold during US holidays.
You can easily find the calendar of US banking holidays on Google.
Simply take a break during these trading days.
Don't trade ahead of important US news
US news may dramatically affect Gold prices.
Such events as FOMC or FED Interest rate decision may trigger a high volatility and very impulsive movements.
My recommendations to you is to stay away from trading Gold one hour ahead of the important news releases.
You can find important US news in the economic calendar .
Just sort out the calendar in a way that it would display only significant news and pay attention to them.
Above, you can see the important US news for the coming days in the economic calendar.
Do not open multiple orders
Here is what many Gold traders do wrong:
once they place an order, instead of patiently waiting for a stop loss or take profit being reached, they start opening more orders.
Please, open one single trade per your prediction.
Open a new trade if only you see a new trading setup or your initial trade is already risk-free with a stop loss move to entry level.
Here is the example, a newbie trader decides to buy Gold and opens a long positions.
The market moves in the projected direction, and a trader opens one more trade.
The one can open even dozens of positions like that.
However, the problem is that the market can always suddenly reverse and all these trades will be closed in a loss.
It can lead to a substantial account drawdown.
Open a one single trading position instead.
I truly believe that these trading tips will help you improve your gold trading. Carefully embed these rules in your trading plan and watch how your trading performance improves.
❤️Please, support my work with like, thank you!❤️
I am part of Trade Nation's Influencer program and receive a monthly fee for using their TradingView charts in my analysis.

How Investment Funds Really Make Money From Bitcoin📰 After years of closely following financial markets, one conclusion has become impossible for me to ignore:
most people fundamentally misunderstand how professional funds make money from Bitcoin.
Retail traders often assume funds operate the same way they do — buying low, selling high, and betting on direction.
If price goes up, they win.
If price goes down, they lose.
That assumption is overly simplistic — and largely incorrect.
🔍 For institutional funds, Bitcoin is not a directional gamble.
From what I’ve observed, large funds are not emotionally attached to whether Bitcoin rises tomorrow or drops next week.
Price direction is not their primary concern.
What truly matters is structure.
Funds are not rewarded for guessing the market correctly.
They are rewarded for controlling risk and systematically converting volatility into measurable returns.
🎯 Their real objective is volatility, not conviction.
When a fund allocates capital to Bitcoin, it is rarely driven by belief in a narrative or excitement around headlines.
They don’t follow influencers.
They don’t react to social media hype.
What they care about is quantifiable price movement.
Volatility is the raw input.
Mathematical models are the engine.
Decisions are driven by numbers, not emotions.
🧠 Buying Bitcoin does not automatically mean being bullish.
One of the most common misconceptions I encounter is the idea that institutional buying signals an expectation of higher prices.
In reality, a fund can purchase Bitcoin while remaining entirely neutral.
They can be delta-neutral, fully hedged, detached from market direction, and protected against both upside and downside moves.
This is why buying BTC is not a bet for them.
It is simply the first layer in a multi-stage trading structure.
📊 So how do funds actually profit from price movement?
By combining spot exposure with derivatives, funds build positions that benefit from movement itself rather than predicting direction.
When price rises, positions are adjusted and partial exposure is sold at higher levels to rebalance risk and lock in gains.
When price falls, exposure is rebuilt at lower prices to restore balance.
🔁 Price moves higher → exposure is reduced at better levels
🔁 Price moves lower → exposure is increased at cheaper levels
🔁 The process repeats with discipline and precision, free from emotion
This systematic process is known as gamma scalping — the quiet, continuous profit mechanism behind institutional trading.
💰 Where do their real profits come from?
Not from news headlines.
Not from influencers.
Not from ETF narratives.
Profits are generated through continuous hedge adjustments, realized volatility exceeding expectations, direction-neutral structures, and strict mathematical discipline.
⛔ The only environment that truly challenges these strategies is when the market stops moving altogether.
🧭 Let me be direct with you, speaking as a market professional.
You are not BlackRock.
You do not have their infrastructure.
You do not have their capital, execution speed, or risk frameworks.
Attempting to interpret or replicate their actions without understanding the underlying structure will not improve your trading — it will only increase confusion.
✍️ My conclusion is straightforward:
Funds do not profit from predicting the future.
They profit from engineering outcomes.
They do not trade stories.
They do not trade emotions.
They do not trade social media noise.
🎯 They trade structure.
And you?
Stop obsessing over what institutions are doing.
Start focusing on what you should be doing.
That is the line between surviving in the market
and being quietly pushed out of it.

How Funds Actually Make Money From BitcoinIf you spend more than five minutes on Crypto TikTok (YouTube or X are not much different), you’d think the entire market depends on:
- who “bought the dip,”
- who “sold the top,”
- and which whale “decided” to pump or dump.
The screamers with flashy thumbnails and zero understanding yell:
- “BlackRock is buying—BULLISH!”
- “Whales are selling—CRASH INCOMING!”
- “Institutions are entering the market!!!”
- No nuance.
- No structure.
- No clue.
Because here’s the truth:
What BlackRock buys or sells is almost irrelevant to you.
Funds do not make money the way TikTok believes.
They don’t need Bitcoin to go up.
They don’t need Bitcoin to go down.
They need one thing:
Movement. Volatility. Math.
Let’s destroy the hype and show how funds actually make money.
1. Why “BlackRock is buying BTC” tells you absolutely nothing
Retail sees a headline:
“ETF inflows: +5,000 BTC today!”
And jumps to conclusions:
“They know something!”
“Price HAS to go up!”
“Institutions are bullish!”
No.
A fund can buy BTC and still be:
- 100% hedged
- delta-neutral
- directionally flat
- risk-neutral
- fully protected against price movement
The purchase is not a bet.
It’s a component of a structured position.
Buying BTC is just Step 1.
What matters is Step 2, 3, 4, 5…—all the parts TikTok doesn’t even know exist.
2. Why TikTok “analysts” have no idea what they’re talking about
If someone:
- screams in every video,
- says “bullish” or “bearish” 40 times a minute,
- thinks “institutions pump price,”
- doesn’t know what delta, gamma, basis, hedging, ATM straddles are…
…then they are not explaining institutional flow.
They are farming views and likes, not teaching markets.
Let’s be blunt:
If you can’t explain a delta-neutral hedge, your opinion about what BlackRock “plans to do” or "is doing" is worthless.
So let’s walk through how a real fund uses BTC to print money without caring if price goes up or down.
3. How a real fund makes money from volatility (step-by-step, using $100,000 BTC)
Assume:
- BTC price = $100,000
- A fund wants exposure to volatility, not direction
- They buy a BTC ATM straddle (call + put at 100k)
- Delta ≈ 0
- Gamma > 0 → the part that generates money
- They also own BTC spot for hedging.
- Let’s say the fund holds 1 BTC worth $100,000 as inventory for hedge adjustments.
At the start:
Delta-neutral. No directional risk.
Now let’s see how they profit.
Step 2 – BTC goes up 10% → $110,000
Straddle delta becomes +0.5 BTC.
The fund is unintentionally long 0.5 BTC.
To go back to neutral:
The fund sells 0.5 BTC at $110,000.
Cash received:
0.5 × 110,000 = $55,000
Theoretical cost basis (100k):
0.5 × 100,000 = $50,000
👉 Profit from hedge = $55,000 – $50,000 = $5,000
Plus, the straddle increased in value due to volatility.
Step 3 – BTC drops 10% → $90,000
Now straddle delta flips negative: –0.5 BTC
To get back to neutral:
The fund buys 0.5 BTC at $90,000.
Cash paid:
0.5 × 90,000 = $45,000
If they later sell that BTC at the baseline of 100k:
👉 Profit = $50,000 – $45,000 = $5,000
Again, without needing BTC to go up or down, “as predicted.”
This is called:
Gamma scalping — the quiet, relentless engine behind institutional P&L.
Up move → sell high.
Down move → buy low.
Repeat. Print. Sleep.
4. Where does the REAL profit come from?
A fund earns from:
- hedge adjustments (buy low, sell high, but mathematically—not emotionally)
- straddle appreciation as realized volatility exceeds implied volatility
- basis differences between spot and futures
- neutrality to direction, allowing consistent compounding
They make money even if Bitcoin swings between 95k–105k for weeks.
The only time they lose?
When BTC does NOT move.
Because then the straddle premium decays.
That's it.
Nothing to do with faith, predictions, narratives, influencers, or ETF flows.
5. So why should YOU ignore what BlackRock is doing?
Because:
- You are not BlackRock.
- You do not run a delta-neutral book.
- You do not make money from gamma exposure.
- You do not scalp intraday hedges on $100M positions.
- You do not capture basis spreads across spot and derivatives.
- You do not have a trading desk rebalancing risk every hour.
But the TikTok screamers will still tell you:
“Institutional buying = bullish!”
“Institutional selling = bearish!”
“Whales know something!”
They don’t know anything.
Especially not about institutional structure.
So here’s the punchline:
Watching what funds do—without understanding why they do it—is the fastest path to confusion in the best case and destruction in the worst.
You don’t have their:
- tools,
- capital,
- execution speed,
- risk models,
- mandate,
- or mathematical framework.
So trying to mimic them is not just pointless —it’s dangerous.
Final Lesson: Ignore the noise, ignore the hype, ignore the TikTok parade.
BlackRock doesn’t care about bull markets or bear markets.
BlackRock doesn’t need Bitcoin to moon.
BlackRock doesn’t panic when Bitcoin drops.
Because BlackRock doesn’t trade the story.
They trade the structure.
And unless you operate like a fund — stop pretending their moves matter to your trading.
You’re not them.
You don’t have their machinery.
You don’t have their volatility book.
So:
Stop watching what institutions do.
Start understanding what you should do.
That’s the difference between surviving and blowing up.
P.S: BlackRock and TikTok are used just as an example:)

Top-5 tips for Top-Down Multiple Time Frame Analysis Trading
I am trading multiple time frame analysis for many years. After reviewing trading ideas from various traders on Tradingview, I noticed that many traders are applying that incorrectly
In this article, I will share with you 5 essential tips , that will help you improve your multiple time frame analysis and top-down trading.
The Order of Analysis Matters
Multiple time frame analysis is also called top-down analysis for a reason. When you trade with that, you should strictly start your analysis with higher time frames and then dive lower, investigating shorter-term time frames.
Unfortunately, most of the traders do the opposite . They start from a lower time frame and finish on a higher one.
Above are 3 time frames of EURGBP pair: daily, 4h, 1h.
To execute multiple time frames analysis properly, start with a daily, then check a 4h and only then the hourly time frame.
Limit the Number of Time Frames
Executing multiple time frame analysis, many traders analyse a lot of time frames.
They may start from a weekly and finish on 5 minute time frame, going through 5-8 time frames.
Remember that is it completely wrong . For execution of a multiple time frame analysis, it is more than enough to analyse 3 or even 2 time frames. Adding more time frames will overwhelm your analysis and make it too complex.
Analyse Particular Time Frames
Your multiple time frame analysis should be consistent and rule-based. It means that you should strictly define the time frames that you analyse.
For example, for day trading, my main trading time frames are daily, 4h, 1h. I consistently analyse ONLY these trading time frames and I look for day trades only analysing this combination of time frames.
Higher is the time frame, stronger the signal it provides
Trading with multiple time frame analysis, very often you will encounter controversial signals: you may see a very bullish pattern on a daily and a very bearish confirmation on 30 minutes time frame.
Always remember that the higher time frames confirmations are always stronger , and their accuracy and probability is always higher.
Above there are 2 patterns:
a head and shoulders pattern on a daily time frame with a confirmed neckline breakout, and an inverted head and shoulders pattern on a 4h time frame with a confirmed neckline breakout.
2 patterns give 2 controversial signals:
the pattern on a daily is very bullish and the pattern on a 4h is very bearish.
The signal on a daily time frame will be always stronger ,
so it is reasonable to be on a bearish side here.
You can see that the price dropped after a retest of a neckline of a head and shoulders on a daily, completely neglecting a bullish pattern on a 4H.
Each Time Frame Should Have Its Purpose
You should analyse any particular time frame for a reason.
You should know exactly what you are looking for there and what is the purpose of your analysis.
For example, for day trading, I analyse 3 time frames.
On a daily, I analyse the market trend and key levels.
On a 4H time frame, I analyse candlesticks.
On an hourly time frame, I look for a price action pattern as a confirmation.
On GBPAUD on a daily, I see a test of a key horizontal resistance.
On a 4H time frame, the price formed a doji candle.
On an hourly, I spotted a double top, giving me a bearish confirmation.
These trading tips will increase the accuracy of your multiple time frame analysis. Study them carefully and adopt them in your trading.
❤️Please, support my work with like, thank you!❤️
I am part of Trade Nation's Influencer program and receive a monthly fee for using their TradingView charts in my analysis.
Trading Plan - What should be included and how to improve it. I have been failing same like many traders are failing these days for same reason. Not having a plan and clearly defined when to trade , when not to trade and didn't have set barriers when to stop. Always wanted to make more. Yes it sounds boring and restrictive. But you will either lean on plan or on impulses.
Everything start with visualization of how your trade setup should looks like. You should know what exactly you are looking for and describe it as much as possible for example:
🧩 Basic Concept
Im looking for the fake break out of the range. Whether we call it manipulation or Stop hunt. It really doesn't matter. The idea is that once big candle is created it creates fomo and break out traders are entering continuation. I trade against them.
📍 Bullish continuation setups
Model 1 - Entry after manipulation - 50% target
Model 2 - Entry on pullback on level between 61.8 - 80% 📍 Bearish Continuation setups
Model 1 - Entry after manipulation - 50% target
Model 2 - Entry on pullback on level between 61.8 - 80% pullback This is your strategy, your pattern you are looking for in the specific situations and market conditions.
📍 Trading plan
is how, when and where , you are going to execute it. It's also good to describe your step by step process, so you remind it to yourself. I suggest to read it before every trading session. Especially beginners or if you adopted a new strategy. Describe every trade element as much as possible. With experiences you will be improving and shaping it. It has to be as simple as possible. 📍 Trading Pairs - If you are day trader / Intra week trader focus on 8 pairs maximum, You dont need more - DXY, EUR, GBP, CHF, BTC, ETH, SOL, XAU
📍 Market Bias - Describe how you analyze your Bias - Trend
Do you have HTF Trend / Liquidity ?
Internal LQ - Discount / Premium
External LQ - Significant HL taken
Monday, Friday, Weekly CLS Range
Key Level ? - If NO - NO trade
Liquidity Sweep + SMT
CIOD - Close - Model 1- 50% TP
📍 Down Trend - Trade Stop hunts above the highs
📍Up Trend - Trade Stop Hunt below the lows 📍 TF Alignment CLS Range + Entry - Structure of my Top Down analysis
Weekly / Daily Range - CLS Range
H4 / H1 / M30 / M15 - Entries
Don't overcomplicate it this works 📍 Setup Qualifications - If one of criteria is not met = No trade
High volatility Stop hunt
Stop run out of CLS range - 0.15%
Rejection from Key Level
CIOD on the LTF Model 1
Correct times - NY, LO , PM Sessions
📍 Entry Model 1
CIOD - the next candle below / above open
if the engulfing candle is too big, wait for a pullback
If range is too big take TP at 50%
Look for correlated pairs
If within HTF trend, target full range.
📍Bullish Scenario LTF Change in order flow is important aspect of the trade if you dont wait patiently for the candle close on the right timeframe, setup is invalid. 📍Bearish Scenario
as you can see price action never looks completely same you need to practice your eyes to see it, profiles, levels and what is happening on the edge of the range. Another and not less important part is knowing when not to trade. Also Im not perfect and even I have quite good plan sometimes I dont follow so reminding these mistakes and reading them in my trading plan is great way to eliminating them next time.
🧪 Low Probability Conditions
Day and Day before NPF, FOMC or CPI
Last and First day of a New Month
Dont buy or sell in the direction of overextended markets
An HTF objective has been met
Price tripped between two Key Levels
🧪 Don't trade IF
- Equal highs / Lows around your SL
- If stop run is to shallow
- Candle didn't closed yet
- If you didn't catch the initial move - don't fomo
- No room for at least 2RR
🧪 Recent Mistakes
- Trading within wrong market conditions
- Entering before CIOD confirmed
- Shallow manipulations
- Now waiting for the PWL / PDL Work on constant improvement, not by adding indicators or by looking for new strategy, commit to the one and master it . 1 Kick - 10 000 times
⁉️ This is questions Im asking myself when going thru past trades. It will help you improve as a trader and shape your trading plan.
- Was there a type of trade that did/didn’t work well?
- Was there a particular market that I did/didn’t trade well?
- Was there a particular day/time that I did/didn’t trade well?
- Did I enter trades too soon?
- Did I enter trades too late?
- Did I take profits too soon?
- Did I take profits too late?
- Did I put my stops loss too tight?
- Did I use an unnecessarily big stop loss?
- Did I take take any trades with poor Risk:Reward ratio?
- Did I risk too much?
- Did I risk too little?
- Did I deviate from my trading model?
- Did I deviate from my plan?
I promised myself I’d become the person I once needed the most as a beginner. Below are links to a powerful lessons I shared on Tradingview. Hope it can help you avoid years of trial and error I went thru.
📊 Sharpen your trading Strategy
⚙️ 100% Mechanical System - Complete Strategy
🔁 Daily Bias – Continuation
🔄 Daily Bias – Reversal
🧱 Key Level – Order Block
📉 How to Buy Lows and Sell Highs
🎯 Dealing Range – Enter on pullbacks
💧 Liquidity – Basics to understand
🕒 Timeframe Alignments
🚫 Market Narratives – Avoid traps
🐢 Turtle Soup Master – High reward method
🧘 How to stop overcomplicating trading
🕰️ Day Trading Cheat Code – Sessions
🇬🇧 London Session Trading
🔍 SMT Divergence – Secret Smart Money signal
📐 Standard Deviations – Predict future targets
🎣 Stop Hunt Trading
🧠 Level Up your Mindset
🛕 Monk Mode – Transition from 9–5 to full-time trading
⚠️ Trading Enemies – Habits that destroy success
🔄 Trader’s Routine – Build discipline daily
💪 Get Funded - $20 000 Monthly Plan
🛡️ Risk Management
🏦 Risk Management for Prop Trading
📏 Risk in % or Fixed Position Size
🔐 Risk Per Trade – Keep consistency
David Perk aka Dave FX Hunter ⚔️
All you need to know: WHEN and WHERE (short giude)Most traders lose money not because they’re wrong about direction… but because they’re wrong about WHEN and WHERE direction actually matters.
This is the missing piece in 99% of trading strategies.
Let’s break it down simply and clearly.
1. WHERE Matters First: Price Location Defines the Entire Trade
The market is not equally important at all prices.
There are only a few places where decisions actually have consequences:
🔹 1. Major Higher-Timeframe Levels
- Daily, Weekly and even monthly support, resistance, supply, demand.
- This is where big players care.
- Most BIG moves begin here.
🔹 2. Volatility Compression Zones
- Tight ranges, triangles, squeezes, etc
- When volatility compresses, potential energy builds.
- Breakouts here actually matter.
🔹 3. Break-and-Retest Structures
- The retest is where confirmation happens.
- It’s where weak hands exit and smart money enters.
🔹 4. Trend Extremes / Overextensions
- Parabolic rallies, vertical drops, stretched momentum.
- These locations create the most powerful reversals.
🔹 5. Liquidity Pools
- Above swing highs, below swing lows, around obvious trendlines.
- Institutions hunt these levels before moving the market.
If you’re not trading at one of these five locations, you are trading noise.
2. WHEN Matters Even More: Timing Is the Difference Between Chop and Trend
Even the best location is useless if the moment isn’t right.
Here are the only timing conditions that give your trade real probability:
🔸 1. Volatility Expansion After Compression
- Wait for candles to elongate, volume to increase, and the range to open up.
- Before expansion: fakeouts.
- After expansion: real moves.
🔸 2. Liquidity Sweeps
- The market clears stops → fills institutional orders → reveals true direction.
- You don’t act before the sweep; you act after it confirms.
🔸 3. Structural Confirmation
- Higher low in an uptrend.
- Lower high in a downtrend.
- Break → Retest → Continuation.
- Without structure, timing is random.
🔸 4. Active Market Sessions
- London open, NY open, session overlaps, major news events.
- The same setup at 03:00 means nothing — the same setup at NY open is a trade.
🔸 5. Multi-Timeframe Momentum Alignment
- HTF gives the bias
- MTF gives the setup
- LTF gives the entry
- When timeframes align, timing becomes obvious.
3. WHERE + WHEN = Non-Random Trades
This is what professional trading really is:
- WHERE = the place price must react
- WHEN = the moment price has conviction
Combine both and you no longer predict — you simply respond to high-probability situations.
- This is how you avoid chop.
- This is how you avoid forcing trades.
- This is how you become consistent.
4. The Psychological Shift
Retail traders think:
“I must forecast the next move.”
Professionals think:
“I only act at key locations, when timing conditions align.”
This removes:
- FOMO
- guessing
- impulsive entries
- emotional trading
You no longer chase the market.
You wait for the market to come to your WHERE and your WHEN.
That’s the edge.
5. Final Thoughts
You don’t need to predict the market.
You don’t even need to know what happens next.
You only need to know:
- WHERE the market becomes important
- WHEN a move becomes meaningful
Master these two, and everything else falls into place.
P.S.
I know this is easier said than done. Even after many years in the market, with a solid sense of direction and plenty of sniper-level entries, my WHEN is not always perfect either. That’s the part none of us ever truly “master” — we only learn to manage it better.
So take all of this as a blueprint, not a declaration that I execute flawlessly. I’m a professional, yes — but I’m also in a continuous process of adapting, refining, and learning from every new shift the market throws at us.
Experience helps, but the market keeps evolving, and so do I. Just like anyone else should.
