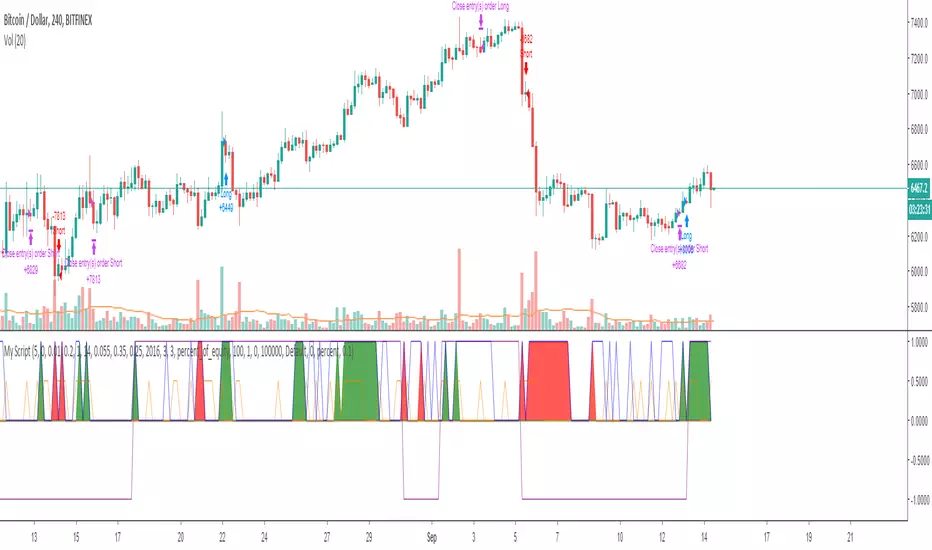
Acceleration / deceleration strategy As promised, the updated acceleration / deceleration strategy.
Added switchable shorts (for exchanges with no margin) and more understandable settings.
The idea of the strategy is to look for the distance between the fast and slow SMA. When it decreases, there is a slowdown in price growth and a change in trend, and at the moment it predicts well the breakdowns of Bitcoin.
In the settings you can configure length of fast SMA, the length of the slow SMA is calculated as the length of the fast + diff. Usually, I pick up the fast SMA length, and then looking for the optimal diff. TrendChangeCandles indicates how many columns are needed in order to form a signal. 1 - the signal will be at each slow/acceleration event, we need to filter it, otherwise there will be a lot of unnecessary signals.
At the moment I have a bot that works on the default settings on the Bitmex exchange, and it gives good results. However, I think it is possible to find other settings for other pairs or timeframes (at least 15 minutes) that would give good results.
Trend

Trend Trader Bands Backtest This is plots the indicator developed by Andrew Abraham
in the Trading the Trend article of TASC September 1998
It was modified, result values wass averages.
And draw two bands above and below TT line.


Trend Trader AVR Backtest This is plots the indicator developed by Andrew Abraham
in the Trading the Trend article of TASC September 1998
It was modified, result values wass averages.

Power Penguin - Trend Trading Script BacktesterPower Penguin is a script that detects a trend and determines entry into the market based on the strength and price action.
Thanks to all my early backers for believing in my work!
This script is optimal for use in any market at this time.
To request a trial for this script, please PM me.
-----------------
Power Penguin V1.0.0
- Initial release

Adaptive Trend OscilatorAdaptive strategy for strong move starting points. When it capture signal stay in that direction until lost momentum or get a counter signal
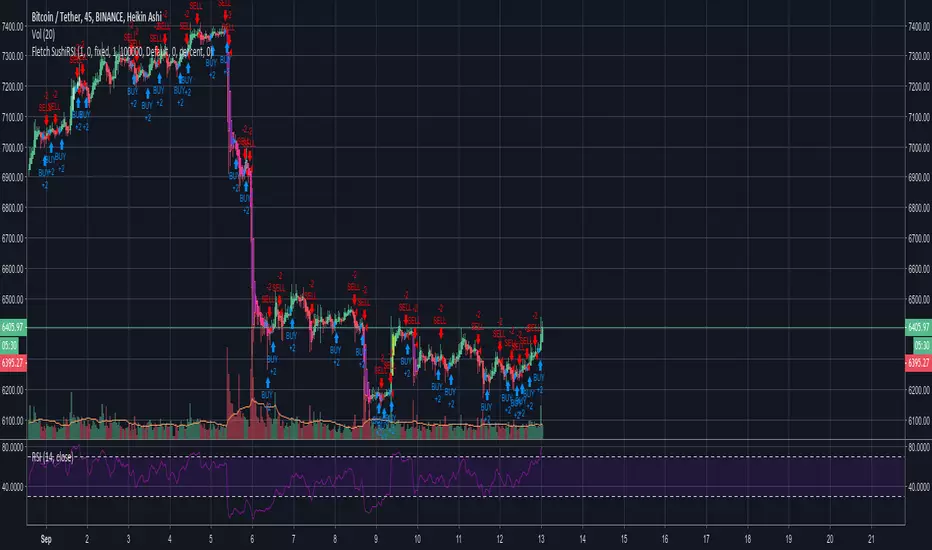
Hyper SushiRSIThis is a very frequent trading version of the Fletcher SushiRSI, targeted at BTC/USDT on the 45m timeframe using Heikin Ashi candle sticks.
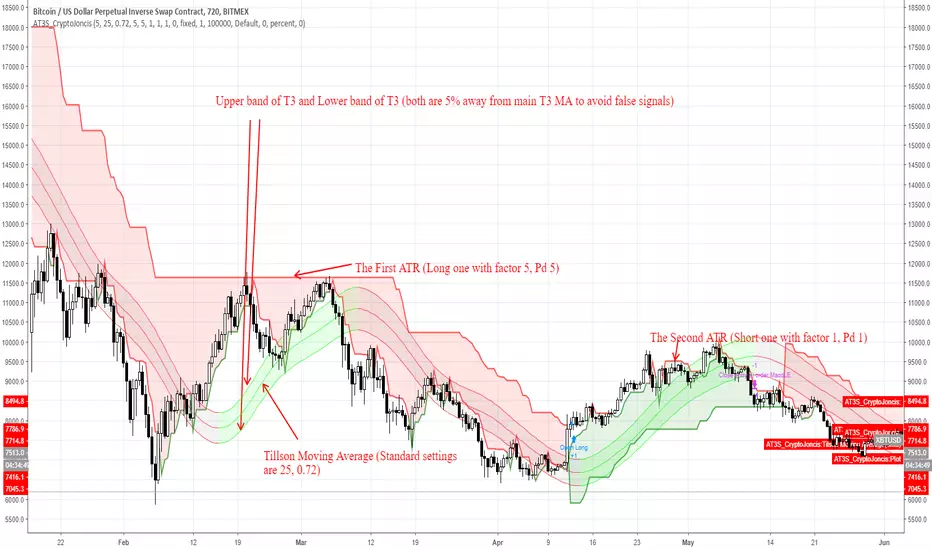
ATR and T3 strategyT3 Moving Average indicator was originally developed by Tim Tillson in 1998/99.
T3 Moving Average is considered as improved and better to traditional moving averages as it is smoother and performs better in trending market conditions.
It offers multiple opportunities when the price is in the state of retracement and therefore allows to minimize your exposed risk and allowing your profits run.
This strategy is for trend followers who are patient enough to have 6-10 trades per year.
What's included in strategy?
Two ATR (Code was taken from J.Dow and modified)
Tillson Moving average
Enter long signal:
When both ATR (Long and Short) are in uptrend and the bar closes above Upper Tillson's moving average band: Enter Long
Exit Long signal:
When hl2 is lower than Lower Tillson Moving Average band
Enter short signal:
When both ATR (Long and Short) are in downtrend and the bar closes below Lower Tillson's moving average band: Enter Short
Exit Shortsignal:
When hl2 is higher than Upper Tillson's Moving Average band
Best to use with Bitcoin on 12H TF
Can be used for different time frames as well but the settings must be adjusted accordingly
Remember, overtrading can be harmful to your trading account.
If this is helpful for you, consider a tip
BTC: 3FiBnveHo3YW6DSiPEmoCFCyCnsrWS3JBR
ETH: 0xac290B4A721f5ef75b0971F1102e01E1942A4578
Created by CryptoJoncis
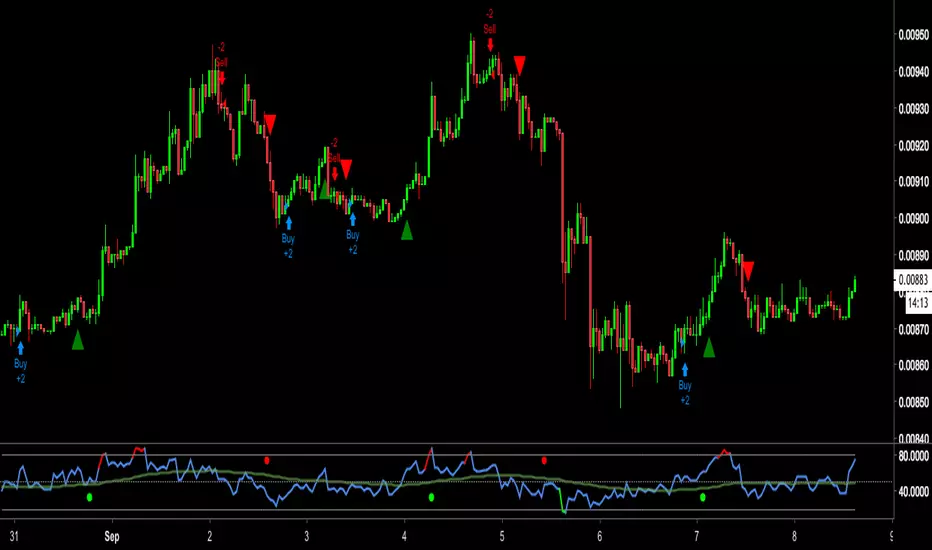
WW buy/sellGreen and Red Triangles tell the overall trend
buy/sell are pretty obvious, what they do
the way i use it is:
long (buy) 50% of your position size when we have buy and then long (buy) another 50% when i get the green triangle
short (sell) 50% of your position size when we have sell and then short (sell) another 50% when i get the red triangle
also, i look at my RSI indicator to confirm the entry and exits
RSI is above green line and indicator says buy, it's a safe long
RSI is below green line and indicator says sell, it's a safe short
won't be able to describe much as the more you use it, more you get used to it
cheers!
TradeSpot Pro || Accompanying Strategy indicatorTradeSpot Pro
Overview
This script is an accompaniment to the existing TradeSpot Pro || All Purpose Advanced Trading Indicator
This script is for swing trading with longs, primarily on Binance / Kucoin / Coinbase and other crypto exchanes but is not limited to those markets. The details of what logic is behind the script can be found on the indicator version linked above.
Bags? This script has been tweaked and modified to completely destroy bear markets despite being focused on longs, see the BTCUSD image or PM me for any chart of your liking. I dislike indicators that show an amazing looking run in a bull market but in bear markets they fall apart - well with TradeSpot Pro that is not the case, it is completely market agnostic
Access
For details of access please join the TradeSpot community server where we can sort you out: discord.gg
Alternatively PM me if you would like to directly purchase the strategy and paired indicator.

Best Parabolic SAR Study and StrategyCustom built Parabolic Stop and Reversal (SAR)
Produces more responsive results.
Also included is an ATR based SAR which better indicates trend.
Long and short stops are marked on the chart and can be found in the style tab.
PSAR source is variable and is shown on the chart.
Trading source is variable, this is what is used to determine a change in direction against the calculate PSAR and for stops/reversals.
Access is open for now so long as I am getting constructive feedback. Thanks for trying it out!

TrendMaster, v. 5.1TrendMaster (ver 5.0, a.k.a. "Mr. T") is a trend-anticipating system which shows eye-popping results. Rather than a simple "trend-rider" which continually lags, TrendMaster uses pattern recognition to anticipate trend changes. It hunts for turns in market cycles using a proprietary decision matrix of 27 "trade triggers" (variants of classic technical indicators). In backtesting the annualized return (July 2017-July2018) of the top 100 largest capitalized equities, not only did its results beat the indexes, but it outstripped a buy-and-hold strategy by a whopping 700%: i.e., while the 100 largest equities had an average annual yield of 17%, the strategy produced a 129% return across the entire range of stocks.* Even more staggering results can be seen when using the system in strongly-trending markets like cryptos. (See, for instance, the particularly stunning results for Bitcoin Cash in the screen shot at the end). [ ]
The following charts give you some sample tests of best performing (top chart) and worst performing (bottom chart) equities, ETFs, and cryptos (July 2017-July2018 time range).
TrendMaster / "Mr T" 5.1, Example Annualized returns
>>> Higher Performing Instruments (best performing interval between 15min - 1 day) <<<
Symbol Description Interval % Return Trades % Profitable Profit Factor Max Drawdown Sharpe Ratio Buy & Hold
DUST 3x Short Gold miners 30 min 3050% 421 43% 1.5 ( -17% ) 1.8 ( - 27 % )
NUGT 3x Long Gold miners 15 min 3300% 423 44 1.2 ( -11% ) 1.2 ( - 10 % )
APPL Apple, Inc 1 hour 118% 354 46 2.2 ( -6% ) 1.3 32%
GOOG Alphabet, Inc 30 min 128% 660 44 1.9 ( -5% ) 1 27%
BABA Alibaba Group 30 min 389% 642 46 2.3 ( -3% ) 1.6 37%
BTC/USDT Bitcoin 1 hour 1000000% 1573 53 3.1 ( -8% ) 1 57%
ETH/USDT Ethereum 1 hour 13000000% 1533 55 3.2 ( -12% ) 1.2 56%
LTC/ USDT Litecoin 30 min 5000000% 1946 54 2.8 ( -12% ) 1.2 ( - 71% )
>>> Lower Performing Instruments and/or Lower Performing Market Settings (worst performing interval between 15 min - 1 day) <<<
Symbol Description Interval % Return Trades % Profitable Profit Factor Max Drawdown Sharpe Ratio Buy & Hold
PSQ Short Nasdaq ETF 5 min ( - 14% ) 1894 28% ( - 0.9 % ) ( -20% ) ( -0.3 ) ( - 20 % )
SH Short S&P ETF 1 day 20% 35 51% 2.8 ( -7% ) 0.5 ( - 12 % )
MSFT Microsoft 1 hour 37% 249 37% 1.4 ( -4% ) 0.5 45%
AZN Astrazeneca, PLC 1 day 22% 32 50% 1.9 ( -6% ) 0.3 ( - 4 % )
MUFG Mitsubishi UFJ 1 day 296% 1255 39% ( - 0.6 ) ( -27% ) ( - 0.3 ) ( - 16 % )
BTC/USDT Bitcoin 1 min ( - 33 % ) 1349 25% ( - 0.5 ) ( - 33% ) ( - 1.1 ) 5%
ETH/USDT Ethereum 1 min ( - 40 % ) 1595 24% ( - 0.6 ) ( -40% ) ( - 1.1 ) 6%
LTC/USDT Litecoin 1 day 123 14 57% 4.8 ( - 5% ) 1.1 ( - 48% )
Note, of course, that any trend-anticipating bot has limitations. The Lower Performing results above show that because the system seeks gains in trends, it can underperform in choppy, aimless markets. Similarly, very short time frames (i.e. 1 - 5 minutes) can provide too many gaps and too few runs for it to reliably track. Backtesting is therefore essential to make sure this system is suitable for your (a) market, (b) time frame, and (c) trading mindset. On the other hand, a broad range of data show that almost any trending market, in almost any time frame, can be very productive.
Contact us if you would like to experience this bot.

[Strategy] ANN Revised (Pine Version 3)High drawdown. I will look for a way to fix this. Have to protect the code in case someone commercialise this.
VWMA + SMA BBollinger + RSI Strategy (ChartArt) mod by BiO618This is a script I remade from the original ChartArt's "CA_RSI_Bolling_Strat".
I added a VWMA following the SMA basis curve.
BBand was made with the SMA curve, +2DS.
The point of adding VWMA to the script is to get a fast correlation between price change and volume change.
How to interpret it:
Since 3-Intervals-VWMA = (P1*V1 + P2*V2 + P3*V3) / (V1+V2+V3)
As the volume grows, VWMA get smaller.
If the price goes to the upper band, and the VWMA follows it, Price grew more than Volume, and a correction would happen soon.
If the price goes to the lower band, and the VWMA follows it, Price dipped with a lot of Volume, and a continuation of trend would be expected.
If the price goes to the upper band, and the VWMA stays close to SMA, Price grew with a correspondient Volume, and the continuation of trend would be expected.
If the price goes to the lower band, and the VWMA stays close to SMA, Price dipped with low Volume, a correction would happen soon.
Remember that NO INDICATOR is flawless, support your interpretation with other indicators like RSI and MACD.
Hope you enjoy it!
φ!

UNKNOWN1Designed for BTC only but with proper settings, I believe it can be used for other markets as well, at the end, it is a trend following strategy. Best TF to use - 1H

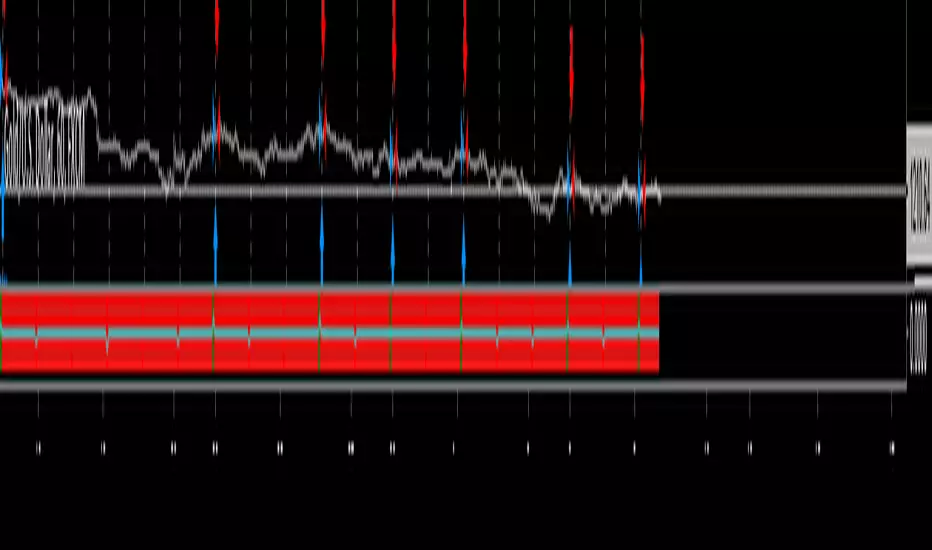
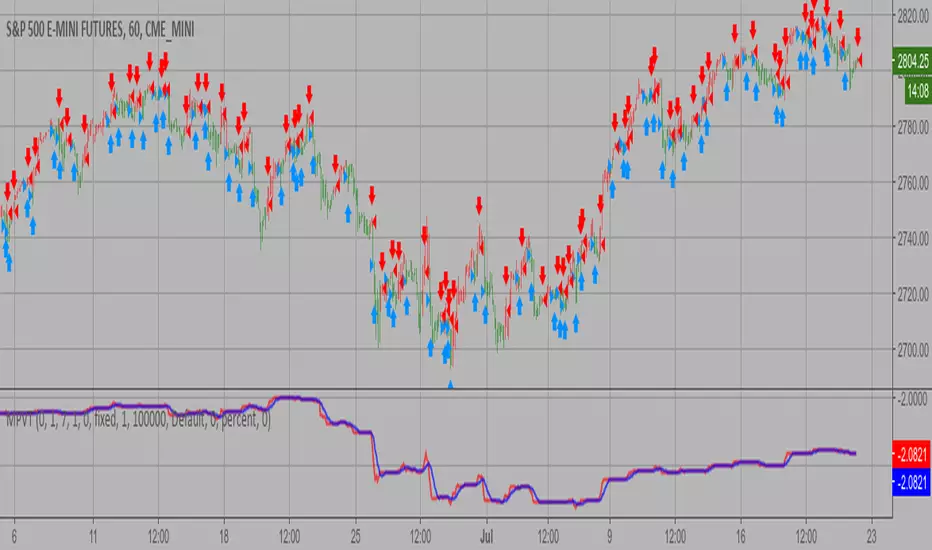
Modified Price-Volume Trend Backtest The related article is copyrighted material from
Stocks & Commodities.
Strategy by HPotter.
You can change long to short in the Input Settings
WARNING:
- For purpose educate only
- This script to change bars colors.

Wave & Trend Accompanying Backtesting StrategyVersion 1.0
Purpose
This backtesting strategy indicator is a accompanying tool for use with my popular trading and alert indicator: Wave & Trend Autoview Advanced Indicator & Alerts
Reference Indicator Link:
Features
This strategy has been programmed to act exactly how the accompanying indicator would be used with an automated strategy such as Autoview or through manual trading
Has identical coloured signals with correct icons for reference with the indicators standard alert conditions (BUY/SELL)
The ability to toggle on or off all the logic and UI presets you could previously use to enhance the standard indicator
No short / longs for the most accurate representation of buys and sells, The strategy will keep buying on every optimal signal (+1 order quantity each time) and then sell all assets on a met sell condition (-all quantity), matching exactly how the reference indicator is used to buy/sell on eg. Binance and also give the most accurate statistics.
Fully customisable in the settings regarding trading strategy to match exactly how you have the reference indicator set up with alerts or how you are trading manually with it.
Ability to choose a timeframe, want to ignore the crypto boom at the latter stages of 2017? Sure you can, change the time frames in the settings to see a more recent representation of your trades.
Access
This indicator is free for existing owners of my Wave & Trend Indicator linked above as an accompanying tool to improve their strategy and net more profit. If you would like access to any of my indicators or would like to know more please find me on my community discord channel where you can find indicator details/documentation and general help:
Discord Link: discord.gg
Thank you for the immense support everyone, happy trading!
- Falco

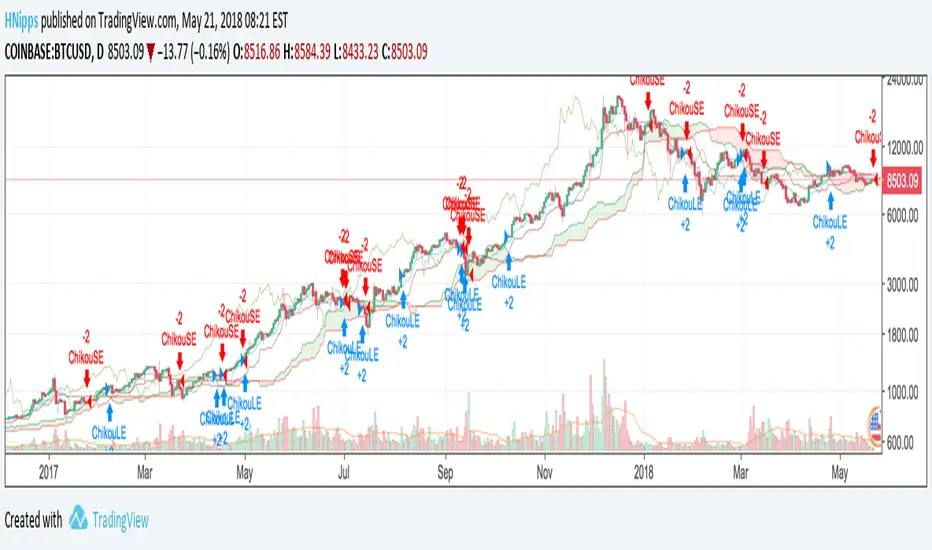
Chikou CrossoverA very simple Ichimoku Cloud strategy. Buy when Chikou Span crosses above price. Sell when Chikou Span crosses below price.
ElanStrategy v1.0A trend-following strategy with a twist.
I worked on the premise that Bitcoin price swings can not be predicted properly, since it's such a heavily manipulated market. Therefore, I chose to work with following the trend instead of predicting reversals.
The basis of this strategy is a fairly simple medium-term MA-crossover, but it adds nuance using a long-term MA for deciding on the size of the position.
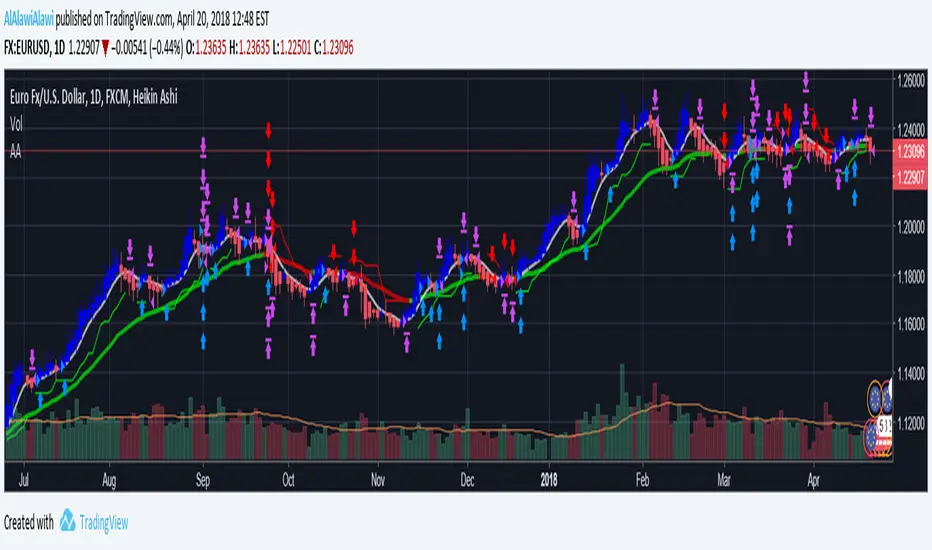
AlAlawi StrategyHello Experts / Trolls;
I had written this strategy for a while and although I know how to color my charts, I wish for some expert advice or just some trolls to bring light to the codes weakness area's.
Period = isdwm?timestamp(2012, 01, 01, 00, 00):isintraday?timestamp(2018, 04, 01, 00, 00):timestamp(2018, 04, 01, 00, 00)
The above line of code for example lets my 4H and 1H charts suffer from a small size of testing and I need to change the dates manually, any idea to let a more dynamic approach and accomodate a 1 minute to 4h charts solution without having to play with the dates manually every time.
I also see a huge difference in results when applying this script on a Heikin-Ashi vs Candlestick chart!
So when pyramiding (upto 15) is applied on this strategy, the numbers starts boosting like crazy too!
This is a rough code for now, let me know where to work on the code or just like and share your opinion on this.
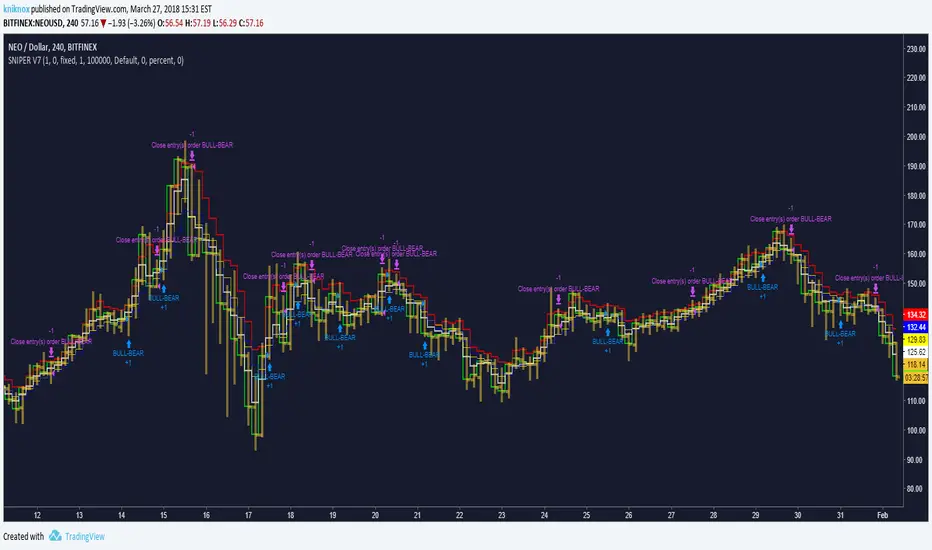
SNIPER V7Hi, I would like you to try my script which will indicate a potential reversal in the market. I'm still new in coding and the code are still in progress but I would be glad if you try them out, for further progression.
SNIPER V2 is more like finding tops, supports and reversal.
LinearRegressionChannelBreakoutMy first idea about the linear regression channel... It is free and available for everybody.
