Multiple Trend Overview
-----------------
Hey there!
The indicator is used for both an overall and a short trend assessment. Both superordinate structures and subordinate movements are mapped. With the help of calculations via Ema , MACD and other tools, graphic trends can be visualized.
The green areas always signal an uptrend, while the red areas indicate a downtrend. The red & blue ema enclose the area of the minor trend. Orange & Green signal the overall trend. Ideally, both Ema faces run in the same direction as the multi-color line. Special alerts in the charts show this again directly in the chart. The multiple setting to display the trends from different time frames is innovative!
For all asset classes!
The indicator is designed for the m30 chart. But it can also be used well on other time frames. In addition, the display can be adjusted via the options and set to any time frame. The indicator has various settings and options that can be activated or deactivated separately.
Caution: Past results do not guarantee future profits!
Follow the link below to get access to this indicator or get us a PM to get access.
--------------------------------------------------------------------------------------------------------------
--------------------------------------------------------------------------------------------------------------
-----------------
Willkommen!
Der Indikator dient sowohl für eine übergeordnete als auch eine untergeordnete Trendeinschätzung. Hierbei werden sowohl übergeordnete Strukturen als auch untergeordnete Bewegungen abgebildet. Mit Hilfe von Berechnungen über Ema , MACD und weiteren Hilfsmittel lassen sich grafische Trends visualisieren.
Die grünen Flächen signalisieren immer einen Aufwärtstrend, während die roten Flächen einen Abwärtstrend anzeigen. Der rote & der blaue Ema schließen die Fläche des untergeordneten Trends ein. Orange & Grün signalisieren den übergeordneten Trend. Idealerweise laufen beide Ema Flächen in die gleiche Richtung wie die Multi-Farben Linie. Spezielle Alerts im Charts zeigen dies auch nochmal direkt im Chart. Innovativ ist die multiple Einstellung die Trends aus verschiedenen Timeframes abzubilden!
Für alle Asset Klassen!
Der Indikator ist für den m30 Chart ausgelegt. Lässt sich aber auch auf anderen Timeframes gut nutzen. Zusätzlich kann die Anzeige über die Optionen angepasst werden und auf jede Timeframe eingestellt werden. Der Indikator besitzt verschiedene Einstellungsmöglichkeiten und Zusätze die separat aktiviert oder deaktiviert werden können.
Achtung: Vergangene Ergebnisse garantieren keine zukünftigen Gewinne!
Verwenden Sie den folgenden Link, um Zugriff auf diesen Indikator zu erhalten oder schreibe uns eine PM um Zugriff zu erhalten.
Trendanalyse

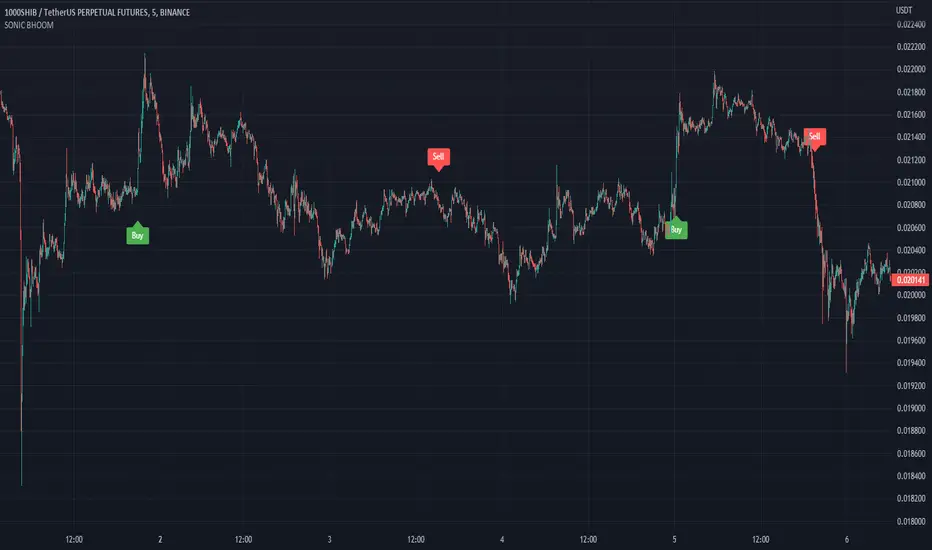
SONIC BHOOM👉 What is this indicator ?
This indicator is made up of Trend and Moving Average, The idea used in this indicator is to understand the current trend and take buy sell entry based on moving average
👉 How many alarms does this indicator have ?
This indicator has two types of alarm for buy signal and sell signal, and it is best to set the alarm by selecting the Alert Once Bar Close option to avoid repaint.
👉 On which coins can this indicator be used ?
This indicator is best used on all cryptocurrencies and forex markets, You can use this indicator with any Time Frame, and this indicator is set to the 1000SHIBUSDT Coin, 5min Time Frame by default. Use appropriate values when using other coins. If you have any difficulty in finding the Value, you can contact us.
Default Setup Instructions 👇
Duration: 5 Minute
Default Coin : 1000SHIBUSDT
The following settings can be found in this indicator
Trend Length :This is an average True change value, Average True Range (ATR) is the average of True ranges over the specified period. ATR measures volatility, taking into account any gaps in the price movement.
Trend High : This is the ATR Factor Value. You can change this value according to the volatility, the ATR Factor value is also used to reduce the chance of a fake signal
Threshold :
The Threshold is the difference between price and moving average. Changing the value of this option will change the accuracy of the trading signal
Aarika Balance of Power Trend (ABOPC)Hello traders, this is Balance of Power. We have modified some levels to easily identify the trend of the symbol. This will work on any symbol and on any timeframe!
How to trade based on ABOPC:
1) When BOP is above 0.00 line it indicates a Bull trend and below 0.00 level means a bearish trend may come in action.
2) If BOP line is at 0.10 level, it means there is a 50% chance of reversal
3) If BOP line is 0.20 level, it suggests 90% chance of reversal or sideways market.
We highly recommend not to trade solely based on this indicator, rather use this as a supportive or double confirmation indicator for study purpose.
Thanks.
Disclaimer: This indicator was not created by us but we only modified it for study purpose.

Ema Cross, 10 /21 / 55Ema Cross tool using Ema 10 / Ema 21 / Ema 55
I have found these settings very useful for catching breakouts on Alt coins.
Alerts Added,
Breakout = Ema 10 crossing above Ema 21
Breakdown = Ema 10 crossing under Ema 21
Ema 55 added as a useful area to catch dips when price is trending
