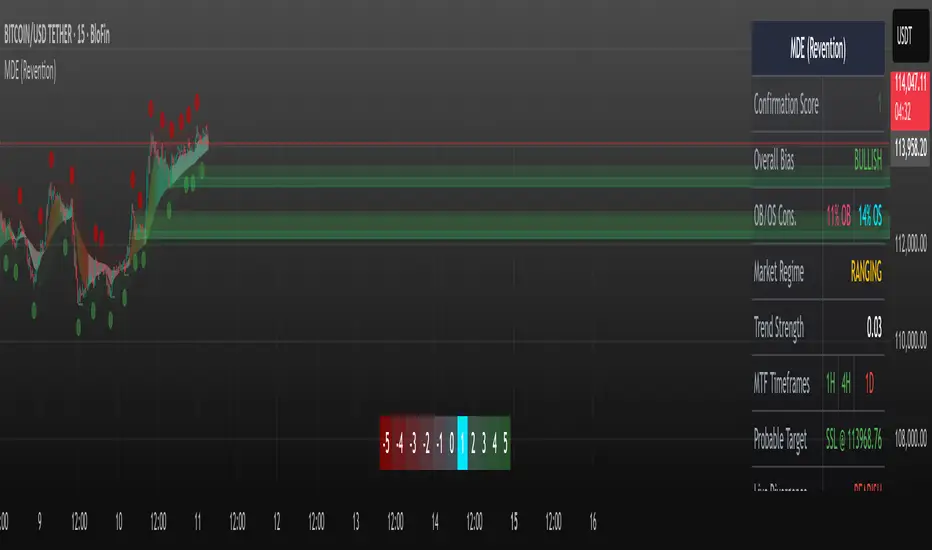
Market Dynamics Engine (Revention)// | An All-in-One Market Analysis Suite |
// | |
// | This script provides a holistic view of the market by unifying a |
// | dynamic trend engine, an advanced market structure analysis module,|
// | and a multi-oscillator confluence system for identifying |
// | potential exhaustion points. |
// | |
// | This professional-grade tool features an adaptive trend ribbon, |
// | predictive liquidity targets, and high-probability POI confluence |
// | markers for a complete analytical experience.
Trend Analysis
Fractal Model [Free+] (T-Trades)Fractal Model - Higher Timeframe Analysis Tool
Advanced higher timeframe candle visualization with T-spot identification, sweep detection, and multi-timeframe price action analysis.
Introduction:
The Fractal Model is a Pine Script indicator that provides advanced higher timeframe (HTF) candle visualization and analysis. It identifies key price action patterns including T-spots, sweep signals, and imbalance zones to help traders understand market structure across multiple timeframes.
Description:
The Fractal Model analyzes price action by creating higher timeframe candles on your current chart, allowing you to see HTF structure without switching timeframes. It identifies specific price action patterns that often precede significant moves, including T-spot formations, sweep confirmations, and fair value gaps.
The indicator uses logarithmic midpoint calculations and pivot detection algorithms to identify high-probability entry and exit points. It automatically detects appropriate higher timeframes based on your current chart timeframe and provides real-time analysis of price action patterns.
Key Features:
Higher Timeframe Candle Visualization: Automatically creates higher timeframe candles on your current chart, allowing you to see HTF structure without switching timeframes. Supports up to 6 different HTF levels with automatic timeframe detection.
T-Spot Identification: Identifies T-spot formations using logarithmic midpoint calculations. T-spots mark areas where price is likely to form wicks based on specific price action patterns including sweep conditions and close position analysis.
Sweep Detection: Detects when price sweeps previous highs or lows but closes on the opposite side, creating potential reversal zones. Includes both high sweeps and low sweeps with visual confirmation lines.
Fair Value Gap (FVG) Detection: Identifies gaps between candle ranges where price didn't trade, creating potential support/resistance zones. Uses three-candle pattern analysis to detect imbalance areas.
Volume Imbalance Detection: Identifies areas where price action shows volume imbalance between consecutive candles, indicating potential continuation or reversal zones.
T-Spot Sweep Confirmation: Advanced confirmation system that requires pivot formation before T-spot touch, then close beyond the pivot level to confirm sweep signals.
TTFM Labeling System: Dynamic labeling system that tracks setup validity with C2, C3, and C4 labels indicating different types of T-spot formations and their confirmation status.
How the Code Works:
1. Higher Timeframe Detection:
The indicator automatically determines appropriate HTF based on your current chart:
- 1m charts: 15m HTF
- 3m charts: 30m HTF
- 5m charts: 1h HTF
- 15m charts: 4h HTF
- 30m-1h charts: 1D HTF
- 4h-8h charts: 1W HTF
- 1D charts: 1M HTF
2. T-Spot Calculation Algorithm:
T-spots are identified using logarithmic midpoint calculations combined with pivot-based logic:
- Calculates log midpoint = exp((log(high) + log(low)) / 2) for wick analysis
- Identifies sweep conditions: high > prev_high AND close < prev_high (bearish) or low < prev_low AND close > prev_low (bullish)
- Creates T-spot zones based on close position relative to logarithmic midpoint
- **Core Logic**: All T-spot formations are based on pivot creation patterns where price sweeps previous levels but closes on the opposite side, creating potential reversal zones
3. Sweep Detection Logic:
The code detects sweeps using pivot analysis:
- Uses ta.pivothigh() and ta.pivotlow() with 1,2 parameters for pivot detection
- Confirms sweeps when: pivot forms before T-spot touch AND close breaks beyond pivot level
- Tracks pivot levels and bars for confirmation validation
- **Pivot-Based Foundation**: The entire system is built on pivot creation logic - T-spots form when price creates pivots by sweeping previous levels but closing opposite, indicating potential reversal points
4. Fair Value Gap Detection:
FVG identification uses three-candle pattern analysis:
- Candle1.l > Candle2.h AND min(Candle1.o, Candle1.c) > max(Candle2.o, Candle2.c) for bullish FVG
- Candle1.h < Candle2.l AND max(Candle1.o, Candle1.c) < min(Candle2.o, Candle2.c) for bearish FVG
5. Visual Rendering System:
Uses array-based object management:
- Clears and redraws all visual elements on each bar
- Manages HTF candles, T-spots, sweeps, and labels using separate arrays
- Implements cleanup logic to prevent memory overflow
6. Pivot-Based T-Spot Types:
The indicator identifies several T-spot patterns based on pivot creation:
- **Standard T-Spots**: Price sweeps previous high/low but closes opposite, creating pivot
- **Expansive T-Spots**: Previous candle sweeps, current candle expands and closes beyond sweep level
- **Pro-trend T-Spots**: Price sweeps logarithmic midpoint but closes beyond previous levels
- **Silver T-Spots**: Special T-spots during specific market hours (4th-5th candle of day)
- All patterns require pivot formation through sweep-and-close logic for validation
Usage Guidance:
Add the Fractal Model indicator to your TradingView chart
Configure HTF settings and T-spot bias preferences
Adjust visual customization options to match your trading style
Monitor T-spot formations and sweep confirmations for entry signals
Trading Applications:
T-Spot Trading:
- Look for T-spot formations on higher timeframes
- Wait for price to touch T-spot levels
- Enter on sweep confirmation with proper pivot validation
- Use T-spot levels as support/resistance zones
Sweep Trading:
- Identify sweep patterns where price breaks previous highs/lows but closes opposite
- Use sweep levels as potential reversal zones
- Combine with T-spot analysis for higher probability setups
Fair Value Gap Trading:
- Trade FVG fills as price returns to imbalance areas
- Use FVG levels as support/resistance zones
- Combine with higher timeframe structure for context
Technical Specifications:
- Compatible with Pine Script v6
- Non-repainting indicator
- Supports all timeframes with automatic HTF detection
- Memory-efficient array management
- Real-time T-spot and sweep detection
- Customizable visual elements and colors
Disclaimer:
This indicator is for educational and informational purposes only. Past performance does not guarantee future results. Always conduct your own research and risk management before making trading decisions.

Net Positions (Net Longs & Net Shorts) - Volume AdjustedNet Positions (Net Longs & Net Shorts) - Volume Adjusted
Based on the legendary LeviathanCapital - Net Positions Indicator
Adjusted to use volume calculation for more percise data
Few important caveats:
- EVERY BUYER NEED A SELLER AND EVERY SELLER NEED A BUYER
- This indicator is meant to give you a sense of direction for the market orders ("who is the aggresive side") and should be used as confluence not as true values
In reality, in market movement each candle will contain both buying and selling, contracts closing and opening but due to some limitations that is hard to make properly.
Even with these limitations this indicator can provide a better picture than some other even external tools out there.
The main benefit of using volume delta and open interest instead of just open interest and candle closes G/R that it solves the problem with extreme cases where there might be an absorption of market orders.
Example of the Volume Edge in Action:
Bullish Absorption (The "Trap" for Sellers)
Candle Close + OI: A large Red Candle forms with Rising OI. The interpretation is simply: "New shorts are opening"
Volume Delta + OI: The same Red Candle with Rising OI has a Positive Volume Delta.
The True Story: Aggressive buyers tried to push the price up, but they were completely absorbed by large passive sell orders.
The "Volume Delta" logic:
If OI ↑ → new positions opened
• Delta ↑ → net longs added
• Delta ↓ → net shorts added
If OI ↓ → positions closed
• Delta ↑ → shorts closing
• Delta ↓ → longs closing
The "Price" logic:
If OI ↑ → new positions opened
• Price ↑ → net longs added
• Price ↓ → net shorts added
If OI ↓ → positions closed
• Price ↑ → shorts closing
• Price ↓ → longs closing

Script_Algo - Div-to-Div CCI Strategy📈 This strategy tries to catch market moves from one CCI divergence to the opposite CCI divergence in the trend direction. In many cases, this approach allows capturing long moves.
🛡️ In case the price still goes the wrong way, the strategy includes an ATR-based stop loss, which allows adapting to the current market volatility.
📚 For those unfamiliar with CCI:
The Commodity Channel Index (CCI) is a momentum-based oscillator used to identify overbought and oversold conditions.
It helps traders spot potential trend reversals or confirm trend strength by comparing the current price to its average over a period of time.
⚙️ How the Strategy Works
The script looks for divergence between the CCI line and the price:
📉 If the price updates a higher high, but CCI shows a lower high → this is a bearish signal.
📈 If the price updates a lower low, but CCI shows a higher low → this is a bullish signal.
🔄 When an opposite divergence appears, the script closes the current trade and opens a position in the other direction.
🛡️ To protect against deep losses, the strategy includes a stop loss based on ATR.
📊 For higher efficiency, the script also uses a trend filter based on EMA.
🛠️ Settings
CCI Length – defines how sensitive the CCI line is to price changes (default - 15).
Bars to look for divergence – defines how many bars back to check for highs/lows (default - 6).
ATR period & multiplier – used for stop loss adjustment (default - 14).
EMA trend filter – can be enabled and customized for length (default - 3).
Initial capital - 10000 $, position size - 1000, comission - 0,1%, risk per trade - 1%.
🎨 Visualization
📌 Signal markers for entries & exits are shown.
🟩 Light green background → when in a long position.
🟥 Light red background → when in a short position.
⬜ Light gray background → when no position is open.
📈 Backtest Results
✅ If you carefully check the backtest, you’ll see that on the DOTUSDT pair — a fairly conservative and reputable crypto asset — the strategy could potentially yield around 2300 $ in 1.5 years considering position size 1000$ and the small projected drawdown 400 $.
✅ Moreover, during a similar past period on the same asset, the strategy was also profitable.
✅ On the 1-hour timeframe, the equity curve shows stable growth.
✅ Win rate: 50%+
✅ Profit factor: ~2
👉 Whether this is good or bad — judge for yourself, considering that during this time DOT price dropped by 50% (from $8 to $4).
⚡ Always remember: past performance does not guarantee future results.
The market constantly changes, so you must monitor conditions, backtest, and adjust settings for each asset.
💡 Advice:
Be aware of possible bugs in any algo trading strategy, even if well-tested.
No one knows what unexpected events may occur on the market tomorrow.
Trade only on high-liquidity assets to avoid excessive volatility, high slippage, wide spreads, and commissions.
⚡ The script does not repaint. I personally tested the strategy multiple times in TradingView’s backtest mode across different assets on the 1H timeframe. Results may slightly differ due to slippage and sudden market moves.
📊 The script is ready for automated trading via webhook on any crypto exchange that supports this functionality.
⏳ Recommended Use
The strategy can be effective on many fundamentally strong and highly liquid assets. It is recommended to use a timeframe of 1H or higher.
⚠️ Disclaimer
Please note that the results of the strategy are not guaranteed to repeat in the future. The market constantly changes, and no algorithm can predict exactly how an asset will behave.
The author of this strategy is not responsible for any financial losses associated with using this script.
All trading decisions are made solely by the user.
Trading financial markets carries high risks and can lead to loss of your investments.
Before using the strategy, it is strongly recommended to:
✅ Backtest the strategy on historical data
✅ Start with small trading volumes
✅ Use only risk capital you are ready to lose
✅ Fully understand how the strategy works
✍️ Final Notes
💡 If you have any ideas on how to improve this or my other strategies, feel free to let me know — I’ll try to implement them.
🐞 If you notice any bugs or inconsistencies in my algorithm, please write to me — I hope to fix them as soon as possible.
⚡ This is not the final version of the strategy.
I am constantly working on optimization and efficiency improvements, so follow me to not miss updates.
💰 Good luck and stable profits to everyone!

LBM-Strategy Engine Pro: The Ultimate Confluence IndicatorOverview
Welcome to the Strategy Engine Pro , the ultimate confluence indicator designed for traders who demand precision and full control over their trading signals. This is not just an indicator; it is a complete, customizable strategy-building framework.
It seamlessly integrates three powerful concepts into a single, intuitive tool:
Advanced Moving Average Trend Analysis to define the market context.
An intelligent Support & Resistance Cycle Engine to identify key price levels.
A flexible 10-rule Strategy Builder that lets you design, test, and refine your own entry signals with surgical precision.
Core Features
1. Advanced Moving Average Trend Analysis
The indicator plots 5 fully configurable Moving Averages (MAs). You can choose the Period and Type (SMA, EMA, WMA, HMA, RMA) for each one. But its true power lies in its unique color-coding system, which analyzes the slope and momentum of each MA, not just its price.
MA Color Code:
Green: The MA is in a strong, confirmed uptrend.
Red: The MA is in a strong, confirmed downtrend.
Yellow: The MA is flat or in a transitional (sideways) phase.
This provides an instant visual snapshot of the market trend across five different timeframes.
2. Support & Resistance Cycle Engine
Forget simple pivot points. This indicator incorporates a sophisticated engine that identifies and plots significant "Master Cycle" levels on your chart.
Anchored Levels: These S/R lines are persistent and intelligent. When a key resistance level is broken, it automatically "flips" and becomes the new anchored support level, and vice-versa. This accurately maps out the market's structural progression.
The Strategy Builder: Your Personal Trading Lab
This is the heart of the indicator. You have 10 sequential rules that allow you to define the exact conditions for a Buy signal. The Sell signal is generated as the logical, symmetrical opposite.
For each rule, you can configure:
Source A & Source B: Choose from a wide range of data points:
Price values: Close, Open, High, Low.
Previous candle values: Close Before, Open Before, etc.
Moving Average values: MA 1 through MA 5.
MA Trend Colors: MA 1 Color, MA 2 Color Before, etc.
Operator: Define the comparison logic:
Standard: >, <, >=, <=
Events: Crossover, Crossunder
Color Logic: Is Color, Is NOT Color, Turned Color, Ceased to be Color
Important Note on Sell Signals: Sell conditions are designed to be the symmetrical opposite of the buy conditions you create.
If Buy is Close > MA 1, Sell will be Close < MA 1.
If Buy is MA 1 Color Is Green, Sell will be MA 1 Color Is Red.
If Buy is MA 1 Color Turned Green, Sell will be MA 1 Color Turned Red.
This ensures your sell strategy mirrors the logic of your buy strategy, preventing the "inverse problem" of getting sell signals on every candle that isn't a buy signal.
Mastering the Connectors: ( ) AND and ( ) OR
The true power of the Strategy Builder lies in its connectors, which allow you to create complex, multi-layered logic. The connector on a rule defines how it connects to the next active rule.
AND & OR: These work as you'd expect, creating a continuous chain of conditions.
Rule 1 (AND) & Rule 2 is evaluated as (R1 AND R2).
( ) OR (The Group Separator): This is your most powerful tool. It acts like closing a parenthesis in an equation. It finalizes the current group of rules and connects it to the
next group with a big "OR".
Example: (R1 AND R2) OR (R3 AND R4)
This creates two possible paths for a signal.
- Rule 1: Condition R1, Connector AND
- Rule 2: Condition R2, Connector ( ) OR <-- This closes the first group and links to the next with OR.
- Rule 3: Condition R3, Connector AND
- Rule 4: Condition R4
( ) AND (The Super-Filter): This allows you to create a "master" condition that must be true in addition to other complex conditions.
Example: (R1 OR R2) AND (R3 OR R4)
This requires a condition from the first group and a condition from the second group to be true.
- Rule 1: Condition R1, Connector OR
- Rule 2: Condition R2, Connector ( ) AND <-- This closes the first OR group and links to the next with AND.
- Rule 3: Condition R3, Connector OR
- Rule 4: Condition R4
By strategically combining these connectors, you can build any logical trading scenario you can imagine. We look forward to seeing the powerful strategies the community creates with this engine.

Up & Down entry poinsFibonacci-Bollinger function to calculate the upper and lower boundaries, as well as to display reversal points (blue and red) based on price changes.
Analysis of your script:
Fibonacci-Bollinger: Used to calculate the upper and lower boundaries based on the Simple Moving Average (SMA) and standard deviation (a standard approach for creating ranges).
MA50 for trend: The moving average based on normalized deviation is used to assess the current trend (bullish or bearish).
Reversal points:
Blue points (buy signals) are plotted when the price deviates below the lower Fibonacci boundary and the MA line is rising.
Red points (sell signals) are plotted when the price deviates above the upper Fibonacci boundary and the MA line is falling.
Volume usage: Including volume in the reversal conditions helps filter signals, which is a good practice for reducing false signals.
-----------------------------------
You should only enter long or short positions according to the trend, because counter-trend points will not indicate entry points for trades, but rather large profit-taking from trending positions.
------------------------------------
Ver. 0.1.1 -- First edition.

Table Logic ExtractorTable Logic Extractor v2.0
Advanced multi-timeframe analysis with intelligent trade recommendations!
Overview:
This sophisticated indicator provides comprehensive market analysis through multiple technical indicators and timeframes. It combines EMA analysis, RSI momentum, MACD signals, Bollinger Bands, volume analysis, divergence detection, and intelligent trade recommendations with support/resistance distance calculations and trading style detection.
Key Features:
✅ Multi-Indicator Analysis - EMA, RSI, MACD, Bollinger Bands, Volume, ATR
✅ Multi-Timeframe Analysis - M1, M5, M15, M30 trend comparison
✅ Divergence Detection - Bullish and bearish divergence with strength calculation
✅ Support/Resistance Analysis - Distance calculations with Fibonacci levels
✅ Trading Style Detection - Trend, Range, Breakout, Scalping identification
✅ Intelligent Trade Signals - Style-based trade recommendations with confidence levels
✅ Risk Management - Stop Loss and Take Profit calculations
✅ Comprehensive Table - Real-time analysis with 14 different metrics
How It Works:
The indicator uses advanced analysis:
• Multi-Timeframe - M1, M5, M15, M30 trend analysis
• Style Detection - Automatic trading style identification
• S/R Analysis - Fibonacci-based support/resistance levels
• Weighted Scoring - EMA (2.0), RSI (1.5), MACD (1.5), BB (1.0), Volume (1.0)
• Intelligent Signals - Style-based trade recommendations
Trading Style Detection:
• TREND TRADING - Strong trend + aligned timeframes (Green)
• RANGE TRADING - Low volatility + sideways movement (Yellow)
• BREAKOUT TRADING - High volume + near levels (Orange)
• SCALPING - High volatility + quick moves (Red)
Information Table (14 Metrics):
Real-time display showing:
• ATR volatility with signal (HIGH/MED/LOW/NORMAL VOL)
• Divergence status with strength percentage
• S/R Distance with Fibonacci levels
• Stop Loss (2.0:1 ratio) and Take Profit 1 (1.5:1 ratio)
• Multi-Timeframe analysis (M1, M5, M15, M30)
• Scalping signals with confidence levels
• Current trend with strength percentage
• Intelligent trade recommendations
Trade Recommendations:
• TREND BUY/SELL - All timeframes aligned (High confidence)
• SHORT-TERM BUY/SELL - M5 signal only (Medium confidence)
• SCALPING BUY/SELL - M5 vs higher timeframes (Low confidence)
• WAIT - No clear signal (No confidence)
Support/Resistance Analysis:
• Fibonacci Levels: 23.6%, 38.2%, 50% retracements
• Distance Categories: Very Near (Red), Near (Orange), Medium (Yellow), Far (Green)
• ATR-based distance measurement
• Real-time proximity alerts
Scalping Detection:
Specialized signals based on:
• High volatility (ATR ratio > 1.5)
• Quick price moves (fast momentum)
• Volume confirmation (high volume spikes)
• RSI extremes (oversold/overbought)
Settings:
• EMA - Fast (9), Slow (21), Trend (50)
• RSI - Length (14), Overbought (70), Oversold (30)
• MACD - Fast (12), Slow (26), Signal (9)
• Bollinger Bands - Length (20), Multiplier (2.0)
• ATR - Length (14) for volatility measurement
• Volume Threshold - 1.5x average volume
• Divergence - Lookback (3), Threshold (0.5)
Best Practices:
🎯 Adapt strategy to detected trading style
📊 Use multi-timeframe analysis for confirmation
⚡ Monitor S/R distances for entry timing
🛡️ Always use calculated Stop Loss levels
🔍 Watch for divergence signals
📈 Follow intelligent trade recommendations
Pro Tips:
• Table provides all essential information in one place
• Trading style detection helps adapt your strategy
• S/R distance shows proximity to key levels
• Confidence levels indicate signal reliability
• Multi-timeframe alignment increases success rate
• Scalping signals work best in high volatility
Alerts:
• Trend Change Alert - "Trend changed across timeframes"
• Divergence Alert - "Divergence detected"
• Scalping Alert - "Scalping opportunity"
• Trade Signal Alert - "Trade recommendation available"
Version 2.0 Improvements:
• Advanced multi-timeframe analysis (M1, M5, M15, M30)
• Intelligent trading style detection
• Comprehensive support/resistance analysis
• Professional trade recommendations with confidence levels
• Scalping detection with specialized signals
• Risk management with calculated SL/TP levels
• 14-metric comprehensive information table
Created with ❤️ for the trading community
This indicator is free to use for both commercial and non-commercial purposes.

Open Interest OverlayOpen Interest Overlay
Overview
This indicator displays Open Interest (OI) data directly on your price chart as an overlay, eliminating the need for separate panes while preserving authentic OI movement patterns. Perfect for traders who want to analyze OI correlations without sacrificing chart real estate.
Key Features
📊 Smart Price Scaling
• Automatically maps Open Interest values to fit within your chart's price range
• Preserves all directional movements, timing, and relative magnitude relationships
• Uses official TradingView Open Interest feed for accuracy
🎨 Full Customization
• Custom Colors: Choose your own colors for rising/falling OI (defaults: teal/red)
• Line Style: Toggle between step-line (traditional) or smooth line display
• Optional Fill: Shade area between OI line and mid-price for better visual reference
• Smoothing Options: Apply moving average smoothing to reduce noise
⚙️ Intelligent Settings
• Normalization Window: 300-bar lookback (customizable) for scaling calculations
• Auto Timeframe: Uses daily data for intraday charts on traditional assets, chart timeframe for crypto
• Real Value Display: Shows actual (unscaled) OI value on the last bar
How It Works
The indicator performs proportional mapping of Open Interest data:
1. Calculates OI range (high/low) over the lookback period
2. Maps this range to your chart's price range during the same period
3. Displays OI movements that maintain authentic patterns and timing
Perfect For
✅ Correlation Analysis - See how OI moves with price in real-time
✅ Divergence Spotting - Identify when OI and price trends diverge
✅ Clean Charts - No need for separate panes or window splitting
✅ Pattern Recognition - Spot OI building/declining during key price levels
✅ Cross-Market Analysis - View any symbol's OI overlay on your current chart (e.g., Bitcoin OI while viewing Ethereum prices)
What You Get vs Traditional OI Indicators
Advantages:
• Authentic OI movement patterns preserved
• Direct visual correlation with price action
• No chart real estate sacrifice
• Immediate trend and divergence recognition
Trade-offs:
• Shows relative OI changes rather than absolute values
• Scaling is relative to the selected lookback period
Ideal For
• Day traders monitoring intraday OI flow
• Swing traders analyzing OI trends with price movements
• Futures traders tracking institutional interest
• Anyone wanting clean, correlation-focused OI analysis
Compatible With
• Futures contracts with Open Interest data
• Any timeframe (auto-adjusts for optimal data)
• All TradingView-supported OI symbols

TPO Levels [VAH/POC/VAL]Poor H/L, Single Prints& Naked POCs
🎯 Key Features
📊 Multi-Timeframe Market Profile
Daily, Weekly, and Monthly session analysis
Automatic session detection and profile calculation
Historical session preservation up to 20 sessions
📈 Value Area Analysis
Value Area High (VAH) - Upper boundary of 70% activity
Point of Control (POC) - Most traded price level
Value Area Low (VAL) - Lower boundary of 70% activity
Visual Value Area box with customizable transparency
🎯 Naked Points of Control (nPOC)
Daily nPOC tracking with orange lines
Weekly nPOC (WnPOC) visible on all timeframes
Monthly nPOC (MnPOC) visible on all timeframes
Smart POC combining for nearby levels (reduces clutter)
Auto-removal when price touches naked POC
🟪 Single Print Detection
Daily single prints - Purple boxes
Weekly single prints - Blue boxes (persist on daily charts)
Monthly single prints - Teal boxes (persist on daily charts)
Automatic removal upon price touch
Extend right for active monitoring
⚠️ Poor Structure Identification
Poor Highs - Weak resistance (2+ TPOs at high)
Poor Lows - Weak support (2+ TPOs at low)
Pink dashed lines for easy identification
Historical poor structure tracking
Auto-removal when price breaks structure
🔥 Market Generated Information
Buying/Selling tail detection (disabled by default)
Previous session VAH/POC/VAL levels
Clean professional appearance
Minimal chart clutter design
*Default settings were set for BINANCE:BTCUSDT.P
My kind regards to those who sell this indicator for a monthly subscription 😊

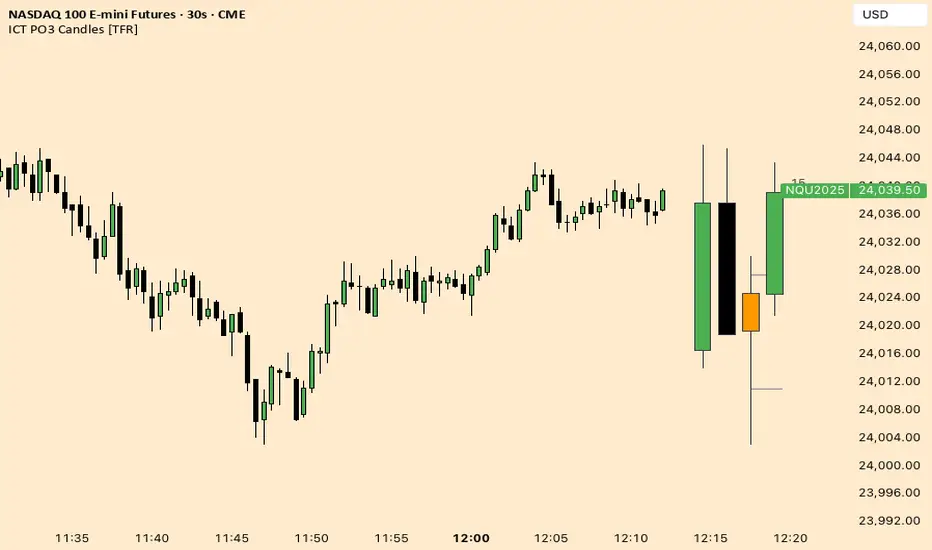
ICT Fractal HTF Candles [TFR]ICT HTF Fractal Candles
This indicator overlays higher timeframe (HTF) candles directly on your current chart for better multi-timeframe analysis. It plots up to the last 4 candles from a user-selected timeframe (5m, 15m, 1h, 4h, or 1D) with customizable body and border colors.
Features:
Displays the last 4 higher timeframe candles (open, high, low, close) on your current chart.
Customizable bullish, bearish, and inside close candle colors.
Optional midpoint wick lines (top and bottom) for precision reference, with extendable length for clarity.
Optional candle midpoint line for additional confluence.
Overlay mode allows you to see HTF structure without switching chart timeframes.
Timeframe label display so you always know which HTF is being plotted.
Offset control for shifting candle position.
Use Case:
This tool helps traders apply ICT concepts like PO3, midpoint reference levels, and multi-timeframe confirmation without constantly switching between charts. It’s particularly useful for identifying liquidity zones, midpoint reactions, and higher timeframe market structure while executing on a lower timeframe.
RSI by Tamil harmonic trader rajRSI indicator - will display RSI value in the middle right chart as per timeframe

Quantile Regression Bands [BackQuant]Quantile Regression Bands
Tail-aware trend channeling built from quantiles of real errors, not just standard deviations.
What it does
This indicator fits a simple linear trend over a rolling lookback and then measures how price has actually deviated from that trend during the window. It then places two pairs of bands at user-chosen quantiles of those deviations (inner and outer). Because bands are based on empirical quantiles rather than a symmetric standard deviation, they adapt to skewed and fat-tailed behaviour and often hug price better in trending or asymmetric markets.
Why “quantile” bands instead of Bollinger-style bands?
Bollinger Bands assume a (roughly) symmetric spread around the mean; quantiles don’t—upper and lower bands can sit at different distances if the error distribution is skewed.
Quantiles are robust to outliers; a single shock won’t inflate the bands for many bars.
You can choose tails precisely (e.g., 1%/99% or 5%/95%) to match your risk appetite.
How it works (intuitive)
Center line — a rolling linear regression approximates the local trend.
Residuals — for each bar in the lookback, the indicator looks at the gap between actual price and where the line “expected” price to be.
Quantiles — those gaps are sorted; you select which percentiles become your inner/outer offsets.
Bands — the chosen quantile offsets are added to the current end of the regression line to draw parallel support/resistance rails.
Smoothing — a light EMA can be applied to reduce jitter in the line and bands.
What you see
Center (linear regression) line (optional).
Inner quantile bands (e.g., 25th/75th) with optional translucent fill.
Outer quantile bands (e.g., 1st/99th) with a multi-step gradient to visualise “tail zones.”
Optional bar coloring: bars trend-colored by whether price is rising above or falling below the center line.
Alerts when price crosses the outer bands (upper or lower).
How to read it
Trend & drift — the slope of the center line is your local trend. Persistent closes on the same side of the center line indicate directional drift.
Pullbacks — tags of the inner band often mark routine pullbacks within trend. Reaction back to the center line can be used for continuation entries/partials.
Tails & squeezes — outer-band touches highlight statistically rare excursions for the chosen window. Frequent outer-band activity can signal regime change or volatility expansion.
Asymmetry — if the upper band sits much further from the center than the lower (or vice versa), recent behaviour has been skewed. Trade management can be adjusted accordingly (e.g., wider take-profit upslope than downslope).
A simple trend interpretation can be derived from the bar colouring
Good use-cases
Volatility-aware mean reversion — fade moves into outer bands back toward the center when trend is flat.
Trend participation — buy pullbacks to the inner band above a rising center; flip logic for shorts below a falling center.
Risk framing — set dynamic stops/targets at quantile rails so position sizing respects recent tail behaviour rather than fixed ticks.
Inputs (quick guide)
Source — price input used for the fit (default: close).
Lookback Length — bars in the regression window and residual sample. Longer = smoother, slower bands; shorter = tighter, more reactive.
Inner/Outer Quantiles (τ) — choose your “typical” vs “tail” levels (e.g., 0.25/0.75 inner, 0.01/0.99 outer).
Show toggles — independently toggle center line, inner bands, outer bands, and their fills.
Colors & transparency — customize band and fill appearance; gradient shading highlights the tail zone.
Band Smoothing Length — small EMA on lines to reduce stair-step artefacts without meaningfully changing levels.
Bar Coloring — optional trend tint from the center line’s momentum.
Practical settings
Swing trading — Length 75–150; inner τ = 0.25/0.75, outer τ = 0.05/0.95.
Intraday — Length 50–100 for liquid futures/FX; consider 0.20/0.80 inner and 0.02/0.98 outer in high-vol assets.
Crypto — Because of fat tails, try slightly wider outers (0.01/0.99) and keep smoothing at 2–4 to tame weekend jumps.
Signal ideas
Continuation — in an uptrend, look for pullback into the lower inner band with a close back above the center as a timing cue.
Exhaustion probe — in ranges, first touch of an outer band followed by a rejection candle back inside the inner band often precedes mean-reversion swings.
Regime shift — repeated closes beyond an outer band or a sharp re-tilt in the center line can mark a new trend phase; adjust tactics (stop-following along the opposite inner band).
Alerts included
“Price Crosses Upper Outer Band” — potential overextension or breakout risk.
“Price Crosses Lower Outer Band” — potential capitulation or breakdown risk.
Notes
The fit and quantiles are computed on a fixed rolling window and do not repaint; bands update as the window moves forward.
Quantiles are based on the recent distribution; if conditions change abruptly, expect band widths and skew to adapt over the next few bars.
Parameter choices directly shape behaviour: longer windows favour stability, tighter inner quantiles increase touch frequency, and extreme outer quantiles highlight only the rarest moves.
Final thought
Quantile bands answer a simple question: “How unusual is this move given the current trend and the way price has been missing it lately?” By scoring that question with real, distribution-aware limits rather than one-size-fits-all volatility you get cleaner pullback zones in trends, more honest “extreme” tags in ranges, and a framework for risk that matches the market’s recent personality.

Liquidation/Doji CandlesLiquidation/Doji Candles
This indicator highlights candles with a body length smaller than 30% of the candle’s total range. These candles are displayed in orange, representing potential liquidation points or doji candles.
The idea behind this tool is to help traders spot moments of market indecision, where buying and selling pressure are in balance. Such conditions often hint at institutional liquidation events or possible retail-driven reversals.
You can fully customize the detection sensitivity by adjusting the percentage input. This allows you to tighten or loosen the condition depending on your trading style and market preference.
To support passive traders, the script also includes built-in alerts for:
• The formation of a new liquidation/doji candle.
• A close above its high (bullish engulfment).
• A close below its low (bearish engulfment).
These alerts make it easier to stay on top of potential market shifts without needing to constantly monitor the charts.

ORB with 50% lineThis script plots the high and low of any custom session and extends these levels until the daily close. By default, it will not display on timeframes higher than the length of the defined opening session.
From the settings, you can adjust both the opening range period and the maximum timeframe on which the levels are displayed.
In addition, the script also plots a median line between the ORB High and ORB Low, providing an extra reference level for traders.

S76 - Multi-Indicator ComboThis custom indicator combines five powerful technical analysis tools into a single script to help you identify strong buy signals during upward price movements. It’s designed for use in both spot trading and stock markets.
1. Momentum
Calculated as the difference between the current price and the price from 14 periods ago.
A positive value indicates upward momentum — the price is gaining strength.
2. Moving Average (MA)
A 50-period Simple Moving Average (SMA).
If the price is above the MA, it suggests an uptrend is in place.
3. RSI (Relative Strength Index)
Measures whether the asset is overbought or oversold.
A value below 70 means the asset is not yet overbought — leaving room for further growth.
4. MACD
Based on the difference between two EMAs (12 and 26), plus a signal line (9-period EMA of MACD).
If MACD is above the signal line, it confirms bullish momentum.
5. Bollinger Bands
Shows volatility and potential breakout zones.
If the price breaks above the upper band, it may signal a strong upward move.
✅ Buy Signal Logic
The indicator plots a green marker below the candle when all of the following conditions are met:
Momentum > 0
Price > MA
RSI < 70
MACD > Signal Line
Price > Upper Bollinger Band
This combination suggests the price is rising with strength, in a confirmed trend, not yet overbought, and supported by volatility — a prime entry point.
📌 How to Use It
On TradingView: Add the indicator to your chart and watch for green markers as potential buy signals.
For spot and stock trading: Use it to time entries into assets like stocks, ETFs, or cryptocurrencies.
Customization: You can adjust the lengths of MA, RSI, and other components to match your trading style.

Slingshot Trend 🎯⏰How to Use the Slingshot Trend Indicator 🎯⏰ (65-Minute Timeframe)
The **Slingshot Trend Indicator** helps spot bullish trend entries using price action and EMAs, optimized for your favorite 65-minute timeframe. Here’s a simple guide:
⚙️ Setup
- Add the indicator to your chart.
- Set the 89 EMA timeframe to 65 minutes (or keep the default 195 minutes for higher-timeframe confirmation).
🔑 Key Features
- **Slingshot EMA**: Short-term EMA (default length: 4) to detect breakouts.
- **EMA Stack**: Confirms bullish trend when 21 EMA > 34 EMA > 55 EMA > 89 EMA.
- **Price Above 89 EMA**: Ensures price is above the 65-minute 89 EMA.
- **ATR Targets**: Uses 14-period ATR for dynamic price targets.
- **Visuals**:
- Blue EMA line (optional).
- Teal bars for bullish conditions (optional).
- Orange labels for entry signals (optional).
- Yellow entry line and green dashed target line (optional).
- Price labels for entry/target (optional).
- ATR dashboard showing average ATR multiple, win %, and time-to-target (optional).
📘 How to Trade
- **Entry**: Go long when an orange label appears (price closes above Slingshot EMA after three closes below, with bullish EMAs on the 65-minute chart).
- **Target**: Aim for the green dashed line (entry price + ATR-based target).
- **Exit**: Close when bullish conditions end (EMAs not stacked or price below 65-minute 89 EMA).
- **Stop Loss**: Not included; consider 2× ATR below entry or a support level.
- **Alerts**: Enable “First Trending SlingShot” for entry notifications.
✨ Customize
Adjust in settings:
- 89 EMA timeframe (e.g., set to 65 minutes).
- Bar color (default: teal).
- Toggle EMA line, bar coloring, entry labels, lines, price labels, and dashboard.
- Slingshot EMA length (default: 4).
💡 Tips
- Backtest on the 65-minute timeframe for your asset.
- Combine with support/resistance or other indicators.
- Use proper risk management.
ICT 00:00, 08:30, 09:30 & 13:30 Opens (NY) — Prior-Day HistoryICT 00:00, 08:30, 09:30 & 13:30 Opens (NY)
This is a derivative of ALPHAICTRADER’s open-source script, republished under the MPL-2.0 with clear attribution and documented changes. It plots four New-York–anchored intraday reference levels—0000, 0830, 0930, 1330—as short, right-padded stubs with clean side labels. Use these time anchors (ICT-style midnight + key US windows) to frame bias, volatility pockets, and intraday trade locations.
What’s original in this version (changes)
Right-padded stubs instead of chart-wide rays — each level ends N bars past the latest candle (configurable).
Side labels at the line tip — text-only labels (0000, 0830, 0930, 1330) that sit at the right end of each stub and update every bar.
Optional prior-day history — show Today only or Today + Prior Day; older lines/labels auto-pruned.
Per-anchor controls — Display, Style, Color, Width, and Show Label for each time.
What it plots (and why)
0000 (NY Midnight): daily session anchor for bias/liquidity context.
0830 (NY): macro data window (CPI/NFP/claims) where volatility often concentrates.
0930 (NY): US cash equity market open; opening-drive structure/acceptance tests.
1330 (NY): early-afternoon anchor for continuation vs. fade.
How it works (under the hood)
Session detection: time("1", session, "America/New_York"); first bar flagged via not na(ts) and na(ts ).
Anchor price: open of that first bar per session/day.
Rendering: lines drawn with xloc=bar_index from start bar to bar_index + Right Pad; x2 updates every bar (no extend.right).
Labels: placed at line.get_x2(line) + Label Pad, soft color variant; updated per bar to stay on the tip.
History: arrays keep either today only or today + yesterday and delete anything older immediately.
How to use
Add to any intraday chart (futures/FX/indices). Anchors are always NY-time; TradingView handles DST.
Inputs
00:00 / 08:30 / 09:30 / 13:30 (NY): Display, Line Style, Color, Width, Show Label
Right Edge: Right Pad (bars) · Label Pad (bars)
History: Show Prior Day (History) — off = today only; on = today + yesterday
Suggested pads: Right Pad 2–5 bars; Label Pad 0–2.
These are context anchors, not signals. Combine with your execution model (market structure, liquidity, FVG/OBs, etc.).
Attribution & License (MPL-2.0)
Original work: “ICT NEW YORK MIDNIGHT OPEN AND 8.30 AM OPEN” by ALPHAICTRADER (MPL-2.0).
This derivative: modifications listed above; source published and kept under MPL-2.0 per license terms.
If you distribute a modified version of this Pine file, you must keep MPL-2.0, retain the copyright/licensing header, publish your modified source, and document your changes.
Notes: Pine v5. Minimalist (no day dividers). Educational tool; not financial advice.
Copyright: © ALPHAICTRADER 2022 · © Funk 2025
License: MPL-2.0

Panel Pro+ 3.4.8Panel Pro+ Perform commercial operations, based on price analysis and signal quality based on percentage

Continuous Partial Buying Signals v7.1🇬🇧 English Description: Continuous Partial Buying Signals v7.1
This indicator is built on a long-term accumulation philosophy , not a traditional buy-sell strategy. Its main purpose is to systematically increase your position in an asset you believe in by identifying significant price drops as buying opportunities. It is a tool designed for long-term investors who want to automate the "buy the dip" or "Dollar Cost Averaging (DCA)" mindset.
How It Works
The logic follows a simple but powerful cycle: Find a Peak -> Wait for a Drop -> Signal a Buy -> Wait for a New Peak.
1. Identifies a Significant Peak: Instead of reacting to minor price spikes, the indicator looks back over a user-defined period (e.g., the last 200 candles) to find the highest price. This stable peak (marked with an orange circle) becomes the reference point for the current cycle.
2. Waits for a Pullback: The indicator then calculates the percentage drop from this locked-in peak.
3. Generates Buy Signals: When the price drops by the percentages you define (e.g., -5% and -10%), it plots a "BUY" signal on the chart. It will only signal once per level within the same cycle.
4. Resets the Cycle: This is the key. If the price recovers and establishes a new significant peak higher than the previous one, the entire cycle resets. The new peak becomes the new reference, and the buy signals are re-armed, allowing the indicator to perpetually find new buying opportunities in a rising market.
How to Get the Most Out of This Indicator
* Timeframe: It is highly recommended to use this on higher timeframes (4H, Daily, Weekly) to align with its long-term accumulation philosophy.
* Peak Lookback Period:
* Higher values (200, 300): Create more stable and less frequent signals. Ideal for long-term, patient investors.
* Lower values (50, 100): More sensitive to recent price action, resulting in more frequent cycles.
* Drop Percentages: Adjust these based on the asset's volatility.
* Volatile assets (Crypto): Consider larger percentages like 10%, 20%.
* Less volatile assets (Stocks, Indices): Smaller percentages like 3%, 5%, 8% might be more appropriate.
This indicator is a tool for disciplined, emotion-free accumulation. It does not provide sell signals.

Above 8EMA & Premarket HighHow it works:
Plots 8 EMA (orange)
Tracks today’s premarket session high (purple line, 4:00–9:30 EST by default)
Background flashes green + 🚀 label appears when price is above both 8 EMA and premarket high
You can also add alerts:
Right-click the Above 8EMA & PreHigh condition.
Choose “Add Alert on Condition” → You’ll get notified when stocks trigger.

CP Double Hull CrossCakeProfits Double Hull Moving Average Signals
This indicator is a refined double Hull Moving Average system with integrated trend confirmation, cooldown suppression, alerts, and visual feedback.
🔹 Core Features
Double Hull Moving Averages (Fast & Slow) to identify precise crossovers.
Trend EMA filter (default 800 EMA) to align signals with higher-timeframe trend.
Signal Suppression / Cooldown to avoid back-to-back false signals (user-defined bars).
Long & Sort Labels plotted directly on the chart (Long = Go long, Short = Go Short).
Alerts ready for both bullish and bearish crossover confirmations.
Background Visuals (Toggle) – highlights active cooldown zones with soft green/red shades, easily switched ON/OFF.
🔹 How It Works
A Bullish Signal (Long) fires when the Fast Hull MA crosses above the Slow Hull MA, slope is confirmed, and price is above the trend EMA.
A Bearish Signal (Short) fires when the fast Hull MA crosses below the slow Hull MA, slope is confirmed, and price is below the trend EMA.
After a signal, the indicator enters a cooldown period (number of bars set by the user) where no new signals can appear, helping to reduce noise.
During cooldown, the chart background can be shaded (green for bullish, red for bearish) for quick visual confirmation.
🔹 Inputs
Hull MA Lengths (Slow & Fast)
Trend EMA Length & Source
Bars to Suppress Signals (cooldown)
Background Toggle & Colors
✅ Best used as a confirmation tool for entries/exits alongside broader strategy and risk management.
⚠️ Disclaimer: This script is for educational purposes only and not financial advice.

LSMAsThis indicator consists of three lines.
The main line (LSMA-A) is the least squares moving average (LSMA).
The second line (SMMA) is the smoothed moving average of the LSMA-A. When the SMMA crosses the LSMA-A below, it generates a BUY signal, while when it crosses the LSMA-A above, it is considered a SELL signal.
Furthermore, an uptrend is considered if the SMMA line is below, or a downtrend if it is above. Along these trend lines, the third line, LSMA-B (another shorter-period least squares moving average) is used to identify peaks and bottoms. This allows for wave analysis.
For optimization, adjusting the shorter period to market conditions is sufficient.

Dual Relative Strength FlexibleDual Relative Strength Flexible (RS1 & RS2)
This indicator calculates two Relative Strength (RS) values to compare a stock’s performance over two timeframes against different benchmarks.
Key Features:
RS1: Measures long-term relative strength of the stock versus a primary benchmark index (e.g., NIFTY).
RS2: Measures short-term relative strength which can be customized by the user to compare the stock against a sectoral index, NIFTY 500, NIFTY Total Market, or any other preferred index.
Zero Baseline: Displays neutral performance level for quick interpretation.
Color-coded plots to highlight outperformance (green hues) or underperformance (red hues).
Background shading: Green when both RS1 & RS2 are positive, red when both are negative.
Info Table: Shows current RS1, RS2 values, benchmark names, and their difference in percentage terms.
