Price Action Pattern Breakout Strategy: Wedge,Triangle,ChannelIntroducing the Price Action Pattern Breakout Strategy: Wedge,Triangle,Channel 💹🚀
The "Price Action Pattern Breakout Strategy: Wedge, Triangle, Channel" is a dynamic and automated trading strategy that excels in recognizing and capitalizing on breakout opportunities within the realm of powerful price action patterns. It is finely tuned to achieve exceptional precision in detecting three distinct pattern types: Wedge, Triangle, and Channel. This diversity equips you to confidently navigate a wide range of market scenarios and opportunities.
This strategy automates trade entries and exits upon confirmed pattern breakouts, this eliminates human errors in correctly recognizing patterns and prevents emotional decisions. This strategy is designed to work across different time frames, making it suitable for both short-term and long-term traders. Whether you're a day trader, swing trader, or investor, this strategy provides the flexibility you need to thrive in diverse market conditions.
💎 How it Works:
▶️ In this strategy, three price action patterns have been utilized, one of which is the "Wedge" pattern. The Wedge pattern has consistently demonstrated a high level of credibility, typically resulting in sharp and rapid price movements following a confirmed breakout from this pattern. This characteristic makes the Wedge pattern highly noteworthy in our strategy. The second pattern is the "Triangle" pattern, which, depending on its formation, whether ascending or descending, can indicate a strong continuation or reversal of the trend. The last pattern is the "Channel" pattern. The reason for using the Channel pattern is its versatility in various market conditions and its tendency to produce reliable results.
In the snapshot below, you can observe the types of patterns that this strategy is capable of identifying at a glance:
▶️ This strategy employs two types of targeting systems: Fixed Targets and Trailing Targets.
Fixed Targets is the default targeting system of the strategy, incorporating two primary targets: TP1 (Target Point 1) and TP2 (Target Point 2). These targets are thoughtfully adjusted in alignment with specific rules for each pattern. With Fixed Targets, you have the flexibility to designate the position size percentage for your exits at TP1 and TP2. For instance, should you opt to allocate 60% of your position size to TP1, as soon as the price triggers the first take profit level, 60% of your initial position is gracefully closed, leaving the remaining 40% to exit the trade upon reaching TP2.
Trailing Targets represent the strategy's alternative targeting system. With this system, the trailing stop becomes active once the price reaches the specified trigger point. The strategy then exits the trade based on the defined offset percentage and price retracement from the trailing limit.
▶️ This strategy relies on a single type of stop loss, determined by previous pivot points and adjusted based on the trade's direction, whether long or short, placing the stop loss above or below the prior pivot. This stop loss approach has demonstrated reliability when used alongside price action patterns.
In addition to this fixed stop loss, you can specify a percentage buffer, offering protection against potential stop hunting due to market fluctuations. This buffer helps protect your positions from sudden price swings. For example, selecting a 1% buffer means your stop loss will be positioned 1% higher or lower concerning the last pivot, depending on your trade's direction. This added layer of security ensures your trades remain resilient and less vulnerable to market volatility.
▶️ A practical feature of this strategy is the "Risk-Free" option. Once activated, it continuously monitors price movements, and as soon as the price progresses in the trade's direction and surpasses the designated Risk-Free Trigger Point in percentage, the stop loss is dynamically shifted from its initial position to the entry price, effectively making the trade "risk-free." This means that if the trade doesn't go as expected, we exit at the entry point, incurring neither profit nor loss from the trade.
Additionally, you have the flexibility to fine-tune the modified stop loss, positioning it slightly above or below the entry price through the configuration of a specified percentage. This allows for effective consideration of commission fees in your trading strategy.
▶️ Risk management is a crucial concept in trading, playing a significant role in a trader's long-term success. This strategy introduces a unique feature called "Fixed Loss Position Sizing", where upon activation, you can limit the risk exposure to a specified percentage of your capital per trade. Set your preferred risk percentage along with the intended leverage. The strategy independently considers your available capital and designated leverage, determining the position size before executing any trade.
In the case of a stop loss, your loss is limited to the specified risk percentage. For instance, with a $1000 account and a 1% risk set, the strategy adjusts each trade's size to ensure a maximum loss of $10 if the stop loss is triggered. Enabling this feature will ensure disciplined risk management, aligning potential losses precisely with your predetermined risk percentage, contingent upon your total available capital.
▶️ Another feature of this strategy is a sophisticated mechanism called "Loss Compensation". When enabled, Loss Compensation dynamically adjusts the position size after a loss, aiming to recover from previous losses in subsequent trades. This adaptive mechanism continually modifies the position size to mitigate the impact of consecutive losses until reaching a user-defined limit for consecutive loss compensations.
The feature's configurability allows users to set the maximum number of consecutive losses to compensate for and also includes an option to factor in trading fees from prior trades into the compensation calculation. Loss Compensation operates in conjunction with the 'Fixed Loss Position Sizing' setting, ensuring that once losses are sufficiently compensated, subsequent entries revert to the predefined configurations within the 'Fixed Loss Position Sizing' settings.
This advanced tool ensures a stable risk management approach by changing trade sizes dynamically according to past results during consecutive loss periods.
▶️ This strategy incorporates a feature known as the "Counter-Pattern Breakout", altering its approach to wedge, triangle, and channel pattern breakouts. Normally, the strategy relies on standard pattern signals to determine whether to enter long or short positions based on breakout directions.
For example, in an ascending channel or a rising wedge pattern, the strategy typically seeks a short position opportunity upon a confirmed breakout in the lower line, and breakouts from the upper line are disregarded by the strategy. But with this feature enabled, strategy disregards the conventional pattern signals, seizing breakouts from upper or lower lines to open corresponding positions. For instance, in the ascending channel or the rising wedge pattern example, the strategy might enter a long position if the upper line breaks or a short position if the lower line breaks.
This introduces a more adaptive and opportunistic trading style, allowing you to capitalize on price movements, irrespective of the typical signal direction indicated by the pattern.
▶️ This strategy is fully compatible with third-party trading bots, allowing for easy connectivity to popular trading platforms. By leveraging the TradingView webhook functionality, you can effortlessly link the strategy to your preferred bot and receive accurate signals for position entry and exit. The strategy provides all the necessary alert message fields, ensuring a smooth and user-friendly trading experience. With this integration, you can automate the execution of trades, saving time and effort while enjoying the benefits of this powerful strategy.
⚙️ How to Use & Configure User Settings:
To fully utilize the "Price Action Pattern Breakout Strategy: Wedge, Triangle, Channel," it's essential to consider and comprehend the following steps. They play a crucial role in enhancing its functionality and achieving its utmost potential outcomes:
1. General Strategy Settings:
Enable Dark Mode if using a dark TradingView theme for improved chart visibility.
Select the Strategy's Trade Direction: Long, Short, or Both.
Choose Pattern Recognition Accuracy: High for precise recognition but fewer positions, Low for more positions with slightly less accuracy.
Enable 'Prevent New Entry on Opposite Signal While In Position' to avoid new trades if the opposite signal occurs.
Switch to Indicator Mode if solely using the strategy as an indicator or in combination with other strategies.
2. Pattern and Pivot Configuration:
Consider configuring the Number of Patterns and Pivot Lookback Lengths. Here, you can personalize the pivot lookback lengths for wedge, triangle, and channel patterns across eight different settings on your chart. For lower time frames, consider larger lengths to reduce chart noise. Alternatively, to maintain clarity on your chart, you can disable multiple patterns with different lengths while ensuring at least one pattern remains enabled.
Note that enabling more patterns doesn't always equate to increased potential profit. Sometimes, fewer patterns result in greater profit potential, and vice versa. Experiment with lengths and the number of patterns to determine the most profitable and optimal outcome for your trading symbol and timeframe.
3. Targeting System Selection:
Choose between 'Fixed Targets' or 'Trailing Targets' for your targeting system.
'Fixed Targets' is the default setting, operational when 'Trailing Targets' are turned off.
Set the TP1 Position Size as a percentage, defining the size for TP1, and the rest exits at TP2.
Optionally activate 'Skip Entry if TP1 is Passed' to bypass entering positions if the price has exceeded TP1.
Alternatively, opt for the 'Trailing Target' for dynamic exits based on trigger points and offsets. Note that this option disables fixed targets.
4. Stop Loss Configuration:
Determine the number of candles to consider for stop loss placement based on the last pivot.
Optionally add a percentage to the stop loss to create a buffer against market fluctuations, guarding your positions from sudden price swings.
5. Risk Management Configuration:
You can activate the 'Risk-Free' feature, making your trades risk-free by moving the stop loss to the entry price upon reaching a specified trigger point.
You have the possibility to enable 'Fixed Loss Position Sizing' to limit risk to a percentage of total capital per trade, ensuring prudent risk management.
You can employ 'Use Real-Time Balance for Each Entry' to precisely calculate fixed loss position sizing according to the real-time balance for every entry.
The 'Loss Compensation' feature can be activated to automatically adjust trade sizes during consecutive losses and compensate for prior incurred losses.
Loss compensation continues adjusting trade sizes until it reaches the defined limit of consecutive losses specified in the 'Maximum Consecutive Losses To Compensate' field.
You can factor in commission fees by specifying a percentage in the 'Include Trading Fees in Compensation (%)' field, providing an option for more accurate loss compensation calculations.
You have the option to enable 'Limit Compensation to Real-Time Balance' to prevent consecutive loss compensation from exceeding your current real-time account balance.
It's important to note that for the 'Loss Compensation' feature to operate, the 'Fixed Loss Position Sizing' must be enabled.
6. Counter-Pattern Breakout Configuration:
In this section you have the option to enable the "Counter-Pattern Breakout" feature to adjust the strategy's approach to wedge, triangle, and channel pattern breakouts. Once enabled, the strategy disregards traditional pattern signals and capitalizes on breakouts from either the upper or lower lines, initiating corresponding positions accordingly.
Choose between 'Fixed Target' or 'Trailing Target' for your targeting system. If you opt for the 'Fixed Target', set a specific target point as a percentage, serving as the default target for counter-pattern breakouts. Alternatively, choose the 'Trailing Target' for dynamic exits based on trigger points and offsets. Do keep in mind that selecting the 'Trailing Target' option disables the fixed target setting.
Keep in mind that for standard, non-counter-pattern breakouts, the target point settings in their respective sections remain applicable, distinct from the settings configured for targeting within this section.
Note that the stop loss configurations are shared across standard pattern and counter-pattern breakouts and can be adjusted within the stop loss section.
7. Info Tables:
In the info tables section, you can show or hide different tables on the charts. This includes the backtest table, the current balance table displaying available funds, and a table showcasing Maximum Consecutive Wins or Losses. Choose which to display according to your preferences and specific needs.
8.Date & Time Range Filter:
Utilize the Date & Time Range filter feature to precisely select a start and end date, including time, to filter data within the chosen range.
When connecting this strategy to a trading bot for automated trades, ensure to set the start date and time to the intended initiation moment to avoid undesired outcomes as this directly affects the real-time balance calculations of the strategy.
8. Integration with Third-Party Bots:
To automate trading, leverage the strategy's compatibility with third-party trading bots. Seamlessly integrate the strategy into well-known trading platforms by using alert message fields to input commands from third-party trading bots, enabling automated trade execution for both long and short positions.
By furnishing these adjustable settings, the strategy empowers you to personalize it according to your unique requirements, thereby bolstering the adaptability and efficacy of your trading approach.
🔐 Source Code Protection:
The 'Price Action Pattern Breakout Strategy: Wedge, Triangle, Channel' source code is engineered for precision, reliability, and effectiveness. Its original and innovative design warrants protection and restricted access, preserving the strategy's exclusivity. Safeguarding the code maintains the strategy's integrity and distinctiveness, providing users with a competitive advantage in their trading endeavors.
Trend Analysis

Crypto Market Strategy (CMS)/Introduction
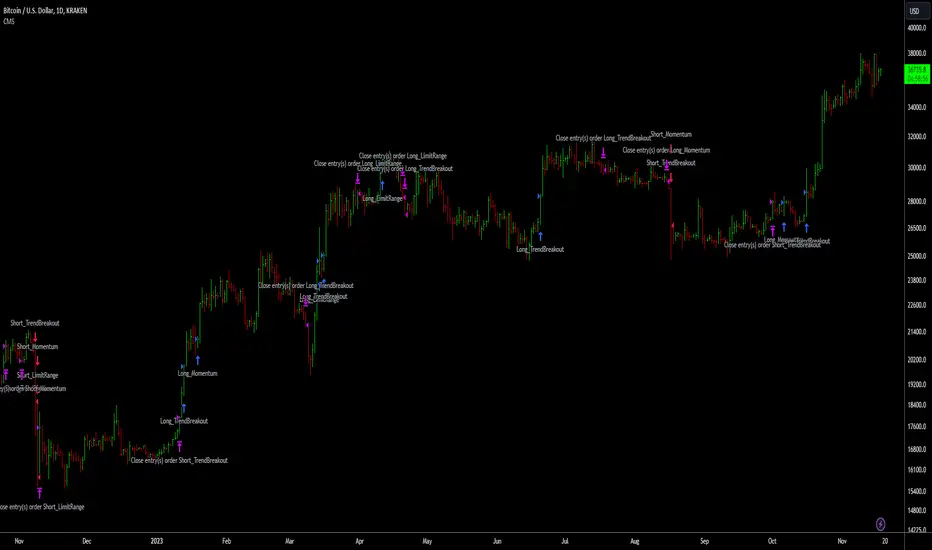
The Crypto Market Strategy (CMS) is a composite strategy for the cryptocurrency market. It integrates multiple strategies (called signals) to ensure you are exploiting multiple patterns/anomalies in the market.
/Signals
The three distinct strategies, each providing signals based on specific market conditions are explained below:
1. Limit Range: This signal targets stable market periods, triggering signals based on micro breakouts in price. The market during this period is described as stable because of the short lookback period required for breakout, four bars is the default.
2. Trend Breakout: This signal seeks to capitalize on significant market movements following consolidation periods, it triggers when large price breakouts occur. The market during this period is described as volatile because of the long lookback period required for breakout, forty bars is the default.
3. Momentum: After breakouts, price uptrends may persist for a long time, typically weeks to months. This signal captures long term trends.
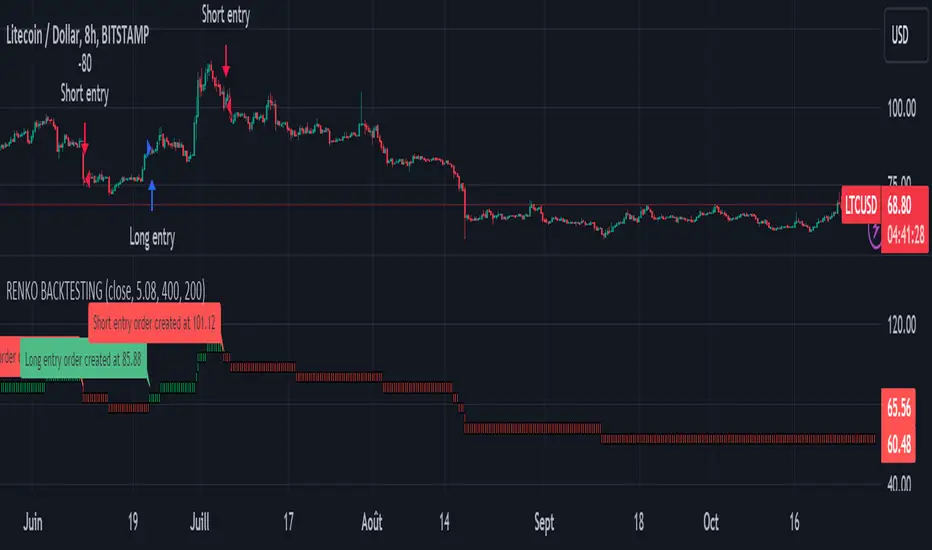
An upward blue arrow signifies a long entry signal, a downward red arrow indicates a short entry signal, while an upward/downward pink arrow indicates an exit signal. All signals will have a label indicating the triggering strategy and number of units (this can be disabled in the style settings).
/Construction
The strategy is constructed using minimal indicators, it is basically price action and moving averages.
/Settings
The settings are organised according to the signals;
1. Limit range
Entry - This is the size of breakout
+Exit - Closes the trade in profit
-Exit - Closes the trade to minimise loss
2. Trend breakout
Entry - This is the size of the breakout
Exit - Closes the trade to minimise loss
3. Momentum
Entry - This determines how quickly a signal is triggered
Lookback - This is the duration considered for the entry
/Results
The backtest results are based on a starting capital of $13,700 (convenient amount for retail traders) with 5% of equity for the position size and pyramiding of 3 consecutive positions because there are three signals. Commissions vary from broker to broker with some charging zero commissions, so commissions is set to an exorbitant $3 per order to ensure profitability in backtests is reproducible in live trading. Slippage of 3 ticks is used to ensure the results are representative of real world, market order, end-of-day trading. The backtest results are available to view at the bottom of this page.
Note:
Past performance in backtesting does not guarantee future results. Cryptocurrency markets are particularly volatile, and individual execution and market changes can significantly affect strategy performance. Price data may also vary across exchanges.
/Tickers
CMS has been backtested primarily on BTCUSD. It also performs well on ETHUSD.
IchiBot - [SigmaStreet]
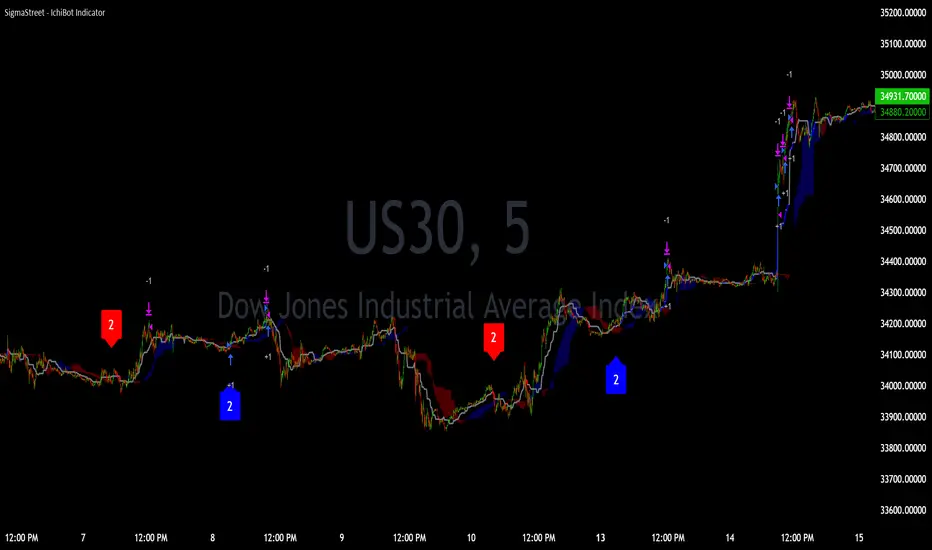
The IchiBot Indicator has been used to develop automated trading systems. It leverages the open-source Ichimoku framework provided by Trading View, to enable users to creatively generate over 1 trillion different combinations of trading conditions with the use of multiple timeframes to create unique “signal labels” that can be used to create custom strategies or provide in depth market analysis. At the end of this description, I have provided an example of input settings for a simple scalping strategy that I have back tested on US30 on the 5 minute timeframe.
Overview of the Settings:
The visuals section includes an option to show or hide certain parts of the indicator and change the size of the signal labels plotted on the chart.
Next to the “Signal color on baseline/candles” section, you can choose if you want to see additional signals generations from the most previous plotted label on a color changing baseline, or color changing candles. A color change from gray to blue/red indicate that the conditions from the most previously plotted signal label have been met again.
The next 5 sections are all related to the strategy portion of the indicator, used to aid in the back testing process. These sections are titled “Stop loss”, “Take Profit”, “Trail Stop”, “Trade Settings” and “Trade Schedule”.
The Stop Loss section includes an option to choose between value of “pts”, “atr” (average true range) or “None”. The stop loss value in “pts” is simply a specified number of points or pips from the current entry price of a trade that are input in the “SL” section. If the stop loss type is “atr” the “SL” section is not used and the value is calculated and displaced from the current entry price of a trade based on the atr period multiplied by the atr multiplier.
The take profit section is based on the same logic as the stop loss.
The Trail Stop section includes an option to choose between values “pts” or “None”. If the Trail Stop value is “pts”, a trailing stop loss is activated if a trade moves a point value into profit that exceeds the value of the “Trail Activation”. If the Trail Offset type is “pts”, the trailing stop loss is placed a point value away from the current price that is equal to the “Trail Offset” value.
The trade settings section has two options to either prevent or allow trade reversals and prevent or allow only 1 trade per signal label.
If the “Don’t allow trade reversals” is on, then a currently active trade can not be cancelled by an opposite trade signal. It can only be cancelled by the exit logic selected in the above sections. If the “One trade per signal” is selected, the strategy will only enter a trade if the most recent signal label is different from the last signal label where a trade was entered, or if the most recent signal label is in the opposite direction of the most recent signal label where a trade was entered.
The trade schedule section includes an option to only generate signal labels during the specified time. You can choose between 24/7 which will generate signals without any time restriction, or you can choose a custom time which is based on the America / New York time zone.
The timeframe settings section includes an option to choose “single” or “multiple” timeframes, as well as an option to show every signal label combination (“all”), or only the signal labels with the highest numerical value (“absolute”).
If you select “single” next to “timeframe”, the indicator will show you labels based on trade conditions met from only 1 selected timeframe. If you select “multiple” next to “timeframe”, the indicator is designed to return signal labels based on trade conditions that have been met on at least 2 different timeframes.
If you select “multiple” and “use current timeframe”, the indicator will include labels that always include a minimum of 2 timeframes where 1 timeframe is always the current timeframe. If you unselect the “use current timeframe”, the indicator will include labels with a minimum of 2 timeframes.
If you select “multiple” next to “timeframe” and “all” next to “Show all/absolute labels”, the indicator will show you every possible combination of labels that vary from trade conditions met on a minimum of 2 timeframes, to the maximum number of timeframes selected.
If you select “multiple” next to “timeframe” and “absolute” next to “Show all/absolute labels”, the indicator will only show you labels where the numerical value is equivalent to the maximum number of timeframes selected.
Each signal label provides a number which refers to the number of timeframes used to generate the label, offering insights briefly. Hover over a label to reveal detailed tooltip information that details the exact timeframes used to generate each label.
You can choose all from “Show all/absolute labels” to see every possible combination of trade signals or “absolute” to only see labels that have the highest possible numerical value. Absolute means that every condition selected from every timeframe was calculated to be true at the same time on the same candle.
The next 8 sections are “Current timeframe trade conditions”, “1-minute timeframe trade conditions”, “5-minute timeframe trade conditions”, “15-minute timeframe trade conditions”, “30-minute timeframe trade conditions”, “1-hour timeframe trade conditions”, “4-hour timeframe trade conditions”, “Daily timeframe trade conditions”.
These sections include the same 10 trade conditions, that can be used independently, or in combination with each other. This brings the total number of trade conditions to 70.
The final section includes a standard option to adjust the current Ichimoku values.
Understanding the Calculations:
The term “future” refers to a value that is calculated 26 candles to the right of the most recent closing price.
The term “current” refers to a value that is calculated on the most recent closing price.
The term “past” refers to a value that is calculated 26 candles to the left of the most recent closing price.
Bullish is referred to as “blue” and bearish is referred to as “red”.
Buy Signals:
1. The current closing price is greater than the current cloud value.
2. The future cloud is blue.
3. The current closing price is greater than the current conversion line.
4. The current conversion line is greater than the current baseline.
5. The lagging span is greater than the closing price of the last 25 candles.
6. The lagging span is greater than the past cloud.
7. The lagging span is greater than the past conversion line and the past baseline.
8. The current conversion line is greater than the current cloud.
9. The current baseline is greater than the current cloud.
10. The value of the current cloud to the future cloud is completely blue.
Sell Signals:
1. The current closing price is less than the current cloud value.
2. The future cloud is red.
3. The current closing price is less than the current conversion line.
4. The current conversion line is less than the current baseline.
5. The lagging span is less than the closing price of the last 25 candles.
6. The lagging span is less than the past cloud.
7. The lagging span is less than the past conversion line and the past baseline.
8. The current conversion line is less than the current cloud.
9. The current baseline is less than the current cloud.
10. The value of the current cloud to the future cloud is completely red.
The script enables users to access the value of these 10 trade conditions across the 7 major time frames (1-minute, 5-minute, 15-minute, 30-minute, 1-hour, 4-hour, Daily, and the current charts time frame) by using the official non repainting request security function provided by Trading View:
f_secSecurity(_src, _res, _exp) =>
request.security(_src, _res, _exp )
This indicator provides up to 70 variables (10 variables X 7 timeframes) that can be used separately, or in combination to generate signal labels.
Enhance your visual analysis with a color-changing baseline and candle colors that adapt to signal shifts, offering an immediate understanding of market trends. The base line will change from gray to blue/red which will reference the most previously plotted signal label. This change in color indicate that the conditions from the most recently plotted signal label have been met once again. Please refer to the example below.
Adjustments to the Ichimoku Indicator:
The script uses a slightly refined version of the Ichimoku indicator to calculate 10 different “trade conditions”. Each trade condition can create 1 bullish signal label and 1 bearish signal label. The calculations are primarily based on “greater than and less than logic” which is standard for signal generation.
In the original Ichimoku calculations, the “Lagging Span” has a default value of 26 periods. In the actual calculations, this input with the title “Lagging Span” is referred to as the “displacement”. When the lagging span is plotted on the chart, it is plotted with an offset value of offset = -displacement + 1 which technically plots the lagging span 25 candles to the left the most recent candle (if you count the most recent closing price as 0 and not 1). The clouds are plotted with an offset of offset = displacement -1 which technically plots the clouds 25 candles to the right of the most recent candle.
I have adjusted the logic of the Ichimoku indicator so the lagging span is still plotted 25 candles to the left of the most recently confirmed candle close, but the cloud is plotted 26 candles to the right of the most recent confirmed candle close.
This seemingly small adjustment of one candle cannot simply be adjusted in the settings of the original Ichimoku indicator since the calculations of the cloud and lagging span displacements are directly affected by the same value (displacement = 26, also known as the “lagging span”). My script is adjusted to make calculations where the lagging span is 25 candles to the left of the most recent candle, and the cloud is displaced 26 candles to the right of the most recent candle.
For example, my scripts logic to detect if the current closing price is over the current cloud is (close > leadLead1 and close > leadLine2 and leadLine1 > leadLine2 . By using a lookback of , the logic assumes that the displaced value is 26 bars to the right of the most recent candle. My script also reflects this logic in the plotted values of the cloud where the offset values are offset = displacement. This adjustment is made without affecting any other part of the Ichimoku indicators calculations, only the displacement of the cloud which directly affects the logic of trade conditioins. This change is a deliberate and necessary function of this script’s logic to generate trade conditions and signal labels.
I’ve removed the conversion line and the lagging span and introduced a 26-period pivot high/low to provide a less cluttered chart. The pivot high/low looks 26 periods to the left and only 1 period to the right. The lagging span and conversion line logic is still built into the framework of the trading signals. If you choose to enable the lagging span, or conversion line.
trading approach, and always test your strategies thoroughly.
The function to generate the "Signal Labels" calculates every single possible combination of the 7 different timeframes which is a total of 127 combinations for bullish signal labels, and 127 combinations for bearish signal labels. This function also provides the necessary criteria for the strategy entry conditions, based on the dynamically calculated values derived from the signal labels themselves. For example: "buy signal on 1 minute and 5 minute timeframe" is considered 1 combination, and "Buy signal on current, 5 minute, 15 minute, 30 minute, 1 hour, 4 hour and daily timeframe" is also considered 1 combination. There are a total of 254 combinations between buy and sell signal labels along with 254 individual variables with their own unique tool tip description. The signal label function alone spans over 1340 lines of code (minus spaces and comments) to specifically account for every possible variable combination. This unique and original function also calculates the signal label "value" which is the number you see on the signal label. This function adjusts the amount of labels plotted, the value and description of all labels based on the timeframe settings "single"/"multiple", the use of "use current timeframe" setting, and the "trade schedule". This signal label function has been a landmark piece of code for me in my endeavor to create and optimize my strategies based on its ability to provide an in depth analysis of the timeframes used when generating signal labels. This function is main reason that this script has been published closed source.
Back tested results.
The current results are from US30 (Dow Jones Industrial Average CFD) on the 5-minute timeframe using regular candles. The inputs are as follows:
Stop loss = 5000 pts
No take profit.
Trail activation = 100 pts
Trail offset = 100 pts
Don’t allow trade reversals
Trade 24/7
Timeframe = multiple
Show absolute signals
Use current timeframe, lag span over/under candles
Use 30m timeframe, all cloud is bull/bear
Initial capital = $10,000 USD, 1 contract, $0.07 per contract, slippage = 3 ticks, use bar magnifier = on
Timeframe = June 1st, 2023 – November 10th, 2023, risk = 5% (greatest loosing trade = $500.44)
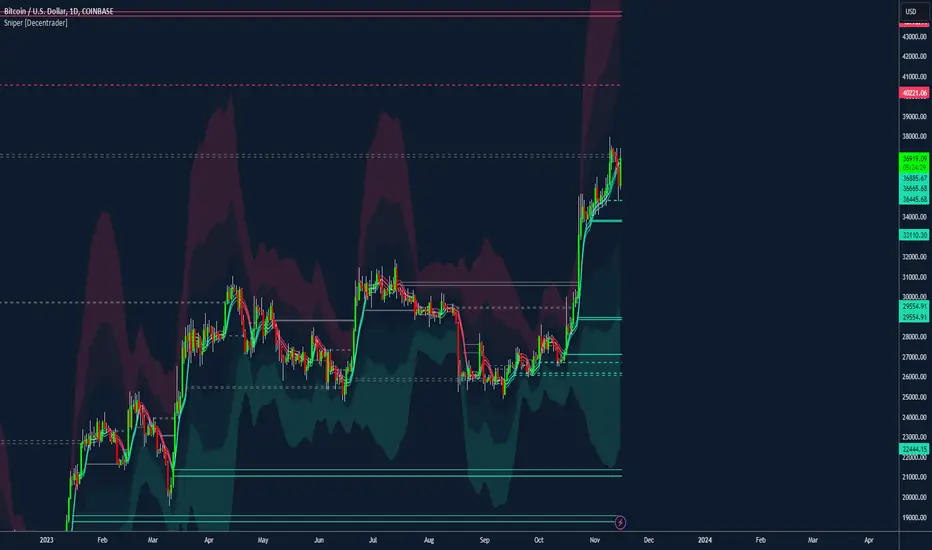
Sniper [Decentrader]Bespoke Decentrader Mean Reversion / Colume based support/resistance Strategy builder.
Colour-coded mean line using price and volume
Volatility Bands (chose % or Std Dev)
Major support and resistance plotted lines
Suggested dynamic hard-stop placement
Built for all markets
A realistic strategy for multi-asset portfolio management
Complementary components to assist other indicators/strategies
Filtering for Long / Short only conditions is possible under settings.
Can be automated by including 3rd party code into the settings to be used as alerts.
Use the Mitigate lines to show previous areas of support or resistance, which have been broken.
4 main strategy options:
1. You can choose whether to enter based on the upper or lower Meanline. If the price is below the Meanline, the lower Meanline will be used for entry, while if the price is above the Meanline, the upper Meanline will be used. If you want to use this condition to exit the position, you also need to select the "Exit at the Meanline" option as well.
2. If the selected strategy is "3. Buy/Sell Volatility Bands," you can specify which Band should trigger the position to open. The price must touch or cross the edge of the chosen Band. Additionally, if the "Exit at the Volatility Bands" option is selected, the same Band will be used for the exit criteria.
3. Buy/Sell Meanline retest": A position will be opened when the price retests the Meanline. The price must touch or wick through the Meanline without closing below/above it. (If this strategy is combined with "Exit at the Meanline" option, then in case price goes against our position, the strategy will exit if the price closes under/above the meanline
Buy/Sell Meanline breakout (UP/DOWN)": A long or short position will be opened when the price breaks above or below the Meanline
4. Buy/Sell Support/Resistance lines": A position will be opened when the price touches the support or resistance lines. This option can also be combined with the "Exit at the Meanline" option.
This tool can be used to help enter a trending asset or find entries for an asset retracing.
Please take care to test strategies before automation, which is also possible.
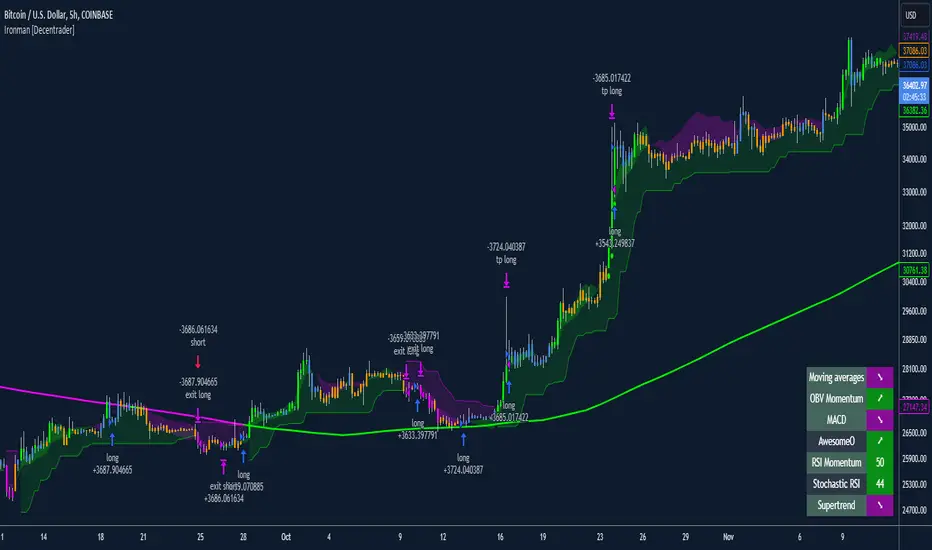
Ironman [Decentrader]Ironman
What is it? how it does it? And how to use it:
i) Ironman is a multifaceted strategy builder, which uses coloured candles which represent certain customisable inputs being in confluence with one another and the set scenario.
ii) There are 7 customised technical indicators which can be input as a basis for the analytical review.
iii) Determine a primary indicator which dictates a bullish or bearish trend (and colour) and then optionally add up to 6 other indicators to be required to be in confluence which adds another colour to be represented.
An example might be two moving averages crossing as the main trend determination. The primary determinant is dictated as the trend being “bullish or bearish” and the added confluence adds an additional layer being “very bullish or very bearish”
iv) Users select which conditions they wish to enter and exit trades on using the Bullish / Very Bullish and Bearish / Very Bearish settings. This can be combined with other timeframes.
v) The selected inputs for each indicator will show in a table contained in the bottom right-hand corner. Active indicators within the system will be highlighted.
vi) Ironman is built to include various take profit and stop loss options such as trailing stops, and fixed percentage targets which can be included in the strategy. Different timeframes can be used to determine the stop if users wish to do so.
vii) Users can require that there is also confluence with a differing time period or choose long and short-only options which can be dictated independently or based upon filtering criteria using moving averages.
viii) Using the strategy settings, users are also able to choose backtesting periods.
ix) Position label settings allow users to show various backtesting options such as profit by position, total backtesting results and results for the active position.
x) Ironman enables users to automate trading easily using the input boxes under Alert messages which also allows connection to a third party which can conduct execution. Always make sure to thoroughly test the strategy if it is being automated.
xi) To get the best out of Ironman, build up a strategy for the timeframe and asset you are looking at and back-test outcomes as variables are layered in. Ensure to backtest over a suitable length of time.
xii) When optimising input variables, it can sometimes visually assist in having the underlying inputs on the screen via the standard indicators.
xiii) There are many boxes of information in the input variables, which explain how to use each part. Users can also add features such as a marker showing on the chart where all indicators are bullish/bearish, or where RSI is overbought / over sold.
xiv) Users can further customise the style of the tool under the style tab in the indicator settings.
Rate of Change StrategyRate of Change Strategy :
INTRODUCTION :
This strategy is based on the Rate of Change indicator. It compares the current price with that of a user-defined period of time ago. This makes it easy to spot trends and even speculative bubbles. The strategy is long term and very risky, which is why we've added a Stop Loss. There's also a money management method that allows you to reinvest part of your profits or reduce the size of your orders in the event of substantial losses.
RATE OF CHANGE (ROC) :
As explained above, the ROC is used to situate the current price compared to that of a certain period of time ago. The formula for calculating ROC in relation to the previous year is as follows :
ROC (365) = (close/close (365) - 1) * 100
With this formula we can find out how many percent the change in the current price is compared with 365 days ago, and thus assess the trend.
PARAMETERS :
ROC Length : Length of the ROC to be calculated. The current price is compared with that of the selected length ago.
ROC Bubble Signal : ROC value indicating that we are in a bubble. This value varies enormously depending on the financial product. For example, in the equity market, a bubble exists when ROC = 40, whereas in cryptocurrencies, a bubble exists when ROC = 150.
Stop Loss (in %) : Stop Loss value in percentage. This is the maximum trade value percentage that can be lost in a single trade.
Fixed Ratio : This is the amount of gain or loss at which the order quantity is changed. The default is 400, which means that for each $400 gain or loss, the order size is increased or decreased by an amount chosen by the user.
Increasing Order Amount : This is the amount to be added to or subtracted from orders when the fixed ratio is reached. The default is $200, which means that for every $400 gain, $200 is reinvested in the strategy. On the other hand, for every $400 loss, the order size is reduced by $200.
Initial capital : $1000
Fees : Interactive Broker fees apply to this strategy. They are set at 0.18% of the trade value.
Slippage : 3 ticks or $0.03 per trade. Corresponds to the latency time between the moment the signal is received and the moment the order is executed by the broker.
Important : A bot has been used to test the different parameters and determine which ones maximize return while limiting drawdown. This strategy is the most optimal on BITSTAMP:BTCUSD in 1D timeframe with the following parameters :
ROC Length = 365
ROC Bubble Signal = 180
Stop Loss (in %) = 6
LONG CONDITION :
We are in a LONG position if ROC (365) > 0 for at least two days. This allows us to limit noise and irrelevant signals to ensure that the ROC remains positive.
SHORT CONDITION :
We are in a SHORT position if ROC (365) < 0 for at least two days. We also open a SHORT position when the speculative bubble is about to burst. If ROC (365) > 180, we're in a bubble. If the bubble has been in existence for at least a week and the ROC falls back below this threshold, we can expect the asset to return to reasonable prices, and thus a downward trend. So we're opening a SHORT position to take advantage of this upcoming decline.
EXIT RULES FOR WINNING TRADE :
The strategy is self-regulating. We don't exit a LONG trade until a SHORT signal has arrived, and vice versa. So, to exit a winning position, you have to wait for the entry signal of the opposite position.
RISK MANAGEMENT :
This strategy is very risky, and we can easily end up on the wrong side of the trade. That's why we're going to manage our risk with a Stop Loss, limiting our losses as a percentage of the trade's value. By default, this percentage is set at 6%. Each trade will therefore take a maximum loss of 6%.
If the SL has been triggered, it probably means we were on the wrong side. This is why we change the direction of the trade when a SL is triggered. For example, if we were SHORT and lost 6% of the trade value, the strategy will close this losing trade and open a long position without taking into account the ROC value. This allows us to be in position all the time and not miss the best opportunities.
MONEY MANAGEMENT :
The fixed ratio method was used to manage our gains and losses. For each gain of an amount equal to the value of the fixed ratio, we increase the order size by a value defined by the user in the "Increasing order amount" parameter. Similarly, each time we lose an amount equal to the value of the fixed ratio, we decrease the order size by the same user-defined value. This strategy increases both performance and drawdown.
NOTE :
Please note that the strategy is backtested from 2017-01-01. As the timeframe is 1D, this strategy is a medium/long-term strategy. That's why only 34 trades were closed. Be careful, as the test sample is small and performance may not necessarily reflect what may happen in the future.
Enjoy the strategy and don't forget to take the trade :)

Multi-TF AI SuperTrend with ADX - Strategy [PresentTrading]
## █ Introduction and How it is Different
The trading strategy in question is an enhanced version of the SuperTrend indicator, combined with AI elements and an ADX filter. It's a multi-timeframe strategy that incorporates two SuperTrends from different timeframes and utilizes a k-nearest neighbors (KNN) algorithm for trend prediction. It's different from traditional SuperTrend indicators because of its AI-based predictive capabilities and the addition of the ADX filter for trend strength.
BTC 8hr Performance
ETH 8hr Performance
## █ Strategy, How it Works: Detailed Explanation (Revised)
### Multi-Timeframe Approach
The strategy leverages the power of multiple timeframes by incorporating two SuperTrend indicators, each calculated on a different timeframe. This multi-timeframe approach provides a holistic view of the market's trend. For example, a 8-hour timeframe might capture the medium-term trend, while a daily timeframe could capture the longer-term trend. When both SuperTrends align, the strategy confirms a more robust trend.
### K-Nearest Neighbors (KNN)
The KNN algorithm is used to classify the direction of the trend based on historical SuperTrend values. It uses weighted voting of the 'k' nearest data points. For each point, it looks at its 'k' closest neighbors and takes a weighted average of their labels to predict the current label. The KNN algorithm is applied separately to each timeframe's SuperTrend data.
### SuperTrend Indicators
Two SuperTrend indicators are used, each from a different timeframe. They are calculated using different moving averages and ATR lengths as per user settings. The SuperTrend values are then smoothed to make them suitable for KNN-based prediction.
### ADX and DMI Filters
The ADX filter is used to eliminate weak trends. Only when the ADX is above 20 and the directional movement index (DMI) confirms the trend direction, does the strategy signal a buy or sell.
### Combining Elements
A trade signal is generated only when both SuperTrends and the ADX filter confirm the trend direction. This multi-timeframe, multi-indicator approach reduces false positives and increases the robustness of the strategy.
By considering multiple timeframes and using machine learning for trend classification, the strategy aims to provide more accurate and reliable trade signals.
BTC 8hr Performance (Zoom-in)
## █ Trade Direction
The strategy allows users to specify the trade direction as 'Long', 'Short', or 'Both'. This is useful for traders who have a specific market bias. For instance, in a bullish market, one might choose to only take 'Long' trades.
## █ Usage
Parameters: Adjust the number of neighbors, data points, and moving averages according to the asset and market conditions.
Trade Direction: Choose your preferred trading direction based on your market outlook.
ADX Filter: Optionally, enable the ADX filter to avoid trading in a sideways market.
Risk Management: Use the trailing stop-loss feature to manage risks.
## █ Default Settings
Neighbors (K): 3
Data points for KNN: 12
SuperTrend Length: 10 and 5 for the two different SuperTrends
ATR Multiplier: 3.0 for both
ADX Length: 21
ADX Time Frame: 240
Default trading direction: Both
By customizing these settings, traders can tailor the strategy to fit various trading styles and assets.

2 Moving Averages | Trend FollowingThe trading system is a trend-following strategy based on two moving averages (MA) and Parabolic SAR (PSAR) indicators.
How it works:
The strategy uses two moving averages: a fast MA and a slow MA.
It checks for a bullish trend when the fast MA is above the slow MA and the current price is above the fast MA.
It checks for a bearish trend when the fast MA is below the slow MA and the current price is below the fast MA.
The Parabolic SAR (PSAR) indicator is used for additional trend confirmation.
Long and short positions can be turned on or off based on user input.
The strategy incorporates risk management with stop-loss orders based on the Average True Range (ATR).
Users can filter the backtest date range and display various indicators.
The strategy is designed to work with the date range filter, risk management, and user-defined positions.
Features:
Trend-following strategy.
Two customizable moving averages.
Parabolic SAR for trend confirmation.
User-defined risk management with stop-loss based on ATR.
Backtest date range filter.
Flexibility to enable or disable long and short positions.
This trading system provides a comprehensive approach to trend-following and risk management, making it suitable for traders looking to capture trends with controlled risk.

Renko StrategyRENKO STRATEGY
CAUTION : This strategy must be applied to a candlestick chart (not a Renko chart).
INTRODUCTION :
The Traditional Renko chart has been reproduced and is plotted according to the evolution of the price. It will enable us to receive buy or sell signals and follow major trends. This is a medium/long term strategy and depends a lot on the box size chosen in the parameters. There's also a money management method allowing us to reinvest part of the profits or reduce the size of orders in the event of substantial losses.
RENKO CHART :
Renko chart construction methodology :
The user must first choose the box size. The minimum is 0.00001 and there is no maximum. The default is 10. The user must then choose the source that will define the data on which the calculations will be based (high, low, open, close). By default, close is selected. The first candle on the chart is used to draw the first box with its high and low.
Each time the price changes by the amount of the box size relative to the high or low of the last box, a new box is added above or below the previous one. If price variations are less than the box size, the same box is added next to the previous one. If price variations are N (integer number) times greater than box size, N boxes are added above or below the previous one. Each box added above the previous one is a green box, while each box added below the previous one is a red box.
Conditions for drawing a green box above the previous one :
(source - high_of_the_last_box) / box_size > 1
Condition for drawing a red box below the previous one :
(low_of_the_last_box - source) / box_size > 1
If neither condition is triggered, the same box is drawn next to the previous one.
Example :
The last candle has drawn a box with low 12 and high 14. The box size is therefore 2. The strategy will look at the value of the close each time a candle ends. The current candle closes with a close equal to 15.5. As the variation from the previous high is only 1.5 (which is less than the box size), the same box is added next to the previous one. The next candle closes at 16.2. The price variation is therefore 2.2 compared with the previous high. We can now add a new green box just above the previous one, with a low of 14 and a high of 16. The same process applies if the candle's close is at least one box size below the low of the last box. In this case, a new red box is placed below the previous one.
PARAMETERS :
Source : Allows you to specify which data will be taken into account by the strategy when performing calculations. The default is close.
Box size : Size of Renko graph boxes. This is a very important parameter to choose carefully, as it has a strong impact on the strategy's performance. Defaults to 10.
Fixed Ratio : This is the amount of gain or loss at which the order quantity is changed. The default is 400, meaning that for each $400 gain or loss, the order size is increased or decreased by a user-selected amount.
Increasing Order Amount : This is the amount to be added to or subtracted from orders when the fixed ratio is reached. The default is $200, which means that for every $400 gain, $200 is reinvested in the strategy. On the other hand, for every $400 loss, the order size is reduced by $200.
Initial capital : $1000
Fees : Interactive Broker fees apply to this strategy. They are set at 0.18% of the trade value.
Slippage : 3 ticks or $0.03 per trade. Corresponds to the latency time between the moment the signal is received and the moment the order is executed by the broker.
Important : A bot has been used to test all possible box sizes to find out which one generates the highest return on BITSTAMP:LTCUSD while limiting the drawdown. This strategy is the most optimal with a box size equal to 5.08 in 8h timeframe.
BUY AND SHORT SIGNALS :
As the aim of this strategy is to follow major trends based on price movements, we need to be on the right side of price fluctuation. We trade every box reversal, i.e. we are LONG when the boxes are green indicating an uptrend and SHORT when they are red indicating a downtrend.
RISK MANAGEMENT :
This strategy can incur losses. The size of the box is decisive, as it is used to plot the RENKO chart and thus trigger buy or sell signals. It's also what allows us to manage risk. For every trade, we risk a maximum amount equal to 2 times the size of the box, i.e. :(5.08*2*nb_contract)/trade_value.
MONEY MANAGEMENT :
The fixed ratio method has been used to manage our gains and losses. For each gain of an amount equal to the value of the fixed ratio, we increase the order size by a value defined by the user in the "Increasing order amount" parameter. Similarly, each time we lose an amount equal to the value of the fixed ratio, we decrease the order size by the same user-defined value. This strategy not only increases our performance, but also our drawdown.
Enjoy the strategy and don't forget to take the trade :)
Heikin Ashi Smoothed Buy Sell with Filters Backtest What is the Heikin Ashi Smoothed Buy Sell with Filters Backtest ?
It is the backtesting version of the Heikin Ashi Smoothed Buy Sell with Filters indicator.
This Pine Script code defines a complex indicator used to determine buy-sell signals on financial charts. The indicator operates based on the smoothed version of Heikin Ashi and is fortified with various filters.
1. Parameters and Settings:
At the start of the code, there are a series of input parameters for the user to customize the indicator. These parameters include:
Trend Filter: Checks whether it is above or below the long-term moving average.
Momentum Filter: Uses the RSI (Relative Strength Index) indicator to check if the market is overbought or oversold.
Volatility Filter: Evaluates the market's volatility level using the ATR (Average True Range) indicator.
Volume Filters: Uses various volume-related parameters to measure the strength of the trade signal.
Trade Settings: Specifies percentage values for target and stop-loss levels to be used in trading.
Moving Average Settings: Allows you to select which moving average to use and its duration.
2. Heikin Ashi Smoothed Calculations:
Heikin Ashi is a charting method used to more clearly represent price movements. The smoothed Heikin Ashi ensures smoother price movements.
3. Moving Average Calculations:
The indicator contains a function to calculate different types of moving averages. These moving averages are used to determine the market trend.
4. Filters:
This indicator includes a series of filters to enhance the quality of the signal. Filters help reduce false signals and produce more robust trading signals.
5. Buy-Sell Signals:
All these filters and calculations are brought together to determine potential buy and sell signals. Signals are triggered when all the specified conditions are met.
6. Chart Visualizations:
This indicator uses various plotting functions to visualize signals and trend information on the chart. This allows the user to easily see signals and the trend on the chart.
7. Trade Settings:
When buy and sell signals are triggered, this section checks if it has reached the specified targets and stop-loss levels.
8. Alerts:
This indicator also sends alerts to the user when specific conditions are met. This ensures that the user doesn't miss potential trading opportunities.
In conclusion, this Pine Script indicator produces buy-sell signals by analyzing market movements and applying various filters. Based on the smoothed version of Heikin Ashi, this indicator is useful for trend followers and is fortified with various filters, thus enhancing the quality of trading signals.
Heikin Ashi Smoothed Buy Sell with Filters Backtest Nedir?
Heikin Ashi Smoothed Buy Sell with Filters indikatörünün backtest yapan versiyonudur
Bu Pine Script kodu, finansal grafiklerde al-sat sinyallerini belirlemek için kullanılan karmaşık bir göstergeyi tanımlar. Gösterge, Heikin Ashi'nin yumuşatılmış sürümünü temel alarak çalışır ve çeşitli filtrelerle güçlendirilmiştir.
1. Parametreler ve Ayarlar:
Kodun başlangıcında, kullanıcının göstergeyi kişiselleştirmesi için bir dizi giriş parametresi bulunmaktadır. Bu parametreler şunları içerir:
Trend Filtresi: Uzun vadeli hareketli ortalamanın üstünde veya altında olup olmadığını kontrol eder.
Momentum Filtresi: RSI (Göreceli Güç Endeksi) göstergesini kullanarak piyasanın aşırı alım veya aşırı satım durumunu kontrol eder.
Oynaklık Filtresi: ATR (Ortalama Gerçek Aralık) göstergesi ile piyasanın oynaklık seviyesini değerlendirir.
Hacim Filtreleri: Ticaret sinyalinin gücünü ölçmek için hacimle ilgili çeşitli parametreleri kullanır.
Ticaret Ayarları: Ticarette kullanılacak hedef ve stop-loss seviyeleri için yüzdelik değerleri belirtir.
Hareketli Ortalama Ayarları: Hangi hareketli ortalamayı kullanacağınızı ve bu ortalamanın süresini seçmenizi sağlar.
2. Heikin Ashi Yumuşatılmış Hesaplamaları:
Heikin Ashi, fiyat hareketlerini daha net bir şekilde göstermek için kullanılan bir grafikleme yöntemidir. Yumuşatılmış Heikin Ashi, fiyat hareketlerinin daha pürüzsüz olmasını sağlar.
3. Hareketli Ortalama Hesaplamaları:
Gösterge, farklı türde hareketli ortalamaları hesaplamak için bir fonksiyon içerir. Bu hareketli ortalamalar, piyasa trendini belirlemek için kullanılır.
4. Filtreler:
Bu gösterge, sinyal kalitesini artırmak için bir dizi filtre içerir. Filtreler, yanlış sinyalleri azaltmaya yardımcı olur ve daha sağlam ticaret sinyalleri üretir.
5. Al-Sat Sinyalleri:
Tüm bu filtreler ve hesaplamalar, potansiyel al ve sat sinyallerini belirlemek için bir araya getirilir. Sinyaller, belirlenen koşulların tümü karşılandığında tetiklenir.
6. Grafik Görselleştirmeleri:
Bu gösterge, sinyalleri ve trend bilgisini grafik üzerinde görselleştirmek için çeşitli çizim fonksiyonları kullanır. Bu, kullanıcının grafik üzerinde kolayca sinyalleri ve trendi görmesini sağlar.
7. Ticaret Ayarları:
Alış ve satış sinyalleri tetiklendiğinde, bu bölüm belirlenen hedeflere ve stop-loss seviyelerine ulaşıp ulaşmadığını kontrol eder.
8. Uyarılar:
Bu gösterge ayrıca, belirli koşullar karşılandığında kullanıcıya uyarı gönderir. Bu, kullanıcının potansiyel ticaret fırsatlarını kaçırmamasını sağlar.
Sonuç olarak, bu Pine Script göstergesi, piyasa hareketlerini analiz ederek ve çeşitli filtreleri uygulayarak al-sat sinyalleri üretir. Heikin Ashi'nin yumuşatılmış sürümüne dayanan bu gösterge, trend takipçileri için kullanışlıdır ve çeşitli filtrelerle güçlendirilmiştir, böylece ticaret sinyallerinin kalitesi artar.

TradingView.To Strategy Template (with Dyanmic Alerts)Hello traders,
If you're tired of manual trading and looking for a solid strategy template to pair with your indicators, look no further.
This Pine Script v5 strategy template is engineered for maximum customization and risk management.
Best part?
This Pine Script v5 template facilitates the dynamic construction of TradingView.TO alerts, sparing users the time and effort of mastering the TradingView.TO syntax and manually create alert commands.
This powerful tool gives much power to those who don't know how to code in Pinescript and want to automate their indicators' signals via TradingView.TO bot.
IMPORTANT NOTES
TradingView.TO is a trading bot software that forwards TradingView alerts to your brokers (examples: Binance, Oanda, Coinbase, Bybit, Metatrader 4/5, ...) for automating trading.
Many traders don't know how to create TradingView.TO dynamically-compatible alerts using the data from their TradingView scripts.
Traders using trading bots want their alerts to reflect the stop-loss/take-profit/trailing-stop/stop-loss to break options from your script and then create the orders accordingly.
This script showcases how to create TradingView.TO alerts dynamically.
TRADINGVIEW ALERTS
1) You'll have to create one alert per asset X timeframe = 1 chart.
Example: 1 alert for BTC/USDT on the 5 minutes chart, 1 alert for BTC/USDT on the 15-minute chart (assuming you want your bot to trade the BTC/USDT on the 5 and 15-minute timeframes)
2) Select the Order fills and alert() function calls condition
3) For each alert, the alert message is pre-configured with the text below
{{strategy.order.alert_message}}
Please leave it as it is.
It's a TradingView native variable that will fetch the alert text messages built by the script.
4) TradingView.TO uses webhook technology - setting a webhook URL from the alerts notifications tab is required.
KEY FEATURES
I) Modular Indicator Connection
* plug your existing indicator into the template.
* Only two lines of code are needed for full compatibility.
Step 1: Create your connector
Adapt your indicator with only 2 lines of code and then connect it to this strategy template.
To do so:
1) Find in your indicator where the conditions print the long/buy and short/sell signals.
2) Create an additional plot as below
I'm giving an example with a Two moving averages cross.
Please replicate the same methodology for your indicator, whether a MACD , ZigZag, Pivots , higher-highs, lower-lows or whatever indicator with clear buy and sell conditions.
//@version=5
indicator("Supertrend", overlay = true, timeframe = "", timeframe_gaps = true)
atrPeriod = input.int(10, "ATR Length", minval = 1)
factor = input.float(3.0, "Factor", minval = 0.01, step = 0.01)
= ta.supertrend(factor, atrPeriod)
supertrend := barstate.isfirst ? na : supertrend
bodyMiddle = plot(barstate.isfirst ? na : (open + close) / 2, display = display.none)
upTrend = plot(direction < 0 ? supertrend : na, "Up Trend", color = color.green, style = plot.style_linebr)
downTrend = plot(direction < 0 ? na : supertrend, "Down Trend", color = color.red, style = plot.style_linebr)
fill(bodyMiddle, upTrend, color.new(color.green, 90), fillgaps = false)
fill(bodyMiddle, downTrend, color.new(color.red, 90), fillgaps = false)
buy = ta.crossunder(direction, 0)
sell = ta.crossunder(direction, 0)
//////// CONNECTOR SECTION ////////
Signal = buy ? 1 : sell ? -1 : 0
plot(Signal, title = "Signal", display = display.data_window)
//////// CONNECTOR SECTION ////////
Important Notes
🔥 The Strategy Template expects the value to be exactly 1 for the bullish signal and -1 for the bearish signal
Now, you can connect your indicator to the Strategy Template using the method below or that one.
Step 2: Connect the connector
1) Add your updated indicator to a TradingView chart
2) Add the Strategy Template as well to the SAME chart
3) Open the Strategy Template settings, and in the Data Source field, select your 🔌Connector🔌 (which comes from your indicator)
Note it doesn’t have to be named 🔌Connector🔌 - you can name it as you want - however, I recommend an explicit name you can easily remember.
From then, you should start seeing the signals and plenty of other stuff on your chart.
🔥 Note that whenever you update your indicator values, the strategy statistics and visuals on your chart will update in real-time
II) BOT Risk Management:
- Max Drawdown:
Mode: Select whether the max drawdown is calculated in percentage (%) or USD.
Value: If the max drawdown reaches this specified value, set a value to halt the bot.
- Max Consecutive Days:
Use Max Consecutive Days BOT Halt: Enable/Disable halting the bot if the max consecutive losing days value is reached.
- Max Consecutive Days: Set the maximum number of consecutive losing days allowed before halting the bot.
- Max Losing Streak:
Use Max Losing Streak: Enable/Disable a feature to prevent the bot from taking too many losses in a row.
- Max Losing Streak Length: Set the maximum length of a losing streak allowed.
Margin Call:
- Use Margin Call: Enable/Disable a feature to exit when a specified percentage away from a margin call to prevent it.
Margin Call (%): Set the percentage value to trigger this feature.
- Close BOT Total Loss:
Use Close BOT Total Loss: Enable/Disable a feature to close all trades and halt the bot if the total loss is reached.
- Total Loss ($): Set the total loss value in USD to trigger this feature.
Intraday BOT Risk Management:
- Intraday Losses:
Use Intraday Losses BOT Halt: Enable/Disable halting the bot on reaching specified intraday losses.
Mode: Select whether the intraday loss is calculated in percentage (%) or USD.
- Max Intraday Losses (%): Set the value for maximum intraday losses.
Limit Intraday Trades:
- Use Limit Intraday Trades: Enable/Disable a feature to limit the number of intraday trades.
- Max Intraday Trades: Set the maximum number of intraday trades allowed.
Restart Intraday EA:
III) Order Types and Position Sizing
- Choose between market or limit orders.
- Set your position size directly in the template.
Please use the position size from the “Inputs” and not the “Properties” tab.
I know it's redundant. - the template needs this value from the "Inputs" tab to build the alerts, and the Backtester needs it from the "Properties" tab.
IV) Advanced Take-Profit and Stop-Loss Options
- Choose to set your SL/TP in either USD or percentages.
- Option for multiple take-profit levels and trailing stop losses.
- Move your stop loss to break even +/- offset in USD for “risk-free” trades.
V) Miscellaneous:
Retry order openings if they fail.
Order Types:
Select and specify order type and price settings.
Position Size:
Define the type and size of positions.
Leverage:
Leverage settings, including margin type and hedge mode.
Session:
Limit trades to specific sessions.
Dates:
Limit trades to a specific date range.
Trades Direction:
Direction: Specify the market direction for opening positions.
VI) Logger
The TradingView.TO commands are logged in the TradingView logger.
You'll find more information about it in this TradingView blog post .
WHY YOU MIGHT NEED THIS TEMPLATE
1) Transform your indicator into a TradingView.TO trading bot more easily than before
Connect your indicator to the template
Create your alerts
Set your EA settings
2) Save Time
Auto-generated alert messages for TradingView.TO.
I tested them all and checked with the support team what could/couldn’t be done.
3) Be in Control
Manage your trading risks with advanced features.
4) Customizable
Fits various trading styles and asset classes.
REQUIREMENTS
* Make sure you have your TradingView.TO account
* If there is any issue with the template, ask me in the comments section - I’ll answer quickly.
BACKTEST RESULTS FROM THIS POST
1) I connected this strategy template to a dummy Supertrend script.
I could have selected any other indicator or concept for this script post.
I wanted to share an example of how you can quickly upgrade your strategy, making it compatible with TradingView.TO.
2) The backtest results aren't relevant for this educational script publication.
I used realistic backtesting data but didn't look too much into optimizing the results, as this isn't the point of why I'm publishing this script.
This strategy is a template to be connected to any indicator - the sky is the limit. :)
3) This template is made to take 1 trade per direction at any given time.
Pyramiding is set to 1 on TradingView.
The strategy default settings are:
* Initial Capital: 100000 USD
* Position Size: 1%
* Commission Percent: 0.075%
* Slippage: 1 tick
* No margin/leverage used

Engulfing with TrendThe script above is a trading strategy with rules based on the Engulfing candlestick pattern within the context of the trend. Some key elements of this script include:
1. ATR (Average True Range) settings to measure market volatility.
2. Supertrend settings to identify the market trend.
3. Conditions for determining uptrend and downtrend.
4. Determination of Bullish (Engulfing pattern during uptrend) and Bearish (Engulfing pattern during downtrend).
5. Calculation of Stop Loss (SL) and Take Profit (TP) levels based on the Engulfing pattern.
6. Entry conditions based on the Engulfing pattern and the corresponding trend.
7. Exit conditions based on price crossovers with SL and TP levels.
8. Plotting of the Engulfing patterns on the chart.
This strategy is used to identify trading opportunities based on Engulfing candlestick patterns that align with the direction of the market trend. Additionally, stop loss and take profit levels are calculated based on the Engulfing pattern, and trading signals are displayed on the chart.
It's important to note that this script can be customized according to your trading preferences and strategy.

Machine Learning: SuperTrend Strategy TP/SL [YinYangAlgorithms]The SuperTrend is a very useful Indicator to display when trends have shifted based on the Average True Range (ATR). Its underlying ideology is to calculate the ATR using a fixed length and then multiply it by a factor to calculate the SuperTrend +/-. When the close crosses the SuperTrend it changes direction.
This Strategy features the Traditional SuperTrend Calculations with Machine Learning (ML) and Take Profit / Stop Loss applied to it. Using ML on the SuperTrend allows for the ability to sort data from previous SuperTrend calculations. We can filter the data so only previous SuperTrends that follow the same direction and are within the distance bounds of our k-Nearest Neighbour (KNN) will be added and then averaged. This average can either be achieved using a Mean or with an Exponential calculation which puts added weight on the initial source. Take Profits and Stop Losses are then added to the ML SuperTrend so it may capitalize on Momentum changes meanwhile remaining in the Trend during consolidation.
By applying Machine Learning logic and adding a Take Profit and Stop Loss to the Traditional SuperTrend, we may enhance its underlying calculations with potential to withhold the trend better. The main purpose of this Strategy is to minimize losses and false trend changes while maximizing gains. This may be achieved by quick reversals of trends where strategic small losses are taken before a large trend occurs with hopes of potentially occurring large gain. Due to this logic, the Win/Loss ratio of this Strategy may be quite poor as it may take many small marginal losses where there is consolidation. However, it may also take large gains and capitalize on strong momentum movements.
Tutorial:
In this example above, we can get an idea of what the default settings may achieve when there is momentum. It focuses on attempting to hit the Trailing Take Profit which moves in accord with the SuperTrend just with a multiplier added. When momentum occurs it helps push the SuperTrend within it, which on its own may act as a smaller Trailing Take Profit of its own accord.
We’ve highlighted some key points from the last example to better emphasize how it works. As you can see, the White Circle is where profit was taken from the ML SuperTrend simply from it attempting to switch to a Bullish (Buy) Trend. However, that was rejected almost immediately and we went back to our Bearish (Sell) Trend that ended up resulting in our Take Profit being hit (Yellow Circle). This Strategy aims to not only capitalize on the small profits from SuperTrend to SuperTrend but to also capitalize when the Momentum is so strong that the price moves X% away from the SuperTrend and is able to hit the Take Profit location. This Take Profit addition to this Strategy is crucial as momentum may change state shortly after such drastic price movements; and if we were to simply wait for it to come back to the SuperTrend, we may lose out on lots of potential profit.
If you refer to the Yellow Circle in this example, you’ll notice what was talked about in the Summary/Overview above. During periods of consolidation when there is little momentum and price movement and we don’t have any Stop Loss activated, you may see ‘Signal Flashing’. Signal Flashing is when there are Buy and Sell signals that keep switching back and forth. During this time you may be taking small losses. This is a normal part of this Strategy. When a signal has finally been confirmed by Momentum, is when this Strategy shines and may produce the profit you desire.
You may be wondering, what causes these jagged like patterns in the SuperTrend? It's due to the ML logic, and it may be a little confusing, but essentially what is happening is the Fast Moving SuperTrend and the Slow Moving SuperTrend are creating KNN Min and Max distances that are extreme due to (usually) parabolic movement. This causes fewer values to be added to and averaged within the ML and causes less smooth and more exponential drastic movements. This is completely normal, and one of the perks of using k-Nearest Neighbor for ML calculations. If you don’t know, the Min and Max Distance allowed is derived from the most recent(0 index of data array) to KNN Length. So only SuperTrend values that exhibit distances within these Min/Max will be allowed into the average.
Since the KNN ML logic can cause these exponential movements in the SuperTrend, they likewise affect its Take Profit. The Take Profit may benefit from this movement like displayed in the example above which helped it claim profit before then exhibiting upwards movement.
By default our Stop Loss Multiplier is kept quite low at 0.0000025. Keeping it low may help to reduce some Signal Flashing while not taking extra losses more so than not using it at all. However, if we increase it even more to say 0.005 like is shown in the example above. It can really help the trend keep momentum. Please note, although previous results don’t imply future results, at 0.0000025 Stop Loss we are currently exhibiting 69.27% profit while at 0.005 Stop Loss we are exhibiting 33.54% profit. This just goes to show that although there may be less Signal Flashing, it may not result in more profit.
We will conclude our Tutorial here. Hopefully this has given you some insight as to how Machine Learning, combined with Trailing Take Profit and Stop Loss may have positive effects on the SuperTrend when turned into a Strategy.
Settings:
SuperTrend:
ATR Length: ATR Length used to create the Original Supertrend.
Factor: Multiplier used to create the Original Supertrend.
Stop Loss Multiplier: 0 = Don't use Stop Loss. Stop loss can be useful for helping to prevent false signals but also may result in more loss when hit and less profit when switching trends.
Take Profit Multiplier: Take Profits can be useful within the Supertrend Strategy to stop the price reverting all the way to the Stop Loss once it's been profitable.
Machine Learning:
Only Factor Same Trend Direction: Very useful for ensuring that data used in KNN is not manipulated by different SuperTrend Directional data. Please note, it doesn't affect KNN Exponential.
Rationalized Source Type: Should we Rationalize only a specific source, All or None?
Machine Learning Type: Are we using a Simple ML Average, KNN Mean Average, KNN Exponential Average or None?
Machine Learning Smoothing Type: How should we smooth our Fast and Slow ML Datas to be used in our KNN Distance calculation? SMA, EMA or VWMA?
KNN Distance Type: We need to check if distance is within the KNN Min/Max distance, which distance checks are we using.
Machine Learning Length: How far back is our Machine Learning going to keep data for.
k-Nearest Neighbour (KNN) Length: How many k-Nearest Neighbours will we account for?
Fast ML Data Length: What is our Fast ML Length?? This is used with our Slow Length to create our KNN Distance.
Slow ML Data Length: What is our Slow ML Length?? This is used with our Fast Length to create our KNN Distance.
If you have any questions, comments, ideas or concerns please don't hesitate to contact us.
HAPPY TRADING!

ProfitView Strategy TemplateHello traders,
This script took me a full week of coding/testing, sweat, and tears - and I’m too nice as I’m giving it for free to the community.
If you're tired of manual trading and looking for a solid strategy template to pair with your indicators, look no further.
This Pine Script v5 strategy template is engineered for maximum customization and risk management.
Best part?
This Pine Script v5 template facilitates the dynamic construction of ProfitView alerts, sparing users the time and effort of mastering the ProfitView syntax and manually creating alert commands.
This powerful tool gives much power to those who don't know how to code in Pinescript and want to automate their indicators' signals via the ProfitView Chrome extension.
IMPORTANT NOTES
ProfitView is a trading bot software that forwards TradingView alerts to your brokers (examples: Binance, Oanda, Coinbase, Bybit, etc.) for automating trading.
Many traders don't know how to dynamically create ProfitView-compatible alerts using the data from their TradingView scripts.
Traders using trading bots want their alerts to reflect the stop-loss/take-profit/trailing-stop/stop-loss to break options from your script and then create the orders accordingly.
This script showcases how to create ProfitView alerts dynamically.
TRADINGVIEW ALERTS
1) You'll have to create one alert per asset X timeframe = 1 chart.
Example: 1 alert for EUR/USD on the 5 minutes chart, 1 alert for EUR/USD on the 15-minute chart (assuming you want your bot to trade the EUR/USD on the 5 and 15-minute timeframes)
2) Select the Order fills and alert() function calls condition
3) For each alert, the alert message is pre-configured with the text below
{{strategy.order.alert_message}}
Please leave it as it is.
It's a TradingView native variable that will fetch the alert text messages built by the script.
4) ProfitView doesn't use webhook technology, so setting a webhook URL from the alerts notifications tab is unnecessary.
KEY FEATURES
I) Modular Indicator Connection
* plug your existing indicator into the template.
* Only two lines of code are needed for full compatibility.
Step 1: Create your connector
Adapt your indicator with only 2 lines of code and then connect it to this strategy template.
To do so:
1) Find in your indicator where the conditions print the long/buy and short/sell signals.
2) Create an additional plot as below
I'm giving an example with a Two moving averages cross.
Please replicate the same methodology for your indicator, whether a MACD , ZigZag, Pivots , higher-highs, lower-lows or whatever indicator with clear buy and sell conditions.
//@version=5
indicator("Supertrend", overlay = true, timeframe = "", timeframe_gaps = true)
atrPeriod = input.int(10, "ATR Length", minval = 1)
factor = input.float(3.0, "Factor", minval = 0.01, step = 0.01)
= ta.supertrend(factor, atrPeriod)
supertrend := barstate.isfirst ? na : supertrend
bodyMiddle = plot(barstate.isfirst ? na : (open + close) / 2, display = display.none)
upTrend = plot(direction < 0 ? supertrend : na, "Up Trend", color = color.green, style = plot.style_linebr)
downTrend = plot(direction < 0 ? na : supertrend, "Down Trend", color = color.red, style = plot.style_linebr)
fill(bodyMiddle, upTrend, color.new(color.green, 90), fillgaps = false)
fill(bodyMiddle, downTrend, color.new(color.red, 90), fillgaps = false)
buy = ta.crossunder(direction, 0)
sell = ta.crossunder(direction, 0)
//////// CONNECTOR SECTION ////////
Signal = buy ? 1 : sell ? -1 : 0
plot(Signal, title = "Signal", display = display.data_window)
//////// CONNECTOR SECTION ////////
Important Notes
🔥 The Strategy Template expects the value to be exactly 1 for the bullish signal and -1 for the bearish signal
Now, you can connect your indicator to the Strategy Template using the method below or that one.
Step 2: Connect the connector
1) Add your updated indicator to a TradingView chart
2) Add the Strategy Template as well to the SAME chart
3) Open the Strategy Template settings, and in the Data Source field, select your 🔌Connector🔌 (which comes from your indicator)
Note it doesn’t have to be named 🔌Connector🔌 - you can name it as you want - however, I recommend an explicit name you can easily remember.
From then, you should start seeing the signals and plenty of other stuff on your chart.
🔥 Note that whenever you update your indicator values, the strategy statistics and visuals on your chart will update in real-time
II) BOT Risk Management:
- Max Drawdown:
Mode: Select whether the max drawdown is calculated in percentage (%) or USD.
Value: If the max drawdown reaches this specified value, set a value to halt the bot.
- Max Consecutive Days:
Use Max Consecutive Days BOT Halt: Enable/Disable halting the bot if the max consecutive losing days value is reached.
- Max Consecutive Days: Set the maximum number of consecutive losing days allowed before halting the bot.
- Max Losing Streak:
Use Max Losing Streak: Enable/Disable a feature to prevent the bot from taking too many losses in a row.
- Max Losing Streak Length: Set the maximum length of a losing streak allowed.
Margin Call:
- Use Margin Call: Enable/Disable a feature to exit when a specified percentage away from a margin call to prevent it.
Margin Call (%): Set the percentage value to trigger this feature.
- Close BOT Total Loss:
Use Close BOT Total Loss: Enable/Disable a feature to close all trades and halt the bot if the total loss is reached.
- Total Loss ($): Set the total loss value in USD to trigger this feature.
Intraday BOT Risk Management:
- Intraday Losses:
Use Intraday Losses BOT Halt: Enable/Disable halting the bot on reaching specified intraday losses.
Mode: Select whether the intraday loss is calculated in percentage (%) or USD.
- Max Intraday Losses (%): Set the value for maximum intraday losses.
Limit Intraday Trades:
- Use Limit Intraday Trades: Enable/Disable a feature to limit the number of intraday trades.
- Max Intraday Trades: Set the maximum number of intraday trades allowed.
Restart Intraday EA:
- Use Restart Intraday EA: Enable/Disable a feature to restart the bot at the first bar of the next day if it has been stopped with an intraday risk management safeguard.
III) Order Types and Position Sizing
- Choose between market, limit, or stop orders.
- Set your position size directly in the template.
Please use the position size from the “Inputs” and not the “Properties” tab.
I know it's redundant. - the template needs this value from the "Inputs" tab to build the alerts, and the Backtester needs it from the "Properties" tab.
IV) Advanced Take-Profit and Stop-Loss Options
- Choose to set your SL/TP in either pips or percentages.
- Option for multiple take-profit levels and trailing stop losses.
- Move your stop loss to break even +/- offset in pips for “risk-free” trades.
V) Miscellaneous
Retry order openings if they fail.
Order Types:
Select and specify order type and price settings.
Position Size:
Define the type and size of positions.
Leverage:
Leverage settings, including margin type and hedge mode.
Session:
Limit trades to specific sessions.
Dates:
Limit trades to a specific date range.
Trades Direction:
Direction: Specify the market direction for opening positions.
VI) Notifications (Telegram/Discord/Email/IFTTT/Twilio/SMS)
Customize notifications sent to Telegram, Discord, Email, IFTTT, Twilio, and ProfitView Logger.
VII) Logger
The ProfitView commands are logged in the TradingView logger.
You'll find more information about it in this TradingView blog post .
WHY YOU MIGHT NEED THIS TEMPLATE
1) Transform your indicator into a ProfitView trading bot more easily than before
Connect your indicator to the template
Create your alerts
Set your EA settings
2) Save Time
Auto-generated alert messages for ProfitView.
I tested them all and checked with the support team what could/couldn’t be done.
3) Be in Control
Manage your trading risks with advanced features.
4) Customizable
Fits various trading styles and asset classes.
REQUIREMENTS
* Make sure you have your ProfitView account and do the settings correctly in your Chrome extension. If you don't know how to do it, read the documentation + ask for help in the ProfitView Discord support channel.
* If there is any issue with the template, ask me in the comments section - I’ll answer quickly.
BACKTEST RESULTS FROM THIS POST
1) I connected this strategy template to a dummy Supertrend script.
I could have selected any other indicator or concept for this script post.
I wanted to share an example of how you can quickly upgrade your strategy, making it compatible with ProfitView.
2) The backtest results aren't relevant for this educational script publication.
I used realistic backtesting data but didn't look too much into optimizing the results, as this isn't the point of why I'm publishing this script.
This strategy is a template to be connected to any indicator - the sky is the limit. :)
3) This template is made to take 1 trade per direction at any given time.
Pyramiding is set to 1 on TradingView.
The strategy default settings are:
* Initial Capital: 100000 USD
* Position Size: 1%
* Commission Percent: 0.075%
* Slippage: 1 tick
* No margin/leverage used
Best regards,
Dave

Pineconnector Strategy Template (Connect Any Indicator)Hello traders,
If you're tired of manual trading and looking for a solid strategy template to pair with your indicators, look no further.
This Pine Script v5 strategy template is engineered for maximum customization and risk management.
Best part?
It’s optimized for Pineconnector, allowing seamless integration with MetaTrader 4 and 5.
This powerful tool gives a lot of power to those who don't know how to code in Pinescript and are looking to automate their indicators' signals on Metatrader 4/5.
IMPORTANT NOTES
Pineconnector is a trading bot software that forwards TradingView alerts to your Metatrader 4/5 for automating trading.
Many traders don't know how to dynamically create Pineconnector-compatible alerts using the data from their TradingView scripts.
Traders using trading bots want their alerts to reflect the stop-loss/take-profit/trailing-stop/stop-loss to break options from your script and then create the orders accordingly.
This script showcases how to create Pineconnector alerts dynamically.
Pineconnector doesn't support alerts with multiple Take Profits.
As a workaround, for 2 TPs, I had to open two trades.
It's not optimal, as we end up paying more spreads for that extra trade - however, depending on your trading strategy, it may not be a big deal.
TRADINGVIEW ALERTS
1) You'll have to create one alert per asset X timeframe = 1 chart.
Example: 1 alert for EUR/USD on the 5 minutes chart, 1 alert for EUR/USD on the 15-minute chart (assuming you want your bot to trade the EUR/USD on the 5 and 15-minute timeframes)
2) Select the Order fills and alert() function calls condition
3) For each alert, the alert message is pre-configured with the text below
{{strategy.order.alert_message}}
Please leave it as it is.
It's a TradingView native variable that will fetch the alert text messages built by the script.
4) Don't forget to set the Pineconnector webhook URL in the Notifications tab of the TradingView alerts UI.
You’ll find the URL on the Pineconnector documentation website.
EA CONFIGURATION
1) The Pyramiding in the EA on Metatrader must be set to 2 if you want to trade with 2 TPs => as it's opening 2 trades.
If you only want 1 TP, set the EA Pyramiding to 1.
Regarding the other EA settings, please refer to the Pineconnector documentation on their website.
2) In the EA, you can set a risk (= position size type) in %/lots/USD, as in the TradingView backtest settings.
KEY FEATURES
I) Modular Indicator Connection
* plug in your existing indicator into the template.
* Only two lines of code are needed for full compatibility.
Step 1: Create your connector
Adapt your indicator with only 2 lines of code and then connect it to this strategy template.
To do so:
1) Find in your indicator where the conditions print the long/buy and short/sell signals.
2) Create an additional plot as below
I'm giving an example with a Two moving averages cross.
Please replicate the same methodology for your indicator, whether it's a MACD , ZigZag , Pivots , higher-highs, lower-lows, or whatever indicator with clear buy and sell conditions.
//@version=5
indicator("Supertrend", overlay = true, timeframe = "", timeframe_gaps = true)
atrPeriod = input.int(10, "ATR Length", minval = 1)
factor = input.float(3.0, "Factor", minval = 0.01, step = 0.01)
= ta.supertrend(factor, atrPeriod)
supertrend := barstate.isfirst ? na : supertrend
bodyMiddle = plot(barstate.isfirst ? na : (open + close) / 2, display = display.none)
upTrend = plot(direction < 0 ? supertrend : na, "Up Trend", color = color.green, style = plot.style_linebr)
downTrend = plot(direction < 0 ? na : supertrend, "Down Trend", color = color.red, style = plot.style_linebr)
fill(bodyMiddle, upTrend, color.new(color.green, 90), fillgaps = false)
fill(bodyMiddle, downTrend, color.new(color.red, 90), fillgaps = false)
buy = ta.crossunder(direction, 0)
sell = ta.crossunder(direction, 0)
//////// CONNECTOR SECTION ////////
Signal = buy ? 1 : sell ? -1 : 0
plot(Signal, title = "Signal", display = display.data_window)
//////// CONNECTOR SECTION ////////
Important Notes
🔥 The Strategy Template expects the value to be exactly 1 for the bullish signal and -1 for the bearish signal
Now, you can connect your indicator to the Strategy Template using the method below or that one.
Step 2: Connect the connector
1) Add your updated indicator to a TradingView chart
2) Add the Strategy Template as well to the SAME chart
3) Open the Strategy Template settings, and in the Data Source field, select your 🔌Connector🔌 (which comes from your indicator)
Note it doesn’t have to be named 🔌Connector🔌 - you can name it as you want - however, I recommend an explicit name you can easily remember.
From then, you should start seeing the signals and plenty of other stuff on your chart.
🔥 Note that whenever you update your indicator values, the strategy statistics and visuals on your chart will update in real-time
II) Customizable Risk Management
- Choose between percentage or USD modes for maximum drawdown.
- Set max consecutive losing days and max losing streak length.
- I used the code from my friend @JosKodify for the maximum losing streak. :)
Will halt the EA and backtest orders fill whenever either of the safeguards above are “broken”
III) Intraday Risk Management
- Limit the maximum intraday losses both in percentage or USD.
- Option to set a maximum number of intraday trades.
- If your EA gets halted on an intraday chart, auto-restart it the next day.
IV) Spread and Account Filters
- Trade only if the spread is below a certain pip value.
- Set requirements based on account balance or equity.
V) Order Types and Position Sizing
- Choose between market, limit, or stop orders.
- Set your position size directly in the template.
Please use the position size from the “Inputs” and not the “Properties” tab.
Reason : The template sends the order on the same candle as the entry signals - at those entry signals candles, the position size isn’t computed yet, and the template can’t then send it to Pineconnector.
However, you can use the position size type (USD, contracts, %) from the “Properties” tab for backtesting.
In the EA, you can define the position size type for your orders in USD or lots or %.
VI) Advanced Take-Profit and Stop-Loss Options
- Choose to set your SL/TP in either pips or percentages.
- Option for multiple take-profit levels and trailing stop losses.
- Move your stop loss to break even +/- offset in pips for “risk-free” trades.
VII) Logger
The Pineconnector commands are logged in the TradingView logger.
You'll find more information about it in this TradingView blog post .
WHY YOU MIGHT NEED THIS TEMPLATE
1) Transform your indicator into a Pineconnector trading bot more easily than before
Connect your indicator to the template
Create your alerts
Set your EA settings
2) Save Time
Auto-generated alert messages for Pineconnector.
I tested them all, and I checked with the support team what could/can’t be done
3) Be in Control
Manage your trading risks with advanced features.
4) Customizable
Fits various trading styles and asset classes.
REQUIREMENTS
* Make sure you have your Pineconnector license ID.
* Create your alerts with the Pineconnector webhook URL
* If there is any issue with the template, ask me in the comments section - I’ll answer quickly.
BACKTEST RESULTS FROM THIS POST
1) I connected this strategy template to a dummy Supertrend script.
I could have selected any other indicator or concept for this script post.
I wanted to share an example of how you can quickly upgrade your strategy, making it compatible with Pineconnector.
2) The backtest results aren't relevant for this educational script publication.
I used realistic backtesting data but didn't look too much into optimizing the results, as this isn't the point of why I'm publishing this script.
This strategy is a template to be connected to any indicator - the sky is the limit. :)
3) This template is made to take 1 trade per direction at any given time.
Pyramiding is set to 1 on TradingView.
The strategy default settings are:
* Initial Capital: 100000 USD
* Position Size: 1 contract
* Commission Percent: 0.075%
* Slippage: 1 tick
* No margin/leverage used
WHAT’S COMING NEXT FOR YOU GUYS?
I’ll make the same template for ProfitView, then for AutoView, and then for Alertatron.
All of those are free and open-source.
I have no affiliations with any of those companies - I'm publishing those templates as they will be useful to many of you.
Dave

Double AI Super Trend Trading - Strategy [PresentTrading]█ Introduction and How It is Different
The Double AI Super Trend Trading Strategy is a cutting-edge approach that leverages the power of not one, but two AI algorithms, in tandem with the SuperTrend technical indicator. The strategy aims to provide traders with enhanced precision in market entry and exit points. It is designed to adapt to market conditions dynamically, offering the flexibility to trade in both bullish and bearish markets.
*The KNN part is mainly referred from @Zeiierman.
BTCUSD 8hr performance
ETHUSD 8hr performance
█ Strategy, How It Works: Detailed Explanation
1. SuperTrend Calculation
The SuperTrend is a popular indicator that captures market trends through a combination of the Volume-Weighted Moving Average (VWMA) and the Average True Range (ATR). This strategy utilizes two sets of SuperTrend calculations with varying lengths and factors to capture both short-term and long-term market trends.
2. KNN Algorithm
The strategy employs k-Nearest Neighbors (KNN) algorithms, which are supervised machine learning models. Two sets of KNN algorithms are used, each focused on different lengths of historical data and number of neighbors. The KNN algorithms classify the current SuperTrend data point as bullish or bearish based on the weighted sum of the labels of the k closest historical data points.
3. Signal Generation
Based on the KNN classifications and the SuperTrend indicator, the strategy generates signals for the start of a new trend and the continuation of an existing trend.
4. Trading Logic
The strategy uses these signals to enter long or short positions. It also incorporates dynamic trailing stops for exit conditions.
Local picture
█ Trade Direction
The strategy allows traders to specify their trading direction: long, short, or both. This enables the strategy to be versatile and adapt to various market conditions.
█ Usage
ToolTips: Comprehensive tooltips are provided for each parameter to guide the user through the customization process.
Inputs: Traders can customize numerous parameters including the number of neighbors in KNN, ATR multiplier, and types of moving averages.
Plotting: The strategy also provides visual cues on the chart to indicate bullish or bearish trends.
Order Execution: Based on the generated signals, the strategy will execute buy or sell orders automatically.
█ Default Settings
The default settings are configured to offer a balanced approach suitable for most scenarios:
Initial Capital: $10,000
Default Quantity Type: 10% of equity
Commission: 0.1%
Slippage: 1
Currency: USD
These settings can be modified to suit various trading styles and asset classes.

Keltner Channel Strategy with Golden CrossOnly trade with the trend.
This Keltner Channel-based strategy that will only enter into a trade if the signal of the Keltner Channel agrees with a moving average crossover as defined by the user.
Long Position Entries
2 Conditions must be present
1. There must be a Golden Cross (lower period moving average is above higher period moving average). ex 50 period MA > 200 period MA.
2. Price must cross above the Keltner Channel ATR defined by the user.
Short Position Entries
2 Conditions must be present
1. There must be a Death Cross (lower period moving average is below higher period moving average). ex 50 period MA < 200 period MA.
2. Price must cross below the Keltner Channel ATR defined by the user
Closing Trades:
The strategy closes trades as follows:
1. Price crossing the Keltner Channel's Take Profit ATR (defined by User)
2. Price crossing the Keltner Channel's Stop Loss ATR (defined by User)

AI SuperTrend - Strategy [presentTrading]
█ Introduction and How it is Different
The AI Supertrend Strategy is a unique hybrid approach that employs both traditional technical indicators and machine learning techniques. Unlike standard strategies that rely solely on traditional indicators or mathematical models, this strategy integrates the power of k-Nearest Neighbors (KNN), a machine learning algorithm, with the tried-and-true SuperTrend indicator. This blend aims to provide traders with more accurate, responsive, and context-aware trading signals.
*The KNN part is mainly referred from @Zeiierman.
BTCUSD 8hr performance
ETHUSD 8hr performance
█ Strategy, How it Works: Detailed Explanation
SuperTrend Calculation
Volume-Weighted Moving Average (VWMA): A VWMA of the close price is calculated based on the user-defined length (len). This serves as the central line around which the upper and lower bands are calculated.
Average True Range (ATR): ATR is calculated over a period defined by len. It measures the market's volatility.
Upper and Lower Bands: The upper band is calculated as VWMA + (factor * ATR) and the lower band as VWMA - (factor * ATR). The factor is a user-defined multiplier that decides how wide the bands should be.
KNN Algorithm
Data Collection: An array (data) is populated with recent n SuperTrend values. Corresponding labels (labels) are determined by whether the weighted moving average price (price) is greater than the weighted moving average of the SuperTrend (sT).
Distance Calculation: The absolute distance between each data point and the current SuperTrend value is calculated.
Sorting & Weighting: The distances are sorted in ascending order, and the closest k points are selected. Each point is weighted by the inverse of its distance to the current point.
Classification: A weighted sum of the labels of the k closest points is calculated. If the sum is closer to 1, the trend is predicted as bullish; if closer to 0, bearish.
Signal Generation
Start of Trend: A new bullish trend (Start_TrendUp) is considered to have started if the current trend color is bullish and the previous was not bullish. Similarly for bearish trends (Start_TrendDn).
Trend Continuation: A bullish trend (TrendUp) is considered to be continuing if the direction is negative and the KNN prediction is 1. Similarly for bearish trends (TrendDn).
Trading Logic
Long Condition: If Start_TrendUp or TrendUp is true, a long position is entered.
Short Condition: If Start_TrendDn or TrendDn is true, a short position is entered.
Exit Condition: Dynamic trailing stops are used for exits. If the trend does not continue as indicated by the KNN prediction and SuperTrend direction, an exit signal is generated.
The synergy between SuperTrend and KNN aims to filter out noise and produce more reliable trading signals. While SuperTrend provides a broad sense of the market direction, KNN refines this by predicting short-term price movements, leading to a more nuanced trading strategy.
Local picture
█ Trade Direction
The strategy allows traders to choose between taking only long positions, only short positions, or both. This is particularly useful for adapting to different market conditions.
█ Usage
ToolTips: Explains what each parameter does and how to adjust them.
Inputs: Customize values like the number of neighbors in KNN, ATR multiplier, and moving average type.
Plotting: Visual cues on the chart to indicate bullish or bearish trends.
Order Execution: Based on the generated signals, the strategy will execute buy/sell orders.
█ Default Settings
The default settings are selected to provide a balanced approach, but they can be modified for different trading styles and asset classes.
Initial Capital: $10,000
Default Quantity Type: 10% of equity
Commission: 0.1%
Slippage: 1
Currency: USD
By combining both machine learning and traditional technical analysis, this strategy offers a sophisticated and adaptive trading solution.

YinYang RSI Volume Trend StrategyThere are many strategies that use RSI or Volume but very few that take advantage of how useful and important the two of them combined are. This strategy uses the Highs and Lows with Volume and RSI weighted calculations on top of them. You may be wondering how much of an impact Volume and RSI can have on the prices; the answer is a lot and we will discuss those with plenty of examples below, but first…
How does this strategy work?
It’s simple really, when the purchase source crosses above the inner low band (red) it creates a Buy or Long. This long has a Trailing Stop Loss band (the outer low band that's also red) that can be adjusted in the Settings. The Stop Loss is based on a % of the inner low band’s price and by default it is 0.1% lower than the inner band’s price. This Stop Loss is not only a stop loss but it can also act as a Purchase Available location.
You can get back into a trade after a stop loss / take profit has been hit when your Reset Purchase Availability After condition has been met. This can either be at Stop Loss, Entry or None.
It is advised to allow it to reset in case the stop loss was a fake out but the call was right. Sometimes it may trigger stop loss multiple times in a row, but you don’t lose much on stop loss and you gain lots when the call is right.
The Take Profit location is the basis line (white). Take Profit occurs when the Exit Source (close, open, high, low or other) crosses the basis line and then on a different bar the Exit Source crosses back over the basis line. For example, if it was a Long and the bar’s Exit Source closed above the basis line, and then 2 bars later its Exit Source closed below the basis line, Take Profit would occur. You can disable Take Profit in Settings, but it is very useful as many times the price will cross the Basis and then correct back rather than making it all the way to the opposing zone.
Longs:
If for instance your Long doesn’t need to Take Profit and instead reaches the top zone, it will close the position when it crosses above the inner top line (green).
Please note you can change the Exit Source too which is what source (close, open, high, low) it uses to end the trades.
The Shorts work the same way as the Long but just opposite, they start when the purchase source crosses under the inner upper band (green).
Shorts:
Shorts take profit when it crosses under the basis line and then crosses back.
Shorts will Stop loss when their outer upper band (green) is crossed with the Exit Source.
Short trades are completed and closed when its Exit Source crosses under the inner low red band.
So, now that you understand how the strategy works, let’s discuss why this strategy works and how it is profitable.
First we will discuss Volume as we deem it plays a much bigger role overall and in our strategy:
As I’m sure many of you know, Volume plays a huge factor in how much something moves, but it also plays a role in the strength of the movement. For instance, let’s look at two scenarios:
Bitcoin’s price goes up $1000 in 1 Day but the Volume was only 10 million
Bitcoin’s price goes up $200 in 1 Day but the Volume was 40 million
If you were to only look at the price, you’d say #1 was more important because the price moved x5 the amount as #2, but once you factor in the volume, you know this is not true. The reason why Volume plays such a huge role in Price movement is because it shows there is a large Limit Order battle going on. It means that both Bears and Bulls believe that price is a good time to Buy and Sell. This creates a strong Support and Resistance price point in this location. If we look at scenario #2, when there is high volume, especially if it is drastically larger than the average volume Bitcoin was displaying recently, what can we decipher from this? Well, the biggest take away is that the Bull’s won the battle, and that likely when that happens we will see bullish movement continuing to happen as most of the Bears Limit Orders have been fulfilled. Whereas with #2, when large price movement happens and Bitcoin goes up $1000 with low volume what can we deduce? The main takeaway is that Bull’s pressured the price up with Market Orders where they purchased the best available price, also what this means is there were very few people who were wanting to sell. This generally dictates that Whale Limit orders for Sells/Shorts are much higher up and theres room for movement, but it also means there is likely a whale that is ready to dump and crash it back down.
You may be wondering, what did this example have to do with YinYang RSI Volume Trend Strategy? Well the reason we’ve discussed this is because we use Volume multiple times to apply multiplications in our calculations to add large weight to the price when there is lots of volume (this is applied both positively and negatively). For instance, if the price drops a little and there is high volume, our strategy will move its bounds MUCH lower than the price actually dropped, and if there was low volume but the price dropped A LOT, our strategy will only move its bounds a little. We believe this reflects higher levels of price accuracy than just price alone based on the examples described above.
Don’t believe us?
Here is with Volume NOT factored in (VWMA = SMA and we remove our Volume Filter calculation):
Which produced -$2880 Profit
Here is with our Volume factored in:
Which produced $553,000 (55.3%)
As you can see, we wen’t from $-2800 profit with volume not factored to $553,000 with volume factored. That's quite a big difference! (Please note previous success does not predict future success we are simply displaying the $ amounts as example).
Now how about RSI and why does it matter in this strategy?
As I’m sure most of you are aware, RSI is one of the leading indicators used in trading. For this reason we figured it would only make sense to incorporate it into our calculations. We fiddled with RSI for quite awhile and sometimes what logically seems to be the right way to use it isn’t. Now, because of this, our RSI calculation is a little odd, but basically what we’re doing is we calculate the RSI, then turn it into a percentage (between 0-1) that can easily be multiplied to the price point we need. The price point we use is the difference between our high purchase zone and our low purchase zone. This allows us to see how much price movement there is between zones. We multiply our zone size with our RSI multiplication and we get the amount we will add +/- to our basis line (white line). This officially creates the NEW high and low purchase zones that we are actually using and displaying in our trades.
If you found that confusing, here are some examples to why it is an important calculation for this strategy:
Before RSI factored in:
Which produced 27.8% Profit
After RSI factored in:
Which produced 553% Profit
As you can see, the RSI makes not only the purchase zones more accurate, but it also greatly increases the profit the strategy is able to make. It also helps ensure an relatively linear profit slope so you know it is reliable with its trades.
This strategy can work on pretty much anything, but you should tweak the values a bit for each pair you are trading it with for best results.
We hope you can find some use out of this simple but effective strategy, if you have any questions, comments or concerns please let us know.
HAPPY TRADING!

Nifty 50 5mint Strategy
The script defines a specific trading session based on user inputs. This session is specified by a time range (e.g., "1000-1510") and selected days of the week (e.g., Monday to Friday). This session definition is crucial for trading only during specific times.
Lookback and Breakout Conditions:
The script uses a lookback period and the highest high and lowest low values to determine potential breakout points. The lookback period is user-defined (default is 10 periods).
The script also uses Bollinger Bands (BB) to identify potential breakout conditions. Users can enable or disable BB crossover conditions. BB consists of an upper and lower band, with the basis.
Additionally, the script uses Dema (Double Exponential Moving Average) and VWAP (Volume Weighted Average Price) . Users can enable or disable this condition.
Buy and Sell Conditions:
Buy conditions are met when the close price exceeds the highest high within the specified lookback period, Bollinger Bands conditions are satisfied, Dema-VWAP conditions are met, and the script is within the defined trading session.
Sell conditions are met when the close price falls below the lowest low within the lookback period, Bollinger Bands conditions are satisfied, Dema-VWAP conditions are met, and the script is within the defined trading session.
When either condition is met, it triggers a "long" or "short" position entry.
Trailing Stop Loss (TSL):
Users can choose between fixed points ( SL by points ) or trailing stop (Profit Trail).
For fixed points, users specify the number of points for the stop loss. A fixed stop loss is set at a certain distance from the entry price if a position is opened.
For Profit Trail, users can enable or disable this feature. If enabled, the script uses a "trail factor" (lookback period) to determine when to adjust the stop loss.
If the price moves in the direction of the trade and reaches a certain level (determined by the trail factor), the stop loss is adjusted, trailing behind the price to lock in profits.
If the close price falls below a certain level (lowest low within the trail factor(lookback)), and a position is open, the "long" position is closed (strategy.close("long")).
If the close price exceeds a certain level (highest high within the specified trail factor(lookback)), and a position is open, the "short" position is closed (strategy.close("short")).
Positions are also closed if they are open outside of the defined trading session.
Background Color:
The script changes the background color of the chart to indicate buy (green) and sell (red) signals, making it visually clear when the strategy conditions are met.
In summary, this script implements a breakout trading strategy with various customizable conditions, including Bollinger Bands, Dema-VWAP crossovers, and session-specific rules. It also includes options for setting stop losses and trailing stop losses to manage risk and lock in profits. The "trail factor" helps adjust trailing stops dynamically based on recent price movements. Positions are closed under certain conditions to manage risk and ensure compliance with the defined trading session.
CE=Buy, CE_SL=stoploss_buy, tCsl=Trailing Stop_buy.
PE=sell, PE_SL= stoploss_sell, tpsl=Trailing Stop_sell.
Remember that trading involves inherent risks, and past performance is not indicative of future results. Exercise caution, manage risk diligently, and consider the advice of financial experts when using this script or any trading strategy.

Currency Pair Strategy [ICEALGO]Indicator for trading with currency pairs
Get Access to ICEALGO indicators: icealgo.com
All scripts & content provided by ICEALGO are for informational & educational purposes only. Past performance does not guarantee future results.

Based RSI (BullDozz)Installation: To use this script, open TradingView and create a new Pine Script strategy. You can paste the code provided into the Pine Script editor.
Customizable Inputs: The script includes various input parameters that you can customize to fit your trading preferences. These parameters are defined using the input function and include values like length, TPPercent, and others. You can adjust these values based on your trading strategy.
Strategy Signals: The script generates buy and sell signals based on the conditions specified in the buySignal and sellSignal variables. These signals are derived from the analysis of the oscillator (osc) and the Relative Strength Index (rsi). When a buy signal occurs, the script enters a long position, and when a sell signal occurs, it enters a short position.
Take Profit: The script includes a take profit feature (useTP) that allows you to enable or disable take profit orders. When enabled, it calculates take profit levels based on the specified percent (TPPercent) and attaches them to the open positions.
Plotting: The script also visualizes the oscillator (osc) and a midline (0) on the chart using histogram-style bars. The colors of these bars change based on the oscillator's direction.

Dual-Supertrend with MACD - Strategy [presentTrading]## Introduction and How it is Different
The Dual-Supertrend with MACD strategy offers an amalgamation of two trend-following indicators (Supertrend 1 & 2) with a momentum oscillator (MACD). It aims to provide a cohesive and systematic approach to trading, eliminating the need for discretionary decision-making.
Key advantages over traditional single-indicator strategies:
- Dual Supertrend Validation: Utilizes two Supertrend indicators with different ATR periods and factors to confirm the trend direction. This double-check mechanism minimizes false signals.
- Momentum Confirmation: The MACD histogram acts as a momentum filter, confirming entries and exits, thus adding an extra layer of validation.
- Objective Entry and Exit: The strategy generates buy and sell signals based on a combination of trend direction and momentum, leaving no room for subjective interpretation.
- Automated Trade Management: The strategy includes built-in settings for commission, slippage, and initial capital, automating the trade execution process.
- Adaptability: The strategy allows for easy customization of all its parameters, adapting to a trader's specific needs and varying market conditions.
BTCUSD 8hr chart Long Condition
BTCUSD 6hr chart Long Short Condition
## Strategy, How it Works
The strategy operates on a set of clearly defined rules, primarily focusing on the trend direction confirmed by the Dual-Supertrend and the momentum as indicated by the MACD histogram.
### Entry Rules
- Long Entry: When both Supertrend indicators are bullish and the MACD histogram is above zero.
- Short Entry: When both Supertrend indicators are bearish and the MACD histogram is below zero.
### Exit Rules
- Exit long positions when either of the Supertrends turn bearish or the MACD histogram drops below zero.
- Exit short positions when either of the Supertrends turn bullish or the MACD histogram rises above zero.
### Trade Management
- The strategy uses a fixed commission rate and slippage in its calculations.
- Automated risk management features are integrated to avoid overexposure.
## Trade Direction
The strategy allows for trading in both bullish and bearish markets. Users can select their preferred trading direction ("long", "short", or "both") to align with their market outlook and trading objectives.
## Usage
- The strategy is best applied on timeframes where the trend is evident.
- Users can modify the ATR periods, factors for Supertrends, and MACD settings to suit their trading needs.
## Default Settings
- ATR Period for Supertrend 1: 10
- Factor for Supertrend 1: 3.0
- ATR Period for Supertrend 2: 20
- Factor for Supertrend 2: 5.0
- MACD Fast Length: 12
- MACD Slow Length: 26
- MACD Signal Smoothing: 9
- Commission: 0.1%
- Slippage: 1 point
- Trading Direction: Both
The strategy comes with these default settings to offer a balanced trading approach but can be customized according to individual trading preferences.
