I personally think short term maybe lower, but the purpose here is to consider the outcome of a new asset following the path of another with the participants being the same people. filb.
BTCUSD: Buyers have been found for 2 months below 16.5k 20 WMA sits around 18.3k which is also the current range high, previous support, and diag resistance. If it breaks that key level, the top of the wedge would be the target, also the 200 WMA c.$24k. Taking a guess at extremes of a range for the next 6 months its probably between 14.5 and 27k imo.
LTC also follows a halving cycle having effectively been a clone of BTC. LTC is due to have a halving in 2023. The previous cycle i posted the below chart which observed that LTC may lead the breakout from the cryto lows.. which it ultimately did, and retraced to and beyond the triangle breakdown in the bear market. There is a very similar set up to the...
Notes are on the chart, but generally, we are at the point in the cycle where we bottom and people start front-running the halving, with value flowing to Bitcoin first relatively and then to Alts after the halving. Bitcoin lost less dominance in this cycle and did not make new lows. Even if 2023 turns out to be a bad year for crypto and is counter to the...
If im right, it will be the last longs, gn. Tradingview want me to say more, so, I will say; trade at your own risk.
Sometimes humans overly complicate things. Another way of looking at S2F Heres a link to all the blockchain indicators incase you want to take a look.. yw. Other ideas;
$130 on fib extension to 2.618. Appropriately named.
The anatomy of the Parabolic phase is implicit of a big move forthcoming. See attached charts for previous cycle predictions.
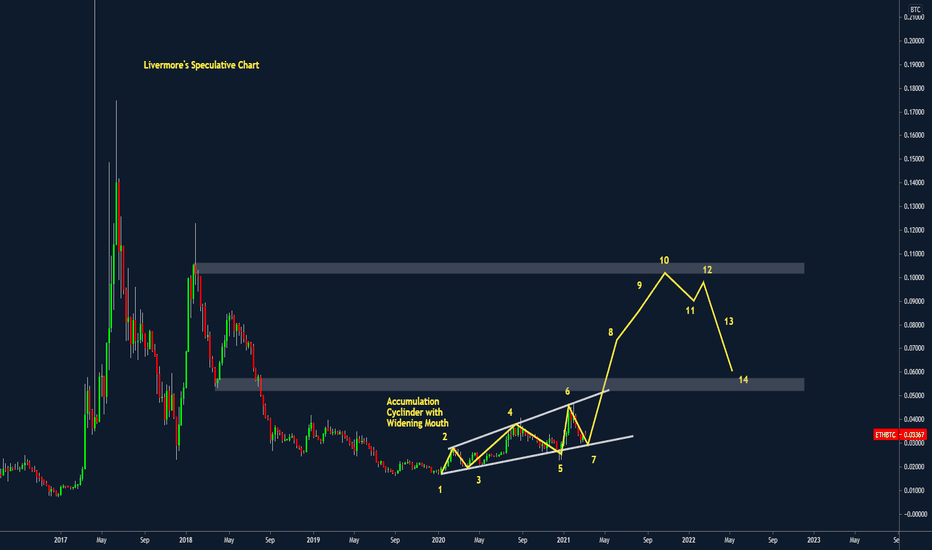
I wanted to share this potential roadmap for ETHBTC ahead of EIP1559 in July. Fits Livermore's schematic nicely and the weekly resistance levels also make sense. Lets see. filb.
Assuming No Stonk market implosion, Repeating fib extension to be fullfilled. Possible we run the lows at40k and fillin the elon inefficiency but otherwise.. trend frend and all that. Filb.
3.618 FIB circle Extention from high to lows call the top of the cycles? Big if true. Try it yourself. Just for fun but its odd to say the least.
So yesterday’s selloff largely induced by the Fed non-news event saw a decent response by the bulls who have brought price back across 11400, having defended the daily low/support at 11300. In context of the weekly chart, 11k appears to be holding as support but a close above the key 11500 support/resistance level would be the immediate objective to remain...
Side by side Asset performance: - 2020 YTD - 2020 Dump and Recovery - Crypto Massively on top YTD - SIlver best performer in class since corona - Money flow to Crypo, Metals, Tech Stocks - Industry lagging; oil , major indices - Rekt: UK
- Hasnt Broken out like other coins - Bull flag below resistance - Higher highs on OBV - Flag target: $4 - Full measured move target: $5.
Clearly defined Monthly ranges on the Bitcoin Chart. A Superb recovery fo the price of Bitcoin but approaching major supply zone. Could see a climatic Fomo halving attempt across $10k which may prove too much for the bulls to close on the monthly and more time in the range 9.2 - 6.5 could be needed. It might be frustrating for the bulls but would provide a...
With the world markets in Turmoil, Bitcoin has managed to bounce around 70% from its lows and we now find ourselves at round $7k at the time of writing. It makes sense to have a review of the market to see how things are shaping up. What we currently know is that Bitcoin is trading below all the key moving averages and the yearly pivot, we know that losing...
Money adjusted shows the impact of the brrr over at the Fed
The Price of Bitcoin has continued to waft to the upside, elegantly respecting support and resistance at key moving averages and volume nodes. A fundamental lack of sellers after capitulation has led short speculators to be squeezed as they either try to find liquidity to take profit or simply speculating short against real buy interest and continued profit...


