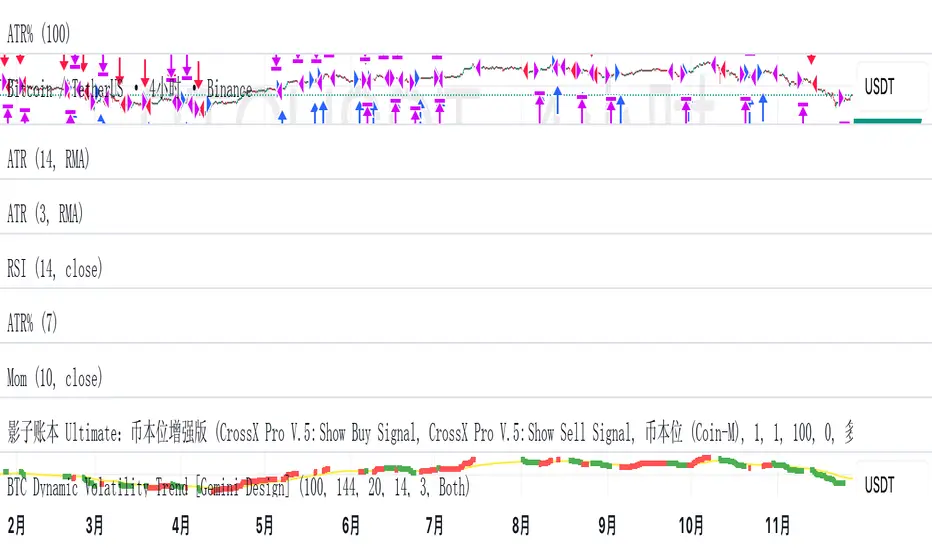
BTC Dynamic Volatility Trend Backtested from 2017 to present, this strategy has delivered a staggering 7100%+ cumulative return. It doesn't just track the market; it dominates it. By capturing major trends and strictly limiting drawdowns, it has significantly outperformed the standard 'Buy & Hold' BTC strategy, proving its ability to generate massive alpha across multiple bull and bear cycles.
自 2017 年至今,本策略实现了惊人的 7100%+ 累计收益率。它不仅仅是跟随市场,更是超越了市场。通过精准捕捉主升浪并严格控制回撤,该策略在穿越多轮牛熊周期后,大幅度跑赢了比特币‘买入持有’(Buy & Hold)的基准收益,展现了极致的阿尔法(Alpha)捕捉能力。"
Introduction :Simplicity is the ultimate sophistication. This strategy is designed specifically for Bitcoin (BTC), capturing its unique characteristics: high volatility, frequent fakeouts, and massive trend persistence. It abandons complex indicators in favor of a robust logic: "Follow the Trend, Filter the Noise, Let Profits Run."
Core Logic
Trend Filter (Fibonacci EMA 144): We use the 144-period Exponential Moving Average as the baseline. Longs are only taken above this line, and shorts only below. This keeps you on the right side of the major trend.
Volatility Breakout (Donchian Channel 20): Entries are triggered only when price breaks the 20-day high (for longs) or low (for shorts). This confirms momentum and avoids trading in chop.
Dynamic Risk Management (ATR Chandelier Exit):
Instead of fixed % stops, we use Average True Range (ATR) to calculate stop losses.
The Ratchet Mechanism: The stop loss moves up with the price but never moves down (for longs). This locks in profits automatically as the trend develops and exits immediately when volatility turns against you.
Why Use This Strategy?
Zero Repainting: All signals are confirmed.
No Curve Fitting: Uses classic parameters (144, 20) that have worked for decades.
Mental Peace: The strategy handles the exit. You don't need to guess where to sell. It holds through minor corrections and exits only when the trend truly reverses.
Settings
Leverage %: Adjust your position size based on equity (default 100% = 1x).
Timeframe: Recommended for 4H charts.
中文版 (Chinese Version)
简介 :大道至简。本策略专为 比特币 (BTC) 设计,针对其高波动、假突破多但趋势爆发力强的特点,摒弃了复杂的过度拟合指标,回归交易本质:“顺大势,滤噪音,截断亏损,让利润奔跑”。
核心逻辑
趋势过滤器 (斐波那契 EMA 144): 使用 144 周期指数移动平均线作为多空分水岭。价格在均线之上只做多,之下只做空。这能有效过滤掉大部分震荡市的噪音。
波动率突破 (唐奇安通道 20): 只有当价格突破过去 20 根 K 线的最高价(做多)或最低价(做空)时才进场。这确保了我们只在趋势确立的瞬间入场。
动态风控 (ATR 吊灯止损):
拒绝固定点数止损,使用 ATR(平均真实波幅)根据市场热度动态计算安全距离。
棘轮机制: 止损线会跟随价格上涨而上移,但绝不会下移(做多时)。这实现了自动化的“利润锁定”,既能扛住正常的波动回调,又能在大势反转时果断离场。
策略优势
绝不重绘: 所有信号均为收盘确认或实时触价。
拒绝拟合: 使用经过数十年市场验证的经典参数组合。
心态管理: 策略全自动管理出场。你不需要纠结何时止盈,它会帮你吃到完整的鱼身,直到趋势结束。
使用建议
资金管理: 可通过参数调整仓位占比(默认 100% = 1倍杠杆)。
推荐周期: 建议在4小时 图表上运行效果最佳。
Volatility
US Market Long Horizon Momentum Summary in one paragraph
US Market Long Horizon Momentum is a trend following strategy for US index ETFs and futures built around a single eighteen month time series momentum measure. It helps you stay long during persistent bull regimes and step aside or flip short when long term momentum turns negative.
Scope and intent
• Markets. Large cap US equity indices, liquid US index ETFs, index futures
• Timeframes. 4h/ Daily charts
• Default demo used in the publication. SPY on 4h timeframe chart
• Purpose. Provide a minimal long bias index timing model that can reduce deep drawdowns and capture major cycles without parameter mining
• Limits. This is a strategy. Orders are simulated on standard candles only
Originality and usefulness
• Unique concept or fusion. One unscaled multiple month log return of an external benchmark symbol drives all entries and exits, with optional volatility targeting as a single risk control switch.
• Failure mode addressed. Fully passive buy and hold ignores the sign of long horizon momentum and can sit through multi year drawdowns. This script offers a way to step down risk in prolonged negative momentum without chasing short term noise.
• Testability. All parameters are visible in Inputs and the momentum series is plotted so users can verify every regime change in the Tester and on price history.
• Portable yardstick. The log return over a fixed window is a unit that can be applied to any liquid symbol with daily data.
Method overview in plain language
The method looks at how far the benchmark symbol has moved in log return terms over an eighteen month window in our example. If that long horizon return is positive the strategy allows a long stance on the traded symbol. If it is negative and shorts are enabled the strategy can flip short, otherwise it goes flat. There is an optional realised volatility estimate on the traded symbol that can scale position size toward a target annual volatility, but in the default configuration the model uses unit leverage and only the sign of momentum matters.
Base measures
Return basis. The core yardstick is the natural log of close divided by the close eighteen months ago on the benchmark symbol. Daily log returns of the traded symbol feed the realised volatility estimate when volatility targeting is enabled.
Components
• Component one Momentum eighteen months. Log of benchmark close divided by its close mom_lookback bars ago. Its sign defines the trend regime. No extra smoothing is applied beyond the long window itself.
• Component two Realised volatility optional. Standard deviation of daily log returns on the traded symbol over sixty three days. Annualised by the square root of 252. Used only when volatility targeting is enabled.
• Optional component Volatility targeting. Converts target annual volatility and realised volatility into a leverage factor clipped by a maximum leverage setting.
Fusion rule
The model uses a simple gate. First compute the sign of eighteen month log momentum on the benchmark symbol. Optionally compute leverage from volatility. The sign decides whether the strategy wants to be long, short, or flat. Leverage only rescales position size when enabled and does not change direction.
Signal rule
• Long suggestion. When eighteen month log momentum on the benchmark symbol is greater than zero, the strategy wants to be long.
• Short suggestion. When that log momentum is less than zero and shorts are allowed, the strategy wants to be short. If shorts are disabled it stays flat instead.
• Wait state. When the log momentum is exactly zero or history is not long enough the strategy stays flat.
• In position. In practice the strategy sits IN LONG while the sign stays positive and flips to IN SHORT or flat only when the sign changes.
Inputs with guidance
Setup
• Momentum Lookback (months). Controls the horizon of the log return on the benchmark symbol. Typical range 6 to 24 months. Raising it makes the model slower and more selective. Lowering it makes it more reactive and sensitive to medium term noise.
• Symbol. External symbol used for the momentum calculation, SPY by default. Changing it lets you time other indices or run signals from a benchmark while trading a correlated instrument.
Logic
• Allow Shorts. When true the strategy will open short positions during negative momentum regimes. When false it will stay flat whenever momentum is negative. Practical setting is tied to whether you use a margin account or an ETF that supports shorting.
Internal risk parameters (not exposed as inputs in this version) are:
• Target Vol (annual). Target annual volatility for volatility targeting, default 0.2.
• Vol Lookback (days). Window for realised volatility, default 63 trading days.
• Max Leverage. Cap on leverage when volatility targeting is enabled, default 2.
Usage recipes
Swing continuation
• Signal timeframe. Use the daily chart.
• Benchmark symbol. Leave at SPY for US equity index exposure.
• Momentum lookback. Eighteen months as a default, with twelve months as an alternative preset for a faster swing bias.
Properties visible in this publication
• Initial capital. 100000
• Base currency. USD
• Default order size method. 5% of the total capital in this example
• Pyramiding. 0
• Commission. 0.03 percent
• Slippage. 3 ticks
• Process orders on close. On
• Bar magnifier. Off
• Recalculate after order is filled. Off
• Calc on every tick. Off
• All request.security calls use lookahead = barmerge.lookahead_off
Realism and responsible publication
The strategy is for education and research only. It does not claim any guaranteed edge or future performance. All results in Strategy Tester are hypothetical and depend on the data vendor, costs, and slippage assumptions. Intrabar motion is not modeled inside daily bars so extreme moves and gaps can lead to fills that differ from live trading. The logic is built for standard candles and should not be used on synthetic chart types for execution decisions.
Performance is sensitive to regime structure in the US equity market, which may change over time. The strategy does not protect against single day crash risk inside bars and does not model gap risk explicitly. Past behavior of SPY and the momentum effect does not guarantee future persistence.
Honest limitations and failure modes
• Long sideways regimes with small net change over eighteen months can lead to whipsaw around the zero line.
• Very sharp V shaped reversals after deep declines will often be missed because the model waits for momentum to turn positive again.
• The sample size in a full SPY history is small because regime changes are infrequent, so any test must be interpreted as indicative rather than statistically precise.
• The model is highly dependent on the chosen lookback. Users should test nearby values and validate that behavior is qualitatively stable.
Legal
Education and research only. Not investment advice. You are responsible for your own decisions. Always test on historical data and in simulation with realistic costs before any live use.

VWAP Pullback + BOS + OBV v2 (Crypto Futures 15m)This strategy combines VWAP pullbacks, break-of-structure entries, and OBV confirmation to catch high-quality trend continuation moves on crypto futures. It waits for price to trend above or below the 200 EMA, then pulls back into the VWAP band, signaling a potential reload zone. A trade only triggers when price breaks recent structure in the direction of the trend and OBV shows supportive volume flow. An ATR volatility filter blocks entries during choppy, low-energy periods, and all trades use an ATR stop-loss with fixed reward-to-risk targeting. The result is a cleaner, more disciplined trend-following system designed for 15m–30m BTC/ETH scalping.

Bollinger Bands Mean Reversion using RSI [Krishna Peri]How it Works
Long entries trigger when:
- RSI reaches oversold levels, and
- At least one bullish candle closes inside the lower Bollinger Band
Short entries trigger when:
- RSI reaches overbought levels, and
- At least one bearish candle closes inside the upper Bollinger Band
This approach aims to capture exhaustion moves where price pushes into extreme deviation from its mean and then snaps back toward the middle band.
Important Disclaimer
This is a mean-reversion strategy, which means it performs best in sideways, ranging, or slowly oscillating market conditions. When markets shift into strong trends, Bollinger Bands expand and volatility increases, which may cause some signals to become inaccurate or fail altogether.
For best results, combine this script with:
- Price action
- Market structure
- Higher-timeframe trend context
- Previous day/week/month highs & lows
- Untested liquidity levels or imbalance zones
- Session timing (Asia, London, NY)
Using these confluences helps filter out low-probability trades and significantly improves consistency and precision.

ACD STRATEGYACD Opening Range Strategy based off of the strategy of Mark Fischer. It trades off the MGC opening range of all 3 sessions (LDN, ASN, NY)

Robrechtian Long-Medium Breakout Trend SystemRobrechtian Long–Medium-Term Breakout Trend System
A professional, rule-based trend-following strategy designed to capture large, sustained price movements using pure price action and breakouts.
This system follows long-established trend-following philosophy: no prediction, no volatility targeting, and no profit targets. Only disciplined entries, position additions, and exits driven entirely by trend structure.
Core Principles
Breakout-driven entries: Initial positions are taken only when price breaks above/below the 80-day Donchian channel, confirming a long–medium-term trend shift.
Short-term confirmation: Breakouts must also exceed the 20-day channel, reducing false positives.
Trend-direction filter: A 50-day moving average slope filter ensures alignment with the broader trend.
Explosive bar filter: Entries avoid excessively large, single-candle expansions (>2.5× ATR(20)) to prevent chasing exhaustion spikes.
Pyramiding into strength: Additional units are added only when price makes fresh 20-day breakouts in the direction of the trend. No scaling out. No adding on dips.
Exit only on trend violation: Positions are closed exclusively when price breaks the opposite 80-day channel. This preserves unlimited upside while enforcing disciplined exits.
Pure trend philosophy: No volatility targeting, no smoothing, no discretionary overrides, no optimization for short-term performance.
Intended Use
This system is designed primarily for diversified futures portfolios, where diversification across dozens of globally liquid markets creates robustness and stability. However, it may also be used on individual assets for educational and analytical purposes.
The system embraces the core trend-following logic:
Small losses, big winners, and unlimited upside when trends persist.
⚠️ WARNINGS / DISCLAIMERS
⚠️ Warning 1 — This strategy is not optimized for single stocks
The Robrechtian Trend System is designed for multi-asset futures portfolios, not single equities.
Performance on individual tickers may vary greatly due to lack of diversification.
⚠️ Warning 2 — Trend following includes substantial drawdowns
Deep drawdowns are a normal and expected feature of all long-term trend-following systems.
The strategy does not attempt to smooth returns or manage volatility.
If you seek steady, low-volatility equity curves, this system is not suitable.
⚠️ Warning 3 — No volatility targeting or risk smoothing
This system intentionally avoids volatility-based position sizing.
Trades may experience larger fluctuations than systems using risk parity or vol targeting.
⚠️ Warning 4 — Not financial advice
This script is for educational and research purposes only.
Past performance does not guarantee future results.
Use at your own risk.
⚠️ Warning 5 — TradingView backtests have known limitations
TradingView does not simulate:
futures contract roll logic
slippage
real bid/ask spreads
liquidity conditions
limit-up/limit-down behavior
Results may vary from live market execution.

Triple EMA + RSI + ATRThis comprehensive trading system combines triple EMA alignment, RSI momentum filtering, and dynamic ATR-based risk management. The strategy enters positions only when fast, medium, and slow EMAs align in proper order (bullish or bearish), confirmed by RSI remaining within defined thresholds (not overbought/oversold) and a volume spike above its moving average. Exits are managed intelligently using a multi-tier approach: a fixed stop-loss based on ATR, a first profit target at a predefined risk-reward ratio, and a trailing stop that activates after reaching a second, higher profit tier. Designed for trend-following with built-in momentum and volume confirmation, it features professional order execution with configurable commission and slippage for realistic backtesting. Visual cues including colored backgrounds and signal shapes enhance chart clarity.

51 - By GoldmanMrBaNNathis script is a multi-timeframe alignment tool designed to help users visually compare the trend direction of a higher timeframe with the movement on a lower timeframe.
The indicator simply displays when both selected timeframes are moving in the same direction based on a customizable trend-detection method (such as moving average alignment).
Its purpose is to provide clarity, structure, and directional alignment for chart analysis.
Users can select:
A higher timeframe
A lower timeframe
Trend calculation method
Visual display options
The tool is made to support analysis only.
It does not execute trades, generate financial advice, or guarantee outcomes.
Always use additional independent research when making decisions.

Cat Cushion Position SizingThis strategy is for people who don’t want to guess position size every time.
It looks at how volatile the market is and then tells you how many units to hold so your risk per trade stays roughly the same – whether the chart is calm or crazy.
What it does
Measures how “shaky” the price is day by day (volatility)
Blends recent volatility with a long-term average so it doesn’t overreact to one weird day
Uses your Risk per Trade (%) setting to calculate how big your position should be
Adds a buffer zone so it doesn’t trade every tiny wiggle and burn commissions
Shows a small performance table on the chart:
• Average annual return (from backtest)
• Sharpe ratio
• Average drawdown per trade
• Current position size as % of equity
How it thinks about risk
When the market is calmer → volatility is lower → position size can be bigger
When the market is wild → volatility is higher → position size becomes smaller
You control the “spiciness” with:
• Risk per Trade (%) – how much of your equity you’re willing to risk on each position
• Change Sensitivity (%) – wider buffer = fewer trades, lower costs; tighter buffer = more frequent rebalancing
Good use cases
Index ETFs (e.g. AMEX:SPY , NASDAQ:ACWI ) or other liquid instruments
People who:
• Already have a direction/idea (bullish on the index long term)
• Want the position sizing to adapt automatically with volatility
• Prefer “set the rules, let it run” rather than staring at the screen
Inputs to pay attention to
Risk per Trade (%)
• Conservative: ~1–2%
• Balanced: ~3–4%
• Aggressive: 5%+ (handle with care)
Important notes
This is a position sizing / risk strategy, not a magical “always win” tool
Works best when combined with:
• A clear idea of what you want to trade (e.g. broad index ETFs)
• A realistic risk profile (don’t just max the risk because the backtest looks better)
Backtest results are not a promise of future returns
Educational use only – this is not financial advice. Please test on your own, tweak to your comfort level, and don’t bet the rent money 😉
If you like systematic, “low-drama” investing (and want to spend more time chilling like a cat 🐱), this script helps the math side stay under control in the background.

MPI Strategy (Hardcoded 2025)MPI Strategy (Hardcoded 2025)MPI Strategy (Hardcoded 2025)MPI Strategy (Hardcoded 2025)MPI Strategy (Hardcoded 2025)

NYAM Trend PullbackThis is an trend-following strategy designed for trades taken during New York Morning. It aims to capture trend continuations by entering positions when price aligns with the dominant trend relative to a Exponential Moving Average (EMA).
If price is above the EMA then it is bullish and enters long, and if its below the EMA it is bearish and enters a short.

Supertrend Cloud ProSupertrend Cloud Pro is a next-generation trend + breakout system designed for traders who want clean structure, early breakout confirmation, and disciplined exits.
The strategy combines Fast + Slow Supertrend layers, a dynamic cloud compression model , and a breakout-based entry engine to deliver clarity in trending as well as contracting markets.
How It Works
1. Dual Supertrend Structure (Fast + Slow)
Fast ST reacts quickly to volatility
Slow ST establishes dominant trend bias
Combined color logic instantly reveals market direction
Green Cloud → Bullish Trend
Red Cloud → Bearish Trend
Yellow Cloud → Compression / Squeeze Zone
2. Cloud Compression Logic
The zone between Fast/Slow Supertrend creates a structure-based “cloud.”
When price enters this zone, markets are typically preparing for expansion.
Yellow shading highlights these high-probability breakout zones.
3. Breakout Entry Engine
Long Entry : Price closes above the cloud top
Short Entry: Price closes below the cloud bottom
This avoids premature entries and filters out false noise.
4. Smart Exit Logic
Positions exit automatically when Fast or Slow Supertrend flips direction, ensuring disciplined exit and minimizing emotional decisions.

Pro Bollinger Bands Strategy [Breno]This strategy excels in highly volatile financial instruments, including cryptocurrencies, high-beta stocks, commodity futures, and certain exchange-traded funds (ETFs) that exhibit clear mean-reversion characteristics around their Bollinger Bands. The system's ability to utilize scaling (position averaging) and an ATR-based stop loss makes it particularly effective in markets with significant price swings, allowing the trader to capture profits from price extremes while managing increased volatility-related risk.
Core Strategy Logic
This Strategy implements a comprehensive trend-following and mean-reversion strategy primarily leveraging the Bollinger Bands (BB) indicator for entry and exit signals, complemented by an Average True Range (ATR)-based Stop Loss mechanism and an optional EMA filter. It is designed with robust features for capital management, including configurable leverage and a sophisticated position averaging (scaling) system.
Long Entry: A long position is initiated when the closing price crosses over the Lower Bollinger Band (ta.crossover(close,lowerBB)). This signals a potential mean-reversion opportunity following a price dip.
Short Entry: A short position is initiated when the closing price crosses under the Upper Bollinger Band (ta.crossunder(close,upperBB)). (Note: Short entries are disabled by default in the script inputs).
Exit Conditions (Profit Target): Long positions aim to exit upon interaction with the Upper Bollinger Band. Users can select from three exit methods:
"Close When Touch": Exits when close≥upperBB.
"Close Above then Below": Exits when the previous close was above the upper band, and the current close is below it (a reversal signal).
"High Above": Exits when high>upperBB. The strategy features an optional profitOnly setting, which restricts all exits to only occur if the trade is currently in profit (i.e., close is above the strategy.position_avg_price for longs).
Key Features and Customization
Bollinger Bands & Filters -
Customizable BB Parameters: The Length and Deviation of the Bollinger Bands are fully adjustable, allowing users to fine-tune the sensitivity of the entry and exit signals.
Optional EMA Filter: An optional EMA Filter can be enabled to align entries with the prevailing trend, where a Long entry is only permitted if close≥EMA(EmaFilterRange).
Risk and Capital Management -
Equity Allocation: Position size is dynamically calculated based on a Percentage of Equity (capitalPerc) combined with the set Leverage multiplier.
Dynamic Stop Loss (ATR-Based):
An optional Stop Loss (SL) is calculated using a multiple (slAtrInput) of the Average True Range (ATR).
The SL is set relative to the entry price upon trade activation, providing a volatility-adjusted risk management layer.
Position Averaging (Scaling): The script supports the addition of multiple units (pyramiding) to an existing position based on three user-selected criteria:
"No": No averaging.
"Percent": Adds to the position if the price has dropped by a set percentage (addPct) from the average price.
"ATR": Adds to the position if the current price is significantly below a calculated ATR-based support level from the average price.

XRP Non-Stop Strategy (TP 25% / SL 15%)XRP Non-Stop Strategy (TP 25% / SL 15%) is a continuous long-side trading system designed specifically for XRP. The strategy uses an EMA-based trend filter (EMA20/EMA50) to confirm bullish conditions before entering a long position. Each trade applies a fixed +25% Take Profit target and a −15% Stop Loss, calculated dynamically from the entry price.
When a trade closes—whether by TP or SL—the strategy automatically re-enters on the next qualifying signal, enabling uninterrupted position cycling.
Features include:
• EMA-based trend confirmation
• Dynamic TP/SL visualization on the chart
• Clear BUY and EXIT markers
• Dedicated alert conditions for automation

XRP Non-Stop Strategy (TP 25% / SL 15%)This strategy performs continuous automated trading exclusively on XRP. It opens long positions during favorable trend conditions, using a fixed Take Profit target of 25% above the entry price and a fixed Stop Loss of 15% below the entry. Once a trade is closed (either TP or SL), the strategy automatically re-enters on the next valid signal, enabling uninterrupted trading.
The script includes:
Dynamic Take Profit & Stop Loss lines
Optional EMA trend filter
Visual BUY and EXIT markers
TradingView alerts for automation or notifications
This strategy is built for traders who want a simple, price-action-driven system without fixed price levels, relying only on percentage-based movement from each entry.

Strategy: HMA 50 + Supertrend SniperHMA 50 + Supertrend Confluence Strategy (Trend Following with Noise Filtering)
Description:
Introduction and Concept This strategy is designed to solve a common problem in trend-following trading: Lag vs. False Signals. Standard Moving Averages often lag too much, while price action indicators can generate false signals during choppy markets. This script combines the speed of the Hull Moving Average (HMA) with the volatility-based filtering of the Supertrend indicator to create a robust "Confluence System."
The primary goal of this script is not just to overlay two indicators, but to enforce a strict rule where a trade is only taken when Momentum (HMA) and Volatility Direction (Supertrend) are in perfect agreement.
Why this combination? (The Logic Behind the Mashup)
Hull Moving Average (HMA 50): We use the HMA because it significantly reduces lag compared to SMA or EMA by using weighted calculations. It acts as our primary Trend Direction detector. However, HMA can be too sensitive and "whipsaw" during sideways markets.
Supertrend (ATR-based): We use the Supertrend (Factor 3.0, Period 10) as our Volatility Filter. It uses Average True Range (ATR) to determine the significant trend boundary.
How it Works (Methodology) The strategy uses a boolean logic system to filter out low-quality trades:
Bullish Confluence: The HMA must be rising (Slope > 0) AND the Close Price must be above the Supertrend line (Uptrend).
Bearish Confluence: The HMA must be falling (Slope < 0) AND the Close Price must be below the Supertrend line (Downtrend).
The "Choppy Zone" (Noise Filter): This is a unique feature of this script. If the HMA indicates one direction (e.g., Rising) but the Supertrend indicates the opposite (e.g., Downtrend), the market is considered "Choppy" or indecisive. In this state, the script paints the candles or HMA line Gray and exits all positions (optional setting) to preserve capital.
Visual Guide & Signals To make the script easy to interpret for traders who do not read Pine Script, I have implemented specific visual cues:
Green Cross (+): Indicates a LONG entry signal. Both HMA and Supertrend align bullishly.
Red Cross (X): Indicates a SHORT entry signal. Both HMA and Supertrend align bearishly.
Thick Line (HMA): The main line changes color based on the trend.
Green: Bullish Confluence.
Red: Bearish Confluence.
Gray: Divergence/Choppy (No Trade Zone).
Thin Step Line: This is the Supertrend line, serving as your dynamic Trailing Stop Loss.
Strategy Settings
HMA Length: Default is 50 (Mid-term trend).
ATR Factor/Period: Default is 3.0/10 (Standard for trend catching).
Exit on Choppy: A toggle switch allowing users to decide whether to hold through noise or exit immediately when indicators disagree.
Risk Warning This strategy performs best in trending markets (Forex, Crypto, Indices). Like all trend-following systems, it may experience drawdown during prolonged accumulation/distribution phases. Please backtest with your specific asset before using it with real capital.

Trend Flow & Volatility Guard Strategy [ROSTOK V5]Description:
This strategy is a comprehensive trend-following system designed to identify high-probability entries by aligning long-term market direction with short-term momentum, while strictly filtering out low-quality "choppy" market conditions.
How it Works:
The strategy operates on a multi-stage logic system:
Trend Identification: The core direction is determined by a customizable Main Trend Line (selectable between a long-period EMA or Supertrend). Trades are only taken in the direction of the dominant trend.
Signal Generation: Entries are triggered when a fast-moving Signal Line crosses the Main Trend Line, confirmed by specific candlestick price action (Close > Open).
Advanced Filtering (Confluence): To avoid false signals, the strategy employs a robust set of filters. A trade is only valid if:
Momentum: RSI is within safe operating zones (avoiding extreme overbought/oversold unless a strong trend override is active).
Cycle: CCI and MACD histograms align with the trade direction.
Volatility: The ADX is analyzed to ensure sufficient trend strength, while a Choppiness Index filter blocks trades during sideways/ranging markets.
Risk Management & Recovery: The strategy features built-in money management tools, including:
ADR (Average Daily Range) Filter: Prevents entering trades when the asset has already moved its expected daily distance.
Daily Limits: Hard stops for Max Daily Loss and Target Daily Profit to preserve capital.
Recovery Logic: An optional mechanism to manage drawdowns on difficult days using calculated recovery targets.
Settings & Customization: Users can toggle individual filters (Volume, Choppiness, ADX) and adjust the sensitivity of the trend lines to fit different assets and timeframes (e.g., EURAUD 15m).
Disclaimer: Past performance is not indicative of future results. This script is for educational purposes and backtesting analysis.

Oleg_Aryukov_StrategyTrader Oleg Aryukov's strategy, based on a variety of oscillators, allows him to try to catch reversals in cryptocurrencies.

AliceTears GridAliceTears Grid is a customizable Mean Reversion system designed to capitalize on market volatility during specific trading sessions. Unlike standard grid bots that place blind limit orders, this strategy establishes a daily or session-based "Baseline" and looks for price over-extensions to fade the move back to the mean.
This strategy is best suited for ranging markets (sideways accumulation) or specific forex sessions (e.g., Asian Session or NY/London overlap) where price tends to revert to the opening price.
🛠 How It Works
1. The Baseline & Grid Generation At the start of every session (or the daily open), the script records the Open price. It then projects visual grid lines above and below this price based on your Step % input.
Example: If the Open is $100 and Step is 1%, lines are drawn at $101, $102, $99, $98, etc.
2. Entry Logic: Reversal Mode This script features a "Reversal Mode" (enabled by default) to filter out "falling knives."
Standard Grid: Buys immediately when price touches the line.
AliceTears Logic: Waits for the price to breach a grid level and then close back inside towards the mean. This confirms a potential rejection of that level before entering.
3. Exit Logic
Target Profit: The primary target is the previous grid level (Mean Reversion).
Trailing Stop: If the price continues moving in your favor, a trailing stop activates to maximize the run.
Stop Loss: A manual percentage-based stop loss is available to prevent deep drawdowns in trending markets.
⚙️ Key Features
Visual Grid: Automatically draws entry levels on the chart for the current session, helping you visualize where the "math" is waiting for price.
Timezone & Session Control: Includes a custom Timezone Offset tool. You can trade specific hours (e.g., 09:30–16:00) regardless of your chart's UTC setting.
Grid Management: Independent logic for Long and Short grids with pyramiding capabilities.
Safety Filters: Options to force-close trades at the end of the session to avoid overnight gaps.
⚠️ Risk Warning
Please Read Before Using: This is a Counter-Trend / Grid Strategy.
Pros: High win rate in sideways/ranging markets.
Cons: In strong trending markets (parabolic pumps or crashes), this strategy will add to losing positions ("catch a falling knife").
Recommendation: Always use the Stop Loss and Date Filter inputs. Do not run this on highly volatile assets without strict risk management parameters.
Settings Guide
Entry Reversal Mode: Keep checked for safer entries. Uncheck for aggressive limit-order style execution.
Grid Step (%): The distance between lines. For Forex, use lower values (0.1% - 0.5%). For Crypto, use higher values (1.0% - 3.0%).
UTC Offset: Adjust this to align the Session Hours with your target market (e.g., -5 for New York).
This script is open source. Feel free to use it for educational purposes or modify it to fit your trading style.

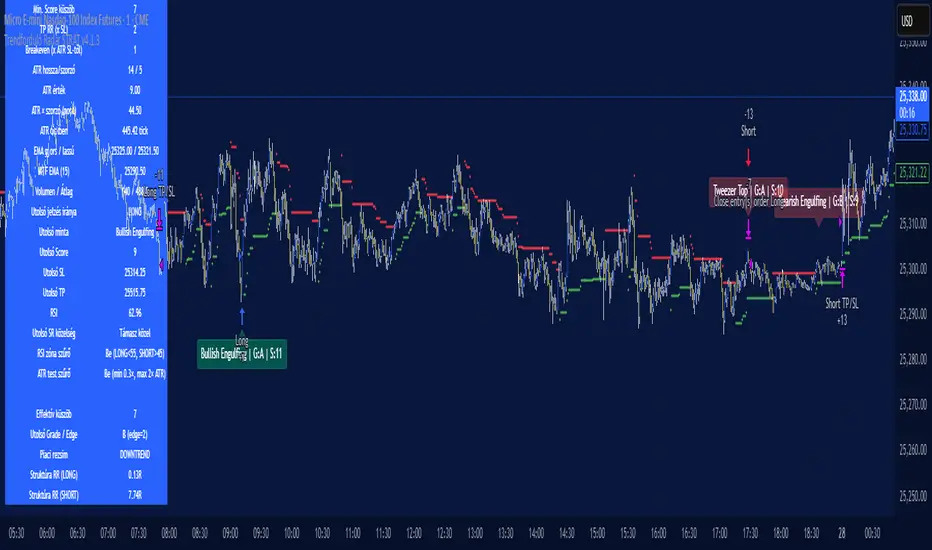
Trendforduló Radar STRAT v4.1.3Trend Reversal Radar is a proprietary indicator that examines potential turning points in market trends. It combines data from multiple time frames, support and resistance levels, and volume movements to provide visual signals to traders. Its purpose is not to provide trading advice, but to complement technical analysis and provide more confident decision support.- A Trendforduló Radar egy saját fejlesztésű indikátor, amely a piaci trendek lehetséges fordulópontjait vizsgálja. Több idősík adatait, támasz–ellenállás szinteket és volumenmozgásokat kombinálva ad vizuális jelzést a kereskedőnek. A célja nem a kereskedési tanácsadás, hanem hogy kiegészítse a technikai elemzést és magabiztosabb döntéstámogatást adjon.
Dynamic Ratchet Trend Strategy [VIX Filter]Overview This strategy is a long-only trend-following system designed to capture major market moves while strictly managing downside risk through a state-machine based "Ratchet" exit logic. It incorporates a volatility filter using the CBOE VIX index to stay out of (or exit) the market during high-stress environments.
Key Features
1. Multi-Condition Entries The strategy looks for momentum shifts and trend breakouts using four Simple Moving Averages (25, 50, 100, 200).
Momentum Cross: SMA 25 crossover above SMA 50.
Trend Breakouts: A specific "3-Bar Breakout" logic above the SMA 50, 100, or 200. This requires the price to hold above the SMA for 3 consecutive bars after being below it, reducing false signals compared to simple closes.
2. VIX Volatility Filter Before entering any trade, the script checks the CBOE:VIX.
Filter: If VIX is above the threshold (default 32), new entries are blocked.
Panic Exit: If you are in a position and the VIX spikes above the threshold, the strategy executes an immediate "Panic Exit" to preserve capital during market crashes.
3. The "Ratchet" Exit System (3 Stages) Unlike a standard trailing stop, this strategy uses a 3-stage dynamic exit mechanism that tightens as profits grow:
Stage 0 (Initial Risk): Standard percentage-based Stop Loss from the entry price.
Stage 1 (The Lock-In): Triggered when profit hits 10% (configurable).
Unique Logic: Instead of trailing from the highest high, the stop is calculated based on the price at the exact moment this stage was triggered. It "steps up" once and holds, securing the initial move without being prematurely stopped out by normal volatility.
Stage 2 (Trailing Mode): Triggered when profit hits 15% (configurable).
The strategy switches to a classic Trailing Stop, following the percentage distance from the Highest High.
4. Emergency Backup A "Dead Cross" (SMA 25 crossing under SMA 50) acts as a final fail-safe to close positions if the trend reverses completely before hitting a stop.
Settings & Inputs
SMAs: Customize the lengths for all four moving averages.
VIX Filter: Toggle the filter on/off and set the panic threshold.
Exit Logic: Fully customizable percentages for Initial SL, Stage 1 Trigger/Distance, and Stage 2 Trigger/Trailing Distance.
Disclaimer This script is for educational purposes only. Past performance is not indicative of future results. Always manage your risk appropriately.

Ratchet Exit Trend Strategy with VIX FilterThis strategy is a trend-following system designed specifically for volatile markets. Instead of focusing solely on the "perfect entry," this script emphasizes intelligent trade management using a custom **"Ratchet Exit System."**
Additionally, it integrates a volatility filter based on the CBOE Volatility Index (VIX) to minimize risk during extreme market phases.
### 🎯 The Concept: Ratchet Exit
The "Ratchet" system operates like a mechanical ratchet tool: the Stop Loss can only move in one direction (up, for long trades) and "locks" into specific stages. The goal is to give the trade "room to breathe" initially to avoid being stopped out by noise, then aggressively reduce risk as the trade moves into profit.
The exit logic moves through 3 distinct phases:
1. **Phase 0 (Initial Risk):** At the start of the trade, a wide Stop Loss is set (Default: 10%) to tolerate normal market volatility.
2. **Phase 1 (Risk Reduction):** Once the trade reaches a specific floating profit (Default: +10%), the Stop Loss is raised and "pinned" to a fixed value (Default: -8% from entry). This drastically reduces risk while keeping the trade alive.
3. **Phase 2 (Trailing Mode):** If the trend extends to a higher profit zone (Default: +15%), the Stop switches to a dynamic Trailing Mode. It follows the **Highest High** at a fixed percentage distance (Default: 8%).
### 🛡️ VIX Filter & Panic Exit
High volatility is often the enemy of trend-following strategies.
* **Entry Filter:** The system will not enter new positions if the VIX is above a user-defined threshold (Default: 32). This helps avoid entering "falling knife" markets.
* **Panic Exit:** If the VIX spikes above the threshold (32) while a trade is open, the position is closed immediately to protect capital (Emergency Exit).
### 📈 Entry Signals
The strategy trades **LONG only** and uses Simple Moving Averages (SMAs) to identify trends:
* **Golden Cross:** SMA 25 crosses over SMA 50.
* **3-Bar Breakouts:** A confirmation logic where the price must close above the SMA 50, 100, or 200 for 3 consecutive bars.
### ⚙️ Settings (Inputs)
All parameters are fully customizable via the settings menu:
* **SMAs:** Lengths for the trend indicators (Default: 25, 50, 100, 200).
* **VIX Filter:** Toggle the filter on/off and adjust the panic threshold.
* **Ratchet Settings:** Percentages for Initial Stop, Trigger Levels for Stages 1 & 2, and the Trailing Distance.
### ⚠️ Technical Note & Risk Warning
This script uses `request.security` to fetch VIX data. Please ensure you understand the risks associated with trading leveraged or volatile assets. Past performance is not indicative of future results.

Multi-Mode Grid StrategyGrid Strategy (SIMPLE)
█ Overview
This script is a system trading tool designed to generate cash flow from market volatility without relying on short-term directional predictions. It operates on the principle of Grid Trading , creating a mesh of buy and sell orders within a user-defined price range.
The strategy automates the process of "buying the dip" and "selling the bounce" repeatedly. It is most effective in sideways markets or during accumulation phases where the price oscillates within a specific channel.
█ TRADING MINDSET & SETUP GUIDE
To use this tool effectively, you must shift your perspective from "Sniper" (trying to hit the perfect entry) to "Manager" (managing a zone). Here is the required mindset for setting up this strategy:
Shift from Prediction to Range Definition
Don't ask: "Will the price go up or down tomorrow?"
Ask instead: "What is the price range the asset is unlikely to break out of in the coming weeks?"
Your primary job is to define the Grid Top Price (Ceiling) and Grid Bottom Price (Floor). As long as the price stays within this "Arena," the strategy will continue to execute trades.
Embrace Volatility as Fuel
For a trend follower, chop/sideways action is a nightmare. For a Grid Trader, it is fuel. Every time the price crosses a grid line down, it builds inventory. Every time it crosses back up, it realizes profit. You want the price to wiggle as much as possible within your defined boundaries.
Capital Allocation & Survivability
The biggest risk in grid trading is the price crashing below your Grid Bottom Price .
Mindset Check: Before launching, assume the price WILL drop to your bottom price immediately. Can your account handle that drawdown?
The script includes leverage and capital percentage inputs to help you size your position correctly. Never allocate 100% of your capital to a tight range without understanding the liquidation risk.
█ HOW IT WORKS
Grid Construction:
The script divides the space between your Upper Border and Lower Border into specific levels based on the Grid Quantity .
- Arithmetic: Equal spacing between lines (Standard).
- Geometric: Spacing based on mathematical ratios (useful for wider ranges).
Execution Logic:
- Entry: When price crosses below a grid line, a Long position is opened.
- Exit: When price bounces back up by a specific number of grid levels (defined by "Distance of TP"), the specific position is closed for a profit.
Time & Backtesting:
You can set specific Start and End Times . This allows you to backtest how the grid would have performed during specific historical volatility events before deploying it on live markets.
█ VISUALIZATION DASHBOARD
To keep you informed without cluttering the chart, the script features an information table at the bottom right:
Cash Out: Total realized profit booked into the account.
Open Position: How many grid levels are currently active (holding bags) vs. total levels.
Open Trade: The current floating P/L of held positions (Unrealized).
Max Drawdown: The deepest drawdown the strategy experienced during the test period.
RISK DISCLAIMER
Grid trading involves significant risk, particularly in strong trending markets that break out of your range against your position. This strategy does not use a stop-loss per trade; it relies on the user defining a safe "Bottom Price" and allocating capital accordingly. Past performance in backtesting does not guarantee future results. This script is a tool for execution and analysis, not financial advice.
