Mutanabby_AI | ATR+ | Trend-Following StrategyThis document presents the Mutanabby_AI | ATR+ Pine Script strategy, a systematic approach designed for trend identification and risk-managed position entry in financial markets. The strategy is engineered for long-only positions and integrates volatility-adjusted components to enhance signal robustness and trade management.
Strategic Design and Methodological Basis
The Mutanabby_AI | ATR+ strategy is constructed upon a foundation of established technical analysis principles, with a focus on objective signal generation and realistic trade execution.
Heikin Ashi for Trend Filtering: The core price data is processed via Heikin Ashi (HA) methodology to mitigate transient market noise and accentuate underlying trend direction. The script offers three distinct HA calculation modes, allowing for comparative analysis and validation:
Manual Calculation: Provides a transparent and deterministic computation of HA values.
ticker.heikinashi(): Utilizes TradingView's built-in function, employing confirmed historical bars to prevent repainting artifacts.
Regular Candles: Allows for direct comparison with standard OHLC price action.
This multi-methodological approach to trend smoothing is critical for robust signal generation.
Adaptive ATR Trailing Stop: A key component is the Average True Range (ATR)-based trailing stop. ATR serves as a dynamic measure of market volatility. The strategy incorporates user-defined parameters (
Key Value and ATR Period) to calibrate the sensitivity of this trailing stop, enabling adaptation to varying market volatility regimes. This mechanism is designed to provide a dynamic exit point, preserving capital and locking in gains as a trend progresses.
EMA Crossover for Signal Generation: Entry and exit signals are derived from the interaction between the Heikin Ashi derived price source and an Exponential Moving Average (EMA). A crossover event between these two components is utilized to objectively identify shifts in momentum, signaling potential long entry or exit points.
Rigorous Stop Loss Implementation: A critical feature for risk mitigation, the strategy includes an optional stop loss. This stop loss can be configured as a percentage or fixed point deviation from the entry price. Importantly, stop loss execution is based on real market prices, not the synthetic Heikin Ashi values. This design choice ensures that risk management is grounded in actual market liquidity and price levels, providing a more accurate representation of potential drawdowns during backtesting and live operation.
Backtesting Protocol: The strategy is configured for realistic backtesting, employing fill_orders_on_standard_ohlc=true to simulate order execution at standard OHLC prices. A configurable Date Filter is included to define specific historical periods for performance evaluation.
Data Visualization and Metrics: The script provides on-chart visual overlays for buy/sell signals, the ATR trailing stop, and the stop loss level. An integrated information table displays real-time strategy parameters, current position status, trend direction, and key price levels, facilitating immediate quantitative assessment.
Applicability
The Mutanabby_AI | ATR+ strategy is particularly suited for:
Cryptocurrency Markets: The inherent volatility of assets such as #Bitcoin and #Ethereum makes the ATR-based trailing stop a relevant tool for dynamic risk management.
Systematic Trend Following: Individuals employing systematic methodologies for trend capture will find the objective signal generation and rule-based execution aligned with their approach.
Pine Script Developers and Quants: The transparent code structure and emphasis on realistic backtesting provide a valuable framework for further analysis, modification, and integration into broader quantitative models.
Automated Trading Systems: The clear, deterministic entry and exit conditions facilitate integration into automated trading environments.
Implementation and Evaluation
To evaluate the Mutanabby_AI | ATR+ strategy, apply the script to your chosen chart on TradingView. Adjust the input parameters (Key Value, ATR Period, Heikin Ashi Method, Stop Loss Settings) to observe performance across various asset classes and timeframes. Comprehensive backtesting is recommended to assess the strategy's historical performance characteristics, including profitability, drawdown, and risk-adjusted returns.
I'd love to hear your thoughts, feedback, and any optimizations you discover! Drop a comment below, give it a like if you find it useful, and share your results.
Volatility

The Barking Rat LiteMomentum & FVG Reversion Strategy
The Barking Rat Lite is a disciplined, short-term mean-reversion strategy that combines RSI momentum filtering, EMA bands, and Fair Value Gap (FVG) detection to identify short-term reversal points. Designed for practical use on volatile markets, it focuses on precise entries and ATR-based take profit management to balance opportunity and risk.
Core Concept
This strategy seeks potential reversals when short-term price action shows exhaustion outside an EMA band, confirmed by momentum and FVG signals:
EMA Bands:
Parameters used: A 20-period EMA (fast) and 100-period EMA (slow).
Why chosen:
- The 20 EMA is sensitive to short-term moves and reflects immediate momentum.
- The 100 EMA provides a slower, structural anchor.
When price trades outside both bands, it often signals overextension relative to both short-term and medium-term trends.
Application in strategy:
- Long entries are only considered when price dips below both EMAs, identifying potential undervaluation.
- Short entries are only considered when price rises above both EMAs, identifying potential overvaluation.
This dual-band filter avoids counter-trend signals that would occur if only a single EMA was used, making entries more selective..
Fair Value Gap Detection (FVG):
Parameters used: The script checks for dislocations using a 12-bar lookback (i.e. comparing current highs/lows with values 12 candles back).
Why chosen:
- A 12-bar displacement highlights significant inefficiencies in price structure while filtering out micro-gaps that appear every few bars in high-volatility markets.
- By aligning FVG signals with candle direction (bullish = close > open, bearish = close < open), the strategy avoids random gaps and instead targets ones that suggest exhaustion.
Application in strategy:
- Bullish FVGs form when earlier lows sit above current highs, hinting at downward over-extension.
- Bearish FVGs form when earlier highs sit below current lows, hinting at upward over-extension.
This gives the strategy a structural filter beyond simple oscillators, ensuring signals have price-dislocation context.
RSI Momentum Filter:
Parameters used: 14-period RSI with thresholds of 80 (overbought) and 20 (oversold).
Why chosen:
- RSI(14) is a widely recognized momentum measure that balances responsiveness with stability.
- The thresholds are intentionally extreme (80/20 vs. the more common 70/30), so the strategy only engages at genuine exhaustion points rather than frequent minor corrections.
Application in strategy:
- Longs trigger when RSI < 20, suggesting oversold exhaustion.
- Shorts trigger when RSI > 80, suggesting overbought exhaustion.
This ensures entries are not just technically valid but also backed by momentum extremes, raising conviction.
ATR-Based Take Profit:
Parameters used: 14-period ATR, with a default multiplier of 4.
Why chosen:
- ATR(14) reflects the prevailing volatility environment without reacting too much to outliers.
- A multiplier of 4 is a pragmatic compromise: wide enough to let trades breathe in volatile conditions, but tight enough to enforce disciplined exits before mean reversion fades.
Application in strategy:
- At entry, a fixed target is set = Entry Price ± (ATR × 4).
- This target scales automatically with volatility: narrower in calm periods, wider in explosive markets.
By avoiding discretionary exits, the system maintains rule-based discipline.
Visual Signals on Chart
Blue “▲” below candle: Potential long entry
Orange/Yellow “▼” above candle: Potential short entry
Green “✔️”: Trade closed at ATR take profit
Blue (20 EMA) & Orange (100 EMA) lines: Dynamic channel reference
⚙️Strategy report properties
Position size: 25% equity per trade
Initial capital: 10,000.00 USDT
Pyramiding: 10 entries per direction
Slippage: 2 ticks
Commission: 0.055% per side
Backtest timeframe: 1-minute
Backtest instrument: HYPEUSDT
Backtesting range: Jul 28, 2025 — Aug 17, 2025
Note on Sample Size:
You’ll notice the report displays fewer than the ideal 100 trades in the strategy report above. This is intentional. The goal of the script is to isolate high-quality, short-term reversal opportunities while filtering out low-conviction setups. This means that the Barking Rat Lite strategy is very selective, filtering out over 90% of market noise. The brief timeframe shown in the strategy report here illustrates its filtering logic over a short window — not its full capabilities. As a result, even on lower timeframes like the 1-minute chart, signals are deliberately sparse — each one must pass all criteria before triggering.
For a larger dataset:
Once the strategy is applied to your chart, users are encouraged to expand the lookback range or apply the strategy to other volatile pairs to view a full sample.
💡Why 25% Equity Per Trade?
While it's always best to size positions based on personal risk tolerance, we defaulted to 25% equity per trade in the backtesting data — and here’s why:
Backtests using this sizing show manageable drawdowns even under volatile periods.
The strategy generates a sizeable number of trades, reducing reliance on a single outcome.
Combined with conservative filters, the 25% setting offers a balance between aggression and control.
Users are strongly encouraged to customize this to suit their risk profile.
What makes Barking Rat Lite valuable
Combines multiple layers of confirmation: EMA bands + FVG + RSI
Adaptive to volatility: ATR-based exits scale with market conditions
Clear, actionable visuals: Easy to monitor and manage trades

Opening Range Breakout🚀 ORB – Optimized for Peak Performance 🚀
Catch the morning breakout moves with zero guesswork!
This plug-and-play Opening Range Breakout strategy is fully optimized ; no settings to tweak, no parameters to adjust.
✅ Pre-tuned for U.S. market open on 5-minute charts.
✅ Built-in risk management with stop loss, take profit, and one trade per day.
✅ Auto exit before market close to lock in gains and avoid late-day whipsaws.
Perfect for day traders who want to focus on execution, not experimentation.
Just load it, trade it, and let the strategy do the heavy lifting.
⚠ Disclaimer : Educational use only. Always backtest and paper trade before using with real capital.
Key Features
• No Guesswork – Pre-set with the best-performing configuration.
• Opening Range Breakout Logic – Identifies the early range of the market and trades strong breakouts.
• Strict Risk Management – Stop loss and take profit levels are automatically calculated from the range size.
• One Trade Per Day – Prevents overtrading and keeps the focus on quality setups.
• End-of-Day Auto Exit – Closes all open trades at 3:30 PM EST to avoid late-session volatility.
How It Works
1. Opening Range Calculation: At market open (9:30 AM EST), the strategy monitors opening range.
2. Breakout Entry: Monitors the breakouts with moment.
3. Risk & Profit Targets: Stop loss and take profit are calculated automatically based on the range size. Risk-to-reward ratio is set for balanced performance.
4. Trade Control: Only one trade per day (either long or short). All trades are force-closed at 3:30 PM EST.

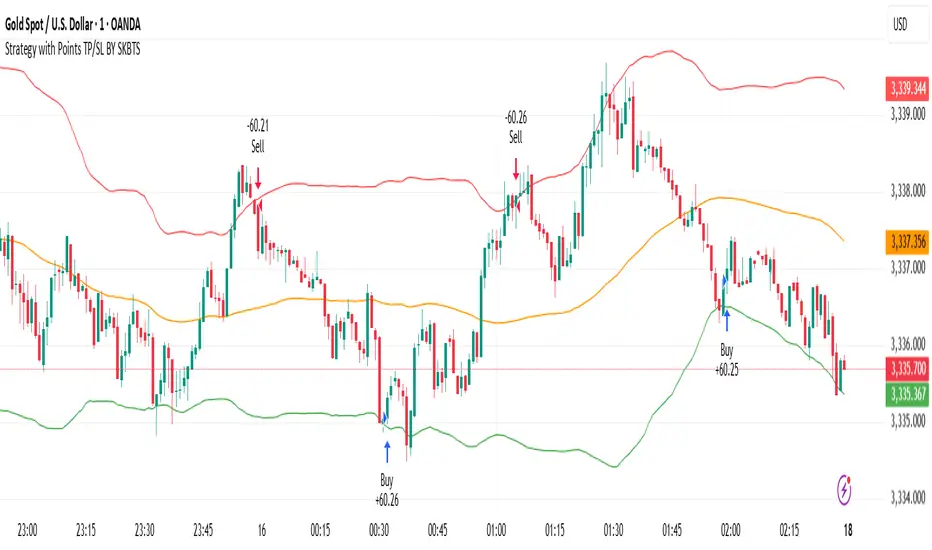
STRATEGY WITH POINT TP/SL BY SKBTSThe formula for the standard middle band is simply a moving average, often set to 20 periods:
Middle Band = 20-period moving average (close)
The upper and lower bands are calculated from the standard deviation, which measures how dispersed the price data is from the average.
Upper Band = Middle Band + (2 standard deviations of 20-period close)
Lower Band = Middle Band - (2 standard deviations of 20-period close)
The key inputs are the 20-period moving average, the number of standard deviations (typically 2), and the 20-period standard deviation. The bands will expand and contract based on the standard deviation value.
Some traders increase the standard deviation multiplier to 2.1 or 2.2 to make the bands looser and more sensitive. Decreasing the number of periods for the moving average and standard deviation will also increase sensitivity.
Ultimate Bot v5 (Full Visual + Reversal + Sustained Signals)Ultimate Bot v5 is a powerful, all-in-one Pine Script strategy designed for traders who want both clarity and precision in their charts. It combines classic momentum indicators, volatility filters, and reversal logic to highlight high-probability trade opportunities.
🔹 Key Features
Full Visual Mode – Clean and easy-to-read buy/sell markers with large arrows and labels.
EMA Trend Detection – Fast & slow EMA crossovers for trend direction.
RSI + MACD Confirmation – Confirms entries with momentum & strength checks.
Reversal Alerts – Detects sharp drops or spikes for rebound/reversal plays.
Sustained Signal Mode – Highlights stronger continuation trends, not just short-term flips.
ADX Strength Filter (optional) – Filters out weak/noisy signals during sideways markets.
ATR Dynamic Positioning – Arrows adapt to volatility so they’re always visible.
Custom Alerts – Works with TradingView alerts for buy, sell, and reversal signals.
🔹 Why Use It?
This bot is designed to help traders:
✅ Spot early reversals and potential bounce opportunities
✅ Confirm strong momentum moves with multi-indicator checks
✅ Avoid false signals in choppy markets
✅ Trade with confidence using visual clarity

EMA Crossover Entry + ATR ExitOverview
A robust trend-following strategy that combines multiple Exponential Moving Averages (EMAs) for precise entry signals with smoothed Average True Range (ATR) for dynamic, volatility-based exits. Designed for traders who want to capture strong trending long-term moves while protecting profits with intelligent stop-loss management.
Strategy Logic
Entry Signal:
- Enters LONG when price closes above EMA 20, AND
- EMA 20 > EMA 50 > EMA 100 > EMA 200 (Perfect bull alignment)
Ensures entry only during confirmed uptrends with all EMAs properly stacked
Exit Signal:
- Uses smoothed ATR.
- Creates dynamic trailing stop that adjusts to market volatility
- Exits when price closes below ATR.
Check volume in addition to this, to boost confidence for your entry.
This works well for Long Term Investment.
Use Daily or Weekly timeframe.
Key Features
✅ Trend Confirmation: Four-EMA stack ensures strong trend alignment before entry
✅ Volatility-Adaptive Exits: ATR smoothing prevents whipsaw exits in choppy markets
Perfect for traders seeking systematic trend-following with professional risk management. Combines the reliability of multiple timeframe trend confirmation with the precision of volatility-based exits.
Happy Investing!
:)
Feel free to provide feedback; I would love to hear from you.
Note:
Strategy executes on bar close to prevent repainting.
Past performance does not guarantee future results.
Use proper risk management.

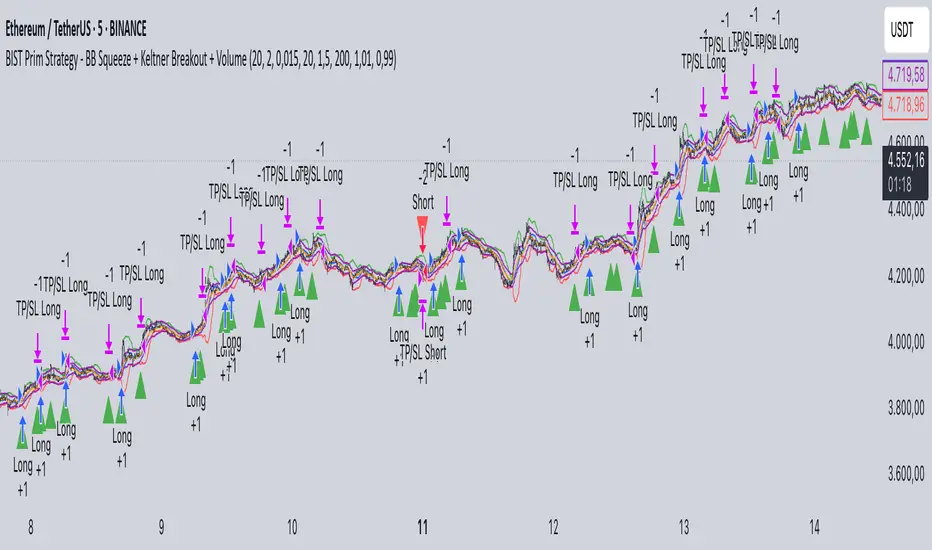
BB Squeeze + Keltner Breakout + VolumeHow the Strategy Works
Bollinger Bands Squeeze: The strategy first looks for a "squeeze" in the Bollinger Bands. This happens when the bands narrow significantly, indicating a period of low market volatility and potential consolidation. The bbSqueeze variable becomes true when the Bollinger Bandwidth falls below a set
Market Open Impulse [LuciTech]Market Open Impulse Strategy
The Market Open Impulse Strategy is designed to capture significant price movements that occur at market open (2:30 PM UK time). This strategy identifies impulsive candles with high volatility and enters trades based on the direction and strength of the initial market reaction.
How It Works:
The strategy activates exclusively at 2:30 PM UK time during market open sessions. It uses ATR-based volatility filtering to identify impulsive candles that exceed a configurable multiplier (default 1.5x ATR). Long entries are triggered when an impulsive candle closes above its midpoint and above the opening price, while short entries occur when an impulsive candle closes below its midpoint and below the opening price.
Risk management is handled through precise stop loss placement at the opposite extreme of the impulse candle (high for short positions, low for long positions). Take profit levels are calculated using a configurable risk-reward ratio with a default setting of 3:1. Position sizing is automatically calculated based on the percentage risk per trade, and an optional breakeven feature can move the stop loss to the entry price at specified profit levels.
The strategy incorporates time-based filtering to ensure trades only occur during the specified market open window. Visual indicators highlight qualifying impulsive candles and plot all entry and exit levels for clear trade management. The system offers flexible risk management with customizable risk percentage, risk-reward ratios, and breakeven settings, along with multiple stop loss calculation methods including both ATR-based and candle-based options.
Key Parameters:
Market open timing is fully configurable through hour and minute settings for strategy activation. The impulse ATR multiple sets the minimum volatility threshold required for trade qualification, with visual highlighting available for qualifying setups. Risk management parameters include the percentage of account equity to risk per trade, target profit multiples relative to initial risk, and the profit level threshold for breakeven stop loss adjustment. Users can choose between ATR-based or candle-based stop loss calculation methods and adjust technical parameters for volatility calculation including ATR length and smoothing methods.
Applications:
This strategy is particularly effective for trading market open volatility and momentum, capturing institutional order flow during key timing windows, executing short-term swing trades on significant price impulses, and trading markets with predictable opening patterns and consistent volatility characteristics.

SMC Breaker+Liquidity + HTF EMA — v61️⃣ Core Idea
This is a Smart Money Concept (SMC)
It looks for liquidity sweeps followed by price moving back in the opposite direction (breaker block behavior), while trading only in the direction of the higher timeframe (HTF) trend.
2️⃣ Components
A. Higher Timeframe EMA Bias
We take an EMA (default length: 50) from a higher timeframe (default: 4H).
If price is above that EMA → bias is bullish (we only take longs).
If price is below that EMA → bias is bearish (we only take shorts).
This keeps trades aligned with the bigger picture trend
B. Liquidity Sweep Detection
We find the highest high and lowest low over the past 5 bars
A sweep high happens when:
Price breaks above a recent high (liquidity grab), but
Closes back below it (false breakout).
A sweep low happens when:
Price breaks below a recent low, but
Closes back above it.
This indicates stop hunting — whales often trigger these before reversing price.
C. Breaker Block Logic
If a sweep low occurs and bias is bullish → BUY.
If a sweep high occurs and bias is bearish → SELL.
D. Optional ADX Filter
ADX checks market strength (trendiness).
If enabled, it only trades when ADX > threshold (default 20).
This avoids ranging/choppy markets.
3️⃣ Risk Management
Stop Loss (SL):
For longs → ATR(14) below the entry candle low.
For shorts → ATR(14) above the entry candle high.
Take Profit (TP):
SL distance × Risk:Reward ratio (default 3:1).
This means every win can be 3x bigger than a loss.

Energy Advanced Policy StrategyThis trading strategy emphasizes both technical trading as well as sentiment trading. Using news and government policy decisions, it can determine either positive or negative sentiment in the energy sector.
How the Strategy Works
This strategy has two main parts that work together to find good trades:
1. The "Policy & Sentiment Engine "
Policy Event Detection : The script spots potential big news or policy changes by looking for big, sudden price moves and huge trading volume. You can play with the Policy Event Volume Threshold and Policy Event Price Threshold (%) settings to make it more or less sensitive.
Sentiment Score : When the script finds a positive or negative event, it adds to a sentiment score. This score isn't forever, though; it fades over time, so the newest events matter the most.
Manual Override : The Manual News Sentiment setting lets you tell the script exactly what the market's mood is for a set time, which is perfect for when you already know about a big upcoming announcement.
The strategy only looks for a trade if the overall feeling is bullish enough. This makes sure you're trading with the big, fundamental forces of the market, not against them.
2. Technical Confirmation & Precision
After the policy and sentiment part gives a green light, the strategy uses a variety of technical indicators to confirm the trend and ideal entry positions.
Long-Term Trend : The script makes sure the market is in a strong uptrend by checking if the fast and medium-speed moving averages are going up, and if the price is above a long-term moving average.
Momentum : The MACD is used to make sure the price's upward momentum is getting stronger, not weaker.
Oscillator : It also uses the RSI to check if the market has gone up too much, too fast, which could mean it's about to turn around.
How to Use the Script
You can customize this strategy to fit your trading style and how much risk you're comfortable with. The inputs are grouped into logical sections for easy adjustment.
News & Policy Analysis : You can play with the Policy Event thresholds to make the script more or less sensitive to market shocks. And you can always use the Manual News Sentiment to take over when you're watching a specific news event.
Technical Analysis : Feel free to change the settings for things like the moving averages, RSI, and MACD to match what you like to trade and on what timeframe.

MACD Alt Peaks & Valleys + SL + BB V6MACD Alt Peaks & Valleys + SL + BB
This strategy uses a custom MACD peak and valley confirmation system to identify high-probability trade signals. It dynamically manages entries, stop losses, and exits with the help of Bollinger Bands to adapt to changing market volatility.
Strategy Designer
**Strategy Designer**
This script is a highly modular, multi-indicator strategy framework that allows users to enable or disable a wide range of signals for precision trading control. Key components include:
* **AlphaTrend**: A dynamic trailing filter built using ATR volatility combined with directional input from RSI or MFI. It helps define bullish or bearish regimes more responsively than fixed moving averages.
* **Inverse Fisher Transformed Indicators**: The script normalizes and transforms traditional oscillators (CCI, RSI, Stochastic, MFI) using the inverse Fisher transform. This boosts signal clarity by compressing values between -1 and +1, making crossovers and trend thresholds more defined.
* **Composite Indicators**: RSI + MFI and CCI + Stoch are averaged to produce smoother, noise-reduced momentum signals. These are ideal for filtering or confirming entries across multiple timeframes or asset types.
* **Volatility & Trend Filters**:
* **ATR Trend Filter**: Confirms trades only when short-term ATR exceeds its smoothed average, indicating rising volatility or breakout conditions.
* **ADX Filter**: Includes two types of filters—ADX vs its MA and ADX vs threshold—to ensure trade entries only happen during clear trend strength.
* **Moving Averages**: Multiple MA types (SMA, EMA, HMA, WMA, DEMA, TEMA, T3, VWMA) are available for crossover and trend conditions. The structure supports general trend, long-trend, and short-trend configurations independently.
* **Volume Filter**: An optional condition to confirm that volume exceeds a moving average, helping avoid trades in low-liquidity periods.
---
**Exit Logic & Risk Management**
This strategy offers powerful and flexible exit controls to suit various risk profiles:
* **Fixed TP/SL**: You can activate classic percentage-based take profit and stop loss levels.
* **ATR-Based Floating Stop**: Dynamically calculates trailing stops based on recent volatility using a smoothed ATR, offering better adaptability in trending environments.
* **Signal-Based Exits**: Includes the ability to exit trades when the original entry conditions reverse (e.g. AlphaTrend flips, Fisher crosses back, MA cross reverses, etc.).
* **Modular Exit Triggers**: Each indicator (CCI, RSI, MFI, Stoch, AlphaTrend, Composite Indicators) can independently trigger an exit based on reversal signals or loss of trend strength.
* **Multi-Layered Protection**: Combine multiple exits (e.g. ATR + AlphaTrend + RSI reversal) to minimize drawdowns and prevent false breakouts.
---
This tool is designed for advanced traders and strategy developers who want granular control over both entries and exits. Every module is toggleable, allowing for endless backtest scenarios and tailored setups to match different market conditions or asset classes. Whether you're trend-following or counter-trading reversals, this strategy adapts.

Reversed Large Bars Strategy with Williams %RThis strategy script is ideal for volatile assets such as Natural Gas (NATGAS) or Crude Oil (WTI/Brent), which often exhibit strong price movements with high volume.
How It Works:
The strategy identifies short-term reversals after two consecutive large candles with significant volume, under specific conditions. It is based on the assumption that after strong directional moves, a temporary price exhaustion or reversal may occur.
Logic Breakdown:
Large Bar Detection:
A bar is considered “large” if its range (high – low) is significantly higher than the average (by a configurable percentage) and is accompanied by a spike in volume.
Two Consecutive Large Bars:
Entry is only considered when two large bars appear back-to-back — this strengthens the momentum signal.
Candle Type Filter:
For short entries: Two consecutive large bullish bars followed by a bullish candle → implies overextension upwards.
For long entries: Two consecutive large bearish bars followed by a bearish candle → implies overextension downwards.
Williams %R Filter:
The Williams %R oscillator adds confirmation based on overbought/oversold conditions:
Longs are allowed when %R is below the oversold level.
Shorts are allowed when %R is above the overbought level.
Ratio Logic:
A running percentage of bullish vs bearish large bars is tracked over a rolling period. This ensures entries are filtered based on broader context and trend dominance.
Stop Loss / Take Profit / Breakeven:
Each trade includes configurable SL/TP, and optional breakeven logic:
If unrealized profit exceeds a set percentage, SL is moved to entry (optionally with a buffer).

VWAP-RSI Scalper FINAL v1Description
This script implements a robust, battle-tested intraday scalping strategy designed for prop firm challenges, funded trader programs, and serious futures scalpers.
It combines VWAP, RSI, EMA trend, and ATR-based risk management to capture high-probability mean reversion and momentum moves during the most liquid hours of the trading day.
Core Logic
RSI (Relative Strength Index):
Trades are triggered when the RSI is either oversold or overbought using a short lookback (default: 3). This ensures only the strongest intraday reversals or exhaustion moves are considered.
VWAP Filter:
Longs are only taken above VWAP, shorts only below VWAP, aligning trades with the session’s dominant bias.
EMA Filter:
Additional trend quality filter—longs require price above EMA, shorts below EMA.
Session Control:
Only trades between user-defined session hours (default: US cash session), eliminating overnight/illiquid action.
ATR-based Dynamic Stops & Targets:
Every trade uses a stop loss at 1x ATR and a take profit at 2x ATR for a positive risk/reward ratio.
Max Trades Per Day:
Prevents overtrading and controls risk exposure (default: 3).
Performance (Sample Backtest)
Profit Factor: 1.37+ (prop-firm quality)
Drawdown: <1% (very conservative risk)
Win Rate: 37–48% (RR > 1, so high edge)
Consistency: Smooth, steady equity curve over hundreds of trades.
Best For:
ES/NQ/CL/GC intraday traders
Prop firm evaluation challenges (Tradeify, Topstep, Apex, etc.)
Anyone needing robust, no-nonsense systematic edge for futures or indices.
How to Use & Tune
Apply to 3min, 5min, or 15min charts of liquid futures or indices.
Change parameters in the settings panel to suit your asset, volatility, or session hours.
Use “Strategy Tester” to validate P&L, win rate, and drawdown.
How to Optimize
Raise/lower RSI length or bands to make signals more/less frequent.
Adjust stop/target multiples for your preferred risk/reward profile.
Change session hours to match your broker or market.
Disclaimer
This is not financial advice. Use on a demo or sim account first. Results will vary by market, slippage, and execution speed. Past performance does not guarantee future results.
If you find this useful, please give it a like, follow for more strategies, and comment your results or questions!
Good luck and safe trading!

AM Range Sniper [jmaxxx]AM Range Sniper
Overview
AM Range Sniper is a sophisticated morning session trading strategy designed for Micro E-mini Nasdaq-100 Index Futures (MNQ). This strategy capitalizes on the critical 8:30-9:30 AM EST range formation period, implementing precise entry and exit mechanics with advanced risk management.
Key Features
🕐 Time-Based Range Analysis
Range Definition: Automatically identifies and tracks the 8:30-9:30 AM EST range
Trading Window: Active trading from 9:30 AM to 11:00 AM EST (extended for second chance trades)
Session Management: Daily reset ensures clean state for each trading session
🎯 Multiple Entry Patterns
Breakthrough/Retest: Captures price breakthroughs above range with retest opportunities
Long/Short Opportunities: Comprehensive coverage of both directional moves
Breakdown: Identifies bearish breakdowns below range support
Break Up: Detects bullish breakups above range resistance
Range Sweeps: Monitors for range high/low sweeps with reversal entries
⚡ Advanced Risk Management
Configurable Stop Losses: Tick-based stop losses for each trade type
Take Profit Targets: Automatic target calculations based on range size
Hard Close Protection: Automatic position closure at 4 PM EST
Second Chance Feature: Optional second trade opportunity if first trade loses
🔧 Professional Features
Visual Stop Loss Lines: Real-time stop loss visualization on chart
Debug Information Panel: Comprehensive status monitoring
Alert Integration: Customizable alert messages for entries/exits
Flexible Time Settings: Adjustable for different timezones
Strategy Logic
Range Formation (8:30-9:30 AM)
The strategy monitors the first hour of trading to establish the day's range. This range serves as the foundation for all subsequent trading decisions.
Entry Conditions
Breakthrough: Price breaks above range high with retest rejection
Breakdown: Price breaks below range low with confirmed bearish momentum
Break Up: Price breaks above range high with strong bullish confirmation
Sweep Entries: Range high/low sweeps followed by reversal signals
Risk Management
Stop Loss: Configurable tick-based stops for each trade type
Take Profit: 1.5x range size targets for breakdown/breakup trades
Position Sizing: Percentage-based position sizing
Session Limits: Maximum 2 trades per session (with second chance feature)
Settings & Customization
Core Parameters
Enable/disable individual entry patterns
Configurable stop loss levels (1-500 ticks)
Second chance feature toggle
Previous day level integration
Visual Customization
Customizable stop loss colors and widths
Debug panel visibility
Range line styling
Alert Configuration
Custom entry/exit alert messages
***** Automate With *****
APEX
NinjaTrader
Crosstrade.io ( promo code JMAXXX )
Performance & Reliability
Precision Focused: Waits for high-probability setups
Risk-Aware: Comprehensive stop loss and position management
Session-Based: Clean daily resets prevent carryover issues
Professional Grade: Designed for serious traders
Ideal For
Day Traders: Morning session specialists
Futures Traders: MNQ and similar instruments
Range Traders: Traders who capitalize on range breakouts
Risk-Conscious Traders: Those who prioritize risk management
Disclaimer
This strategy is for educational and informational purposes. Past performance does not guarantee future results. Always test thoroughly on historical data and paper trading before live implementation. Risk management is crucial - never risk more than you can afford to lose.
Created by jmaxxx - Professional trading strategy developer
For questions, feedback, or customization requests, please leave a comment below.

Options Strategy V2.0📈 Options Strategy V2.0 – Intraday Reversal-Resilient Momentum System
Overview:
This strategy is designed specifically for intraday SPY, TSLA, MSFT, etc. options trading (0DTE or 1DTE), using high-probability signals derived from a confluence of technical indicators: EMA crossovers, RSI thresholds, ATR-based risk control, and volume spikes. The strategy aims to capture strong directional moves while avoiding overtrading, thanks to a built-in cooldown logic and optional time/session filters.
⚙️ Core Concept
The strategy executes trades only in the direction of the prevailing trend, determined by short- and long-term Exponential Moving Averages (EMA). Entry signals are generated when the Relative Strength Index (RSI) confirms momentum in the direction of the trend, and volume spikes suggest institutional activity.
To increase adaptability and user control, it includes a highly customizable parameter set for both long and short entries independently.
📌 Key Features
✅ Trend-Following Logic
Long entries are only allowed when EMA(short) > EMA(long)
Short entries are only allowed when EMA(short) < EMA(long)
✅ RSI Confirmation
Long: Requires RSI crossover above a configurable threshold
Short: Requires RSI crossunder below a configurable threshold
Optional rejection filters: Entry blocked above/below specific RSI extremes
✅ Volume Spike Filter
Confirms institutional participation by comparing current volume to an average multiplied by a user-defined factor.
✅ ATR-Based Risk Management
Both Stop Loss (SL) and Take Profit (TP) are dynamically calculated using ATR × a multiplier.
TP/SL ratio is fully configurable.
✅ Cooldown Control
After every trade, the system waits for a set number of bars before allowing new entries.
This prevents overtrading and increases signal quality.
Optionally, cooldown is ignored for reversal trades, ensuring the system can react immediately to a confirmed trend change.
✅ Candle Body Filter (Noise Control)
Avoids trades on candles with too small bodies relative to wicks (often noise or indecision candles).
✅ VWAP Confirmation (Optional)
Ensures price is trading above VWAP for long entries, or below for short entries.
✅ Time & Session Filters
Trades only during regular market hours (09:30–16:00 EST).
No-trade zone (e.g., 14:15–15:45 EST) to avoid low-liquidity traps or late-day whipsaws.
✅ End-of-Day Auto Close
All open positions are force-closed at 15:55 EST, protecting against overnight risk (especially relevant for 0DTE options).
📊 Visual Aids
EMA plots show trend direction
VWAP line provides real-time mean-reversion context
Stop Loss and Take Profit lines appear dynamically with each trade
Alerts notify of entry signals and exit triggers
🔧 Customization Panel
Nearly every element of the strategy can be tailored:
EMA lengths (short and long, for both sides)
RSI thresholds and length
ATR length, SL multiplier, and TP/SL ratio
Volume spike sensitivity
Minimum EMA distance filter
Candle body ratio filter
Session restrictions
Cooldown logic (duration + reversal exception)
This makes the strategy extremely versatile, allowing both conservative and aggressive configurations depending on the trader’s profile and the market context.
📌 Example Use Case: SPY Options (0DTE or 1DTE)
This system was designed and tested specifically for SPY and other intraday options trading, where:
Delta is around 0.50 or higher
Trades are short-lived (often 1–5 candles)
You aim to trade 1–3 signals per day, filtering out weak entries
🚫 Important Notes
It is not a scalping strategy; it relies on confirmed breakouts with trend support
No pyramiding or re-entries without cooldown to preserve risk integrity
Should be used with real-time alerts and manual broker execution
📈 Alerts Included
📈 Long Entry Signal
📉 Short Entry Signal
⚠️ Auto-closed all positions at 15:55 EST
✅ Proven Settings – Real Trades + Backtest Results
The current version of the strategy includes the optimal settings I’ve arrived at through extensive backtesting, as well as 3 months of real trading with consistent profitability. These results reflect real-world execution under live market conditions using 0DTE SPY options, with disciplined trade management and risk control.
🧠 Final Thoughts
Options Strategy V2.0 is a robust, highly tunable intraday strategy that blends momentum, trend-following, and volume confirmation. It is ideal for disciplined traders focused on SPY or other 0DTE/1DTE options, and it includes guardrails to reduce false signals and improve execution timing.
Perfect for those who seek precision, flexibility, and risk-defined setups—not blind automation.

Dynamic DCA Envelope – Beta V1.1Dynamic DCA Envelope-Beta V1.1 is a preview version of a Dollar-Cost Averaging (DCA) strategy designed for trending or volatile markets.
-Long Positions Only
-Intended for Cryptocurrency, but can be used in any market
-1 and 4 hour timeframe
-Average Commissions 0.1%-0.3% per trade (Cryptocurrency)
What it does:
This strategy identifies buying opportunities when price closes below a dynamic envelope (based on EMA). After 3 consecutive closes below the lower envelope, the system arms a buy condition. A DCA buy-in is triggered when price bounces by a configurable percentage from the trailing low. The strategy supports up to 3 buy-ins, each equally sized, and closes the entire position at a fixed take profit or stop loss.
How it works:
-Entry logic is based on price deviation from an EMA envelope
-Waits for 3 closes below the envelope to detect weakness
-Uses bounce percentage from the lowest point to trigger each buy
-Includes cooldown logic between buys to avoid clustering
-All positions are closed when TP or SL is hit
How to use it:
-Use on trending assets with volatility (e.g., crypto, tech stocks)
-Adjust inputs to match asset behavior:
-EMA Length
-Envelope Offset %
-Bounce % (Trailing DCA)
-Take Profit / Stop Loss
-View strategy performance in the Strategy Tester tab
What’s unique:
Unlike most DCA scripts that immediately average down, this version includes:
-Trigger logic requiring multiple closes below trend
-Bounce-based entry to avoid catching a falling knife
-Cooldown resets to prevent overtrading
-A true entry–wait–buy–reset loop mimicking disciplined execution
*This is a beta version intended as a preview. A full Pro version is in development, which includes:
-SmartScaling logic
-Trailing take profit
-Multi-symbol scanning
-Backtest range limits
-Risk-adjusted filtering

SuperTrend Strategy with Trend-Based Exits🟩 SuperTrend Strategy with Trend-Based Exits
This is a fully automated trend-following strategy based on the popular SuperTrend indicator, enhanced with a position sizing algorithm tied to stop-loss distance and dynamic entry/exit rules. The strategy is designed for futures trading with an emphasis on sustainable risk, realistic backtesting, and transparent logic.
🧠 Concept and Methodology
The strategy uses the SuperTrend indicator, which is derived from ATR (Average True Range) and is widely used to capture medium- to long-term market trends.
Key features:
✅ Entries are triggered only when the SuperTrend direction changes (trend reversal).
✅ Exits are performed using a dynamic stop-loss placed at the SuperTrend line.
✅ Position size is automatically calculated based on the trader’s fixed dollar risk per trade and the current distance to the stop-loss.
✅ Rounding logic is included to ensure quantity is valid for the exchange’s lot size.
This strategy does not use any take-profit or classic trailing stop — the position is only closed when the trend reverses or the stop is hit by touching the SuperTrend line.
⚙️ Default Parameters
ATR Length: 300
Factor: 7.5
Risk per trade: $90 (3% of the default $3,000 capital)
Lot step: 10
Commission: 0.05%
These default parameters are not universal. They were optimized specifically for STXUSDT swap at 15M timeframe at Bybit and may not produce viable results on other pairs and timeframes.
Users are encouraged to customize the settings according to specific asset’s volatility, timeframe and other characteristics.
❗ These default settings yield meaningful backtesting results on STXUSDT with a reasonable number of trades (105+) over 7-month period. If applied to other assets, results may vary significantly.
📈 Position Sizing Logic
The strategy uses a dynamic position sizing formula:
Pine Script®
position_size = floor((risk_per_trade / stop_loss_distance) / lot_step) * lot_step
This ensures the trader always risks a fixed dollar amount per trade and never exceeds a sustainable equity exposure (recommended 2% or less).
✅ Realism in Backtesting
To ensure realistic and non-misleading backtest results, this strategy includes:
— Slippage and commission settings matching average exchange conditions (commission = 0.05%, slippage 5 ticks).
— Position sizing based on stop-loss distance (not fixed contract quantity).*
— A fixed risk-per-trade model that adheres to responsible capital management principles.
— This is in compliance with TradingView's Script publishing rules and House Rules.
📌 How to Use
Apply the strategy to a clean chart (preferably 15M for STXUSDT by default).
If using another asset, adjust:
- ATR Length
- Factor
- Risk per trade
- Qty step (lot precision for the symbol)
Avoid using with other indicators unless you understand their purpose.
Use the Strategy Tester to evaluate performance and optimize parameters.
⚠️ Disclaimer
This is not financial advice. Always perform forward testing and assess risk before deploying any strategy on live capital. The strategy is designed for educational and experimental use.

Game Theory Trading StrategyGame Theory Trading Strategy: Explanation and Working Logic
This Pine Script (version 5) code implements a trading strategy named "Game Theory Trading Strategy" in TradingView. Unlike the previous indicator, this is a full-fledged strategy with automated entry/exit rules, risk management, and backtesting capabilities. It uses Game Theory principles to analyze market behavior, focusing on herd behavior, institutional flows, liquidity traps, and Nash equilibrium to generate buy (long) and sell (short) signals. Below, I'll explain the strategy's purpose, working logic, key components, and usage tips in detail.
1. General Description
Purpose: The strategy identifies high-probability trading opportunities by combining Game Theory concepts (herd behavior, contrarian signals, Nash equilibrium) with technical analysis (RSI, volume, momentum). It aims to exploit market inefficiencies caused by retail herd behavior, institutional flows, and liquidity traps. The strategy is designed for automated trading with defined risk management (stop-loss/take-profit) and position sizing based on market conditions.
Key Features:
Herd Behavior Detection: Identifies retail panic buying/selling using RSI and volume spikes.
Liquidity Traps: Detects stop-loss hunting zones where price breaks recent highs/lows but reverses.
Institutional Flow Analysis: Tracks high-volume institutional activity via Accumulation/Distribution and volume spikes.
Nash Equilibrium: Uses statistical price bands to assess whether the market is in equilibrium or deviated (overbought/oversold).
Risk Management: Configurable stop-loss (SL) and take-profit (TP) percentages, dynamic position sizing based on Game Theory (minimax principle).
Visualization: Displays Nash bands, signals, background colors, and two tables (Game Theory status and backtest results).
Backtesting: Tracks performance metrics like win rate, profit factor, max drawdown, and Sharpe ratio.
Strategy Settings:
Initial capital: $10,000.
Pyramiding: Up to 3 positions.
Position size: 10% of equity (default_qty_value=10).
Configurable inputs for RSI, volume, liquidity, institutional flow, Nash equilibrium, and risk management.
Warning: This is a strategy, not just an indicator. It executes trades automatically in TradingView's Strategy Tester. Always backtest thoroughly and use proper risk management before live trading.
2. Working Logic (Step by Step)
The strategy processes each bar (candle) to generate signals, manage positions, and update performance metrics. Here's how it works:
a. Input Parameters
The inputs are grouped for clarity:
Herd Behavior (🐑):
RSI Period (14): For overbought/oversold detection.
Volume MA Period (20): To calculate average volume for spike detection.
Herd Threshold (2.0): Volume multiplier for detecting herd activity.
Liquidity Analysis (💧):
Liquidity Lookback (50): Bars to check for recent highs/lows.
Liquidity Sensitivity (1.5): Volume multiplier for trap detection.
Institutional Flow (🏦):
Institutional Volume Multiplier (2.5): For detecting large volume spikes.
Institutional MA Period (21): For Accumulation/Distribution smoothing.
Nash Equilibrium (⚖️):
Nash Period (100): For calculating price mean and standard deviation.
Nash Deviation (0.02): Multiplier for equilibrium bands.
Risk Management (🛡️):
Use Stop-Loss (true): Enables SL at 2% below/above entry price.
Use Take-Profit (true): Enables TP at 5% above/below entry price.
b. Herd Behavior Detection
RSI (14): Checks for extreme conditions:
Overbought: RSI > 70 (potential herd buying).
Oversold: RSI < 30 (potential herd selling).
Volume Spike: Volume > SMA(20) x 2.0 (herd_threshold).
Momentum: Price change over 10 bars (close - close ) compared to its SMA(20).
Herd Signals:
Herd Buying: RSI > 70 + volume spike + positive momentum = Retail buying frenzy (red background).
Herd Selling: RSI < 30 + volume spike + negative momentum = Retail selling panic (green background).
c. Liquidity Trap Detection
Recent Highs/Lows: Calculated over 50 bars (liquidity_lookback).
Psychological Levels: Nearest round numbers (e.g., $100, $110) as potential stop-loss zones.
Trap Conditions:
Up Trap: Price breaks recent high, closes below it, with a volume spike (volume > SMA x 1.5).
Down Trap: Price breaks recent low, closes above it, with a volume spike.
Visualization: Traps are marked with small red/green crosses above/below bars.
d. Institutional Flow Analysis
Volume Check: Volume > SMA(20) x 2.5 (inst_volume_mult) = Institutional activity.
Accumulation/Distribution (AD):
Formula: ((close - low) - (high - close)) / (high - low) * volume, cumulated over time.
Smoothed with SMA(21) (inst_ma_length).
Accumulation: AD > MA + high volume = Institutions buying.
Distribution: AD < MA + high volume = Institutions selling.
Smart Money Index: (close - open) / (high - low) * volume, smoothed with SMA(20). Positive = Smart money buying.
e. Nash Equilibrium
Calculation:
Price mean: SMA(100) (nash_period).
Standard deviation: stdev(100).
Upper Nash: Mean + StdDev x 0.02 (nash_deviation).
Lower Nash: Mean - StdDev x 0.02.
Conditions:
Near Equilibrium: Price between upper and lower Nash bands (stable market).
Above Nash: Price > upper band (overbought, sell potential).
Below Nash: Price < lower band (oversold, buy potential).
Visualization: Orange line (mean), red/green lines (upper/lower bands).
f. Game Theory Signals
The strategy generates three types of signals, combined into long/short triggers:
Contrarian Signals:
Buy: Herd selling + (accumulation or down trap) = Go against retail panic.
Sell: Herd buying + (distribution or up trap).
Momentum Signals:
Buy: Below Nash + positive smart money + no herd buying.
Sell: Above Nash + negative smart money + no herd selling.
Nash Reversion Signals:
Buy: Below Nash + rising close (close > close ) + volume > MA.
Sell: Above Nash + falling close + volume > MA.
Final Signals:
Long Signal: Contrarian buy OR momentum buy OR Nash reversion buy.
Short Signal: Contrarian sell OR momentum sell OR Nash reversion sell.
g. Position Management
Position Sizing (Minimax Principle):
Default: 1.0 (10% of equity).
In Nash equilibrium: Reduced to 0.5 (conservative).
During institutional volume: Increased to 1.5 (aggressive).
Entries:
Long: If long_signal is true and no existing long position (strategy.position_size <= 0).
Short: If short_signal is true and no existing short position (strategy.position_size >= 0).
Exits:
Stop-Loss: If use_sl=true, set at 2% below/above entry price.
Take-Profit: If use_tp=true, set at 5% above/below entry price.
Pyramiding: Up to 3 concurrent positions allowed.
h. Visualization
Nash Bands: Orange (mean), red (upper), green (lower).
Background Colors:
Herd buying: Red (90% transparency).
Herd selling: Green.
Institutional volume: Blue.
Signals:
Contrarian buy/sell: Green/red triangles below/above bars.
Liquidity traps: Red/green crosses above/below bars.
Tables:
Game Theory Table (Top-Right):
Herd Behavior: Buying frenzy, selling panic, or normal.
Institutional Flow: Accumulation, distribution, or neutral.
Nash Equilibrium: In equilibrium, above, or below.
Liquidity Status: Trap detected or safe.
Position Suggestion: Long (green), Short (red), or Wait (gray).
Backtest Table (Bottom-Right):
Total Trades: Number of closed trades.
Win Rate: Percentage of winning trades.
Net Profit/Loss: In USD, colored green/red.
Profit Factor: Gross profit / gross loss.
Max Drawdown: Peak-to-trough equity drop (%).
Win/Loss Trades: Number of winning/losing trades.
Risk/Reward Ratio: Simplified Sharpe ratio (returns / drawdown).
Avg Win/Loss Ratio: Average win per trade / average loss per trade.
Last Update: Current time.
i. Backtesting Metrics
Tracks:
Total trades, winning/losing trades.
Win rate (%).
Net profit ($).
Profit factor (gross profit / gross loss).
Max drawdown (%).
Simplified Sharpe ratio (returns / drawdown).
Average win/loss ratio.
Updates metrics on each closed trade.
Displays a label on the last bar with backtest period, total trades, win rate, and net profit.
j. Alerts
No explicit alertconditions defined, but you can add them for long_signal and short_signal (e.g., alertcondition(long_signal, "GT Long Entry", "Long Signal Detected!")).
Use TradingView's alert system with Strategy Tester outputs.
3. Usage Tips
Timeframe: Best for H1-D1 timeframes. Shorter frames (M1-M15) may produce noisy signals.
Settings:
Risk Management: Adjust sl_percent (e.g., 1% for volatile markets) and tp_percent (e.g., 3% for scalping).
Herd Threshold: Increase to 2.5 for stricter herd detection in choppy markets.
Liquidity Lookback: Reduce to 20 for faster markets (e.g., crypto).
Nash Period: Increase to 200 for longer-term analysis.
Backtesting:
Use TradingView's Strategy Tester to evaluate performance.
Check win rate (>50%), profit factor (>1.5), and max drawdown (<20%) for viability.
Test on different assets/timeframes to ensure robustness.
Live Trading:
Start with a demo account.
Combine with other indicators (e.g., EMAs, support/resistance) for confirmation.
Monitor liquidity traps and institutional flow for context.
Risk Management:
Always use SL/TP to limit losses.
Adjust position_size for risk tolerance (e.g., 5% of equity for conservative trading).
Avoid over-leveraging (pyramiding=3 can amplify risk).
Troubleshooting:
If no trades are executed, check signal conditions (e.g., lower herd_threshold or liquidity_sensitivity).
Ensure sufficient historical data for Nash and liquidity calculations.
If tables overlap, adjust position.top_right/bottom_right coordinates.
4. Key Differences from the Previous Indicator
Indicator vs. Strategy: The previous code was an indicator (VP + Game Theory Integrated Strategy) focused on visualization and alerts. This is a strategy with automated entries/exits and backtesting.
Volume Profile: Absent in this strategy, making it lighter but less focused on high-volume zones.
Wick Analysis: Not included here, unlike the previous indicator's heavy reliance on wick patterns.
Backtesting: This strategy includes detailed performance metrics and a backtest table, absent in the indicator.
Simpler Signals: Focuses on Game Theory signals (contrarian, momentum, Nash reversion) without the "Power/Ultra Power" hierarchy.
Risk Management: Explicit SL/TP and dynamic position sizing, not present in the indicator.
5. Conclusion
The "Game Theory Trading Strategy" is a sophisticated system leveraging herd behavior, institutional flows, liquidity traps, and Nash equilibrium to trade market inefficiencies. It’s designed for traders who understand Game Theory principles and want automated execution with robust risk management. However, it requires thorough backtesting and parameter optimization for specific markets (e.g., forex, crypto, stocks). The backtest table and visual aids make it easy to monitor performance, but always combine with other analysis tools and proper capital management.
If you need help with backtesting, adding alerts, or optimizing parameters, let me know!

Ultimate Scalping Strategy v2Strategy Overview
This is a versatile scalping strategy designed primarily for low timeframes (like 1-min, 3-min, or 5-min charts). Its core logic is based on a classic EMA (Exponential Moving Average) crossover system, which is then filtered by the VWAP (Volume-Weighted Average Price) to confirm the trade's direction in alignment with the market's current intraday sentiment.
The strategy is highly customizable, allowing traders to add layers of confirmation, control trade direction, and manage exits with precision.
Core Strategy Logic
The strategy's entry signals are generated when two primary conditions are met simultaneously:
Momentum Shift (EMA Crossover): It looks for a crossover between a fast EMA (default length 9) and a slow EMA (default length 21).
Buy Signal: The fast EMA crosses above the slow EMA, indicating a potential shift to bullish momentum.
Sell Signal: The fast EMA crosses below the slow EMA, indicating a potential shift to bearish momentum.
Trend/Sentiment Filter (VWAP): The crossover signal is only considered valid if the price is on the "correct" side of the VWAP.
For a Buy Signal: The price must be trading above the VWAP. This confirms that, on average, buyers are in control for the day.
For a Sell Signal: The price must be trading below the VWAP. This confirms that sellers are generally in control.
Confirmation Filters (Optional)
To increase the reliability of the signals and reduce false entries, the strategy includes two optional confirmation filters:
Price Action Filter (Engulfing Candle): If enabled (Use Price Action), the entry signal is only valid if the crossover candle is also an "engulfing" candle.
A Bullish Engulfing candle is a large green candle that completely "engulfs" the body of the previous smaller red candle, signaling strong buying pressure.
A Bearish Engulfing candle is a large red candle that engulfs the previous smaller green candle, signaling strong selling pressure.
Volume Filter (Volume Spike): If enabled (Use Volume Confirmation), the entry signal must be accompanied by a surge in volume. This is confirmed if the volume of the entry candle is greater than its recent moving average (default 20 periods). This ensures the move has strong participation behind it.
Exit Strategy
A position can be closed in one of three ways, creating a comprehensive exit plan:
Stop Loss (SL): A fixed stop loss is set at a level determined by a multiple of the Average True Range (ATR). For example, a 1.5 multiplier places the stop 1.5 times the current ATR value away from the entry price. This makes the stop dynamic, adapting to market volatility.
Take Profit (TP): A fixed take profit is also set using an ATR multiplier. By setting the TP multiplier higher than the SL multiplier (e.g., 2.0 for TP vs. 1.5 for SL), the strategy aims for a positive risk-to-reward ratio on each trade.
Exit on Opposite Signal (Reversal): If enabled, an open position will be closed automatically if a valid entry signal in the opposite direction appears. For example, if you are in a long trade and a valid short signal occurs, the strategy will exit the long position immediately. This feature turns the strategy into more of a reversal system.
Key Features & Customization
Trade Direction Control: You can enable or disable long and short trades independently using the Allow Longs and Allow Shorts toggles. This is useful for trading in harmony with a higher-timeframe trend (e.g., only allowing longs in a bull market).
Visual Plots: The strategy plots the Fast EMA, Slow EMA, and VWAP on the chart for easy visualization of the setup. It also plots up/down arrows to mark where valid buy and sell signals occurred.
Dynamic SL/TP Line Plotting: A standout feature is that the strategy automatically draws the exact Stop Loss and Take Profit price lines on the chart for every active trade. These lines appear when a trade is entered and disappear as soon as it is closed, providing a clear visual of your risk and reward targets.
Alerts: The script includes built-in alertcondition calls. This allows you to create alerts in TradingView that can notify you on your phone or execute trades automatically via a webhook when a long or short signal is generated.

Fusion Trend Pulse V2SCRIPT TITLE
Adaptive Fusion Trend Pulse V2 - Multi-Regime Strategy
DETAILED DESCRIPTION FOR PUBLICATION
🚀 INNOVATION SUMMARY
The Adaptive Fusion Trend Pulse V2 represents a breakthrough in algorithmic trading by introducing real-time market regime detection that automatically adapts strategy parameters based on current market conditions. Unlike static indicator combinations, this system dynamically adjusts its behavior across trending, choppy, and volatile market environments, providing a sophisticated multi-layered approach to market analysis.
🎯 CORE INNOVATIONS JUSTIFYING PROTECTED STATUS
1. Adaptive Market Regime Engine
Trending Market Detection: Uses ADX >25 with directional movement analysis
Volatile Market Classification: ATR-based volatility regime scoring (>1.2 threshold)
Choppy Market Identification: ADX <20 combined with volatility patterns
Dynamic Parameter Adjustment: All thresholds adapt based on detected regime
2. Multi-Component Fusion Algorithm
McGinley Dynamic Trend Baseline: Self-adjusting moving average that adapts to price velocity
Adaptive RMI (Relative Momentum Index): Enhanced RSI with momentum period adaptation
Zero-Lag EMA Smoothed CCI: Custom implementation reducing lag while maintaining signal quality
Hull MA Gradient Analysis: Slope strength normalized by ATR for trend confirmation
Volume Spike Detection: Regime-adjusted volume confirmation (0.8x-1.3x multipliers)
3. Intelligence Layer Features
Cooldown System: Prevents overtrading with regime-specific waiting periods (1-3 bars)
Performance Tracking: Real-time adaptation based on recent trade outcomes
Multi-Exchange Alert Integration: JSON-formatted alerts for automated trading
Comprehensive Dashboard: 16-metric real-time performance monitoring
📊 TECHNICAL SPECIFICATIONS
Market Regime Detection Philosophy:
The system continuously monitors market structure through volatility analysis and directional strength measurements. Rather than applying fixed thresholds, it creates dynamic response profiles that adjust the strategy's sensitivity, timing, and filtering based on the current market environment.
Adaptive Parameter Concept:
All strategy components modify their behavior based on regime classification. Volume requirements become more or less stringent, momentum thresholds shift to match market character, and exit timing adjusts to prevent whipsaws in different market conditions.
Entry Conditions (Both Long/Short):
McGinley trend alignment (close vs trend line)
Hull MA slope confirmation with ATR-normalized strength
Adaptive CCI above/below regime-specific thresholds
RMI momentum confirmation (>50 for long, <50 for short)
Volume spike exceeding regime-adjusted threshold
Regime-specific additional filters
Exit Strategy:
Dual take-profit system (2% and 4% default, customizable)
Momentum weakness detection (CCI reversal)
Trend breakdown (close below/above McGinley line)
Regime-specific urgency multipliers for faster exits in choppy markets
🎛️ USER CUSTOMIZATION OPTIONS
Core Parameters:
RMI Length & Momentum periods
CCI smoothing length
McGinley Dynamic length
Hull MA period for gradient analysis
Volume spike detection (length & multiplier)
Take profit levels (separate for long/short)
Adaptive Settings:
Market regime detection period (21 bars default)
Adaptation period for performance tracking (60 bars)
Volatility adaptation toggle
Trend strength filtering toggle
Momentum sensitivity multiplier (0.5-2.0 range)
Dashboard & Alerts:
Dashboard position (4 corners)
Dashboard size (Small/Normal/Large)
Transparency settings (0-100%)
Custom alert messages for bot integration
Date range filtering
🏆 UNIQUE VALUE PROPOSITIONS
1. Market Intelligence: First Pine Script strategy to implement comprehensive regime detection with parameter adaptation - most strategies use static settings regardless of market conditions.
2. Fusion Methodology: Combines 5+ distinct technical approaches (trend-following, momentum, volatility, volume, regime analysis) in a cohesive adaptive framework rather than simple indicator stacking.
3. Performance Optimization: Built-in learning system tracks recent performance and adjusts sensitivity - providing evolution rather than static rule-following.
4. Professional Integration: Enterprise-ready with JSON alert formatting, multi-exchange compatibility, and comprehensive performance tracking suitable for institutional use.
5. Visual Intelligence: Advanced dashboard provides 16 real-time metrics including regime classification, signal strength, and performance analytics - far beyond basic P&L displays.
🔧 TECHNICAL IMPLEMENTATION HIGHLIGHTS
Primary Applications:
Swing Trading: 4H-1D timeframes with regime-adapted entries
Algorithmic Trading: Automated execution via webhook alerts
Portfolio Management: Multi-timeframe analysis across different market conditions
Risk Management: Regime-aware position sizing and exit timing
Target Markets:
Cryptocurrency pairs (high volatility adaptation)
Forex majors (trending market optimization)
Stock indices (choppy market handling)
Commodities (volatile regime management)
🎯 WHY THIS ISN'T JUST AN INDICATOR MASHUP
Integrated Adaptation Framework: Unlike scripts that simply combine multiple indicators with static settings, this system creates a unified intelligence layer where each component influences and adapts to the others. The McGinley trend baseline doesn't just provide signals - it dynamically adjusts its sensitivity based on market regime detection. The momentum components modify their thresholds based on trend strength analysis.
Feedback Loop Architecture: The strategy incorporates a closed-loop learning system where recent performance influences future parameter selection. This creates evolution rather than static rule application. Most indicator combinations lack this adaptive learning capability.
Contextual Decision Making: Rather than treating each signal independently, the system uses contextual analysis where the same technical setup may generate different responses based on the current market regime. A momentum signal in a trending market triggers different behavior than the identical signal in choppy conditions.
Unified Risk Management: The regime detection doesn't just affect entries - it creates a comprehensive risk framework that adjusts exit timing, cooldown periods, and position management based on market character. This holistic approach distinguishes it from simple indicator stacking.
Custom Implementation Depth: Each component uses proprietary implementations (custom McGinley calculation, zero-lag CCI smoothing, enhanced RMI) rather than standard built-in functions, creating a cohesive algorithmic ecosystem rather than disconnected indicator outputs.
Custom Functions:
mcginley(): Proprietary implementation of McGinley Dynamic MA
rmi(): Enhanced Relative Momentum Index with custom parameters
zlema(): Zero-lag EMA for CCI smoothing
Regime classification algorithms with multi-factor analysis
Performance Optimizations:
Efficient variable management with proper scoping
Minimal repainting through careful historical referencing
Optimized calculations to prevent timeout issues
Memory-efficient tracking systems
Alert System:
JSON-formatted messages for API integration
Dynamic symbol/exchange substitution
Separate entry/exit/TP alert conditions
Customizable message formatting
⚡ WHY THIS REQUIRES PROTECTION
This strategy represents months of research into adaptive trading systems and market regime analysis. The specific combination of:
Proprietary regime detection algorithms
Custom adaptive parameter calculations
Multi-indicator fusion methodology
Performance-based learning system
Professional-grade implementation
Creates intellectual property that provides genuine competitive advantage. The methodology is not available in existing open-source scripts and represents original research into algorithmic trading adaptation.
🎯 EDUCATIONAL VALUE
Users gain exposure to:
Advanced market regime analysis techniques
Adaptive parameter optimization concepts
Multi-timeframe indicator fusion
Professional strategy development practices
Automated trading integration methods
The comprehensive dashboard and parameter explanations serve as a learning tool for understanding how professional algorithms adapt to changing market conditions.
CATEGORY SELECTION
Primary: Strategy
Secondary: Trend Analysis
SUGGESTED TAGS
adaptive, trend, momentum, regime, strategy, alerts, dashboard, mcginley, rmi, cci, professional
MANDATORY DISCLAIMER
Disclaimer: This strategy is for educational and informational purposes only. It does not constitute financial advice. Trading cryptocurrencies involves substantial risk, and past performance is not indicative of future results. Always backtest and forward-test before using on a live account. Use at your own risk.

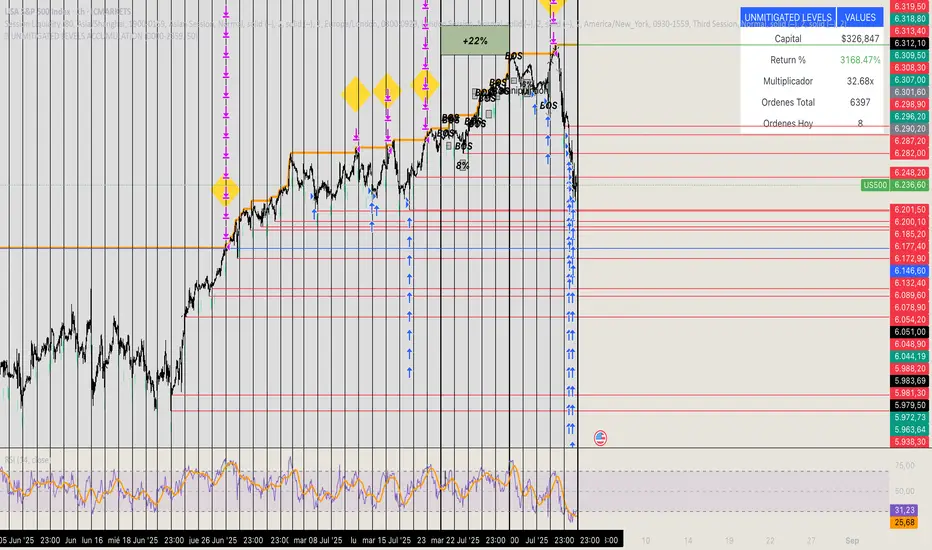
🏆 UNMITIGATED LEVELS ACCUMULATIONPDH TO ATH RISK FREE
All the PDL have a buy limit which starts at 0.1 lots which will duplicate at the same time the capital incresases. All of the buy limits have TP in ATH for max reward.
Parallax Momentum MNQ Strategy# 📈 Parallax Momentum MNQ Strategy
## Overview
The Parallax Momentum MNQ Strategy is a sophisticated support/resistance breakout system specifically designed for Micro Nasdaq futures (MNQ) trading (also works on minis). This strategy combines dynamic level detection with momentum confirmation to identify high-probability entry opportunities while maintaining strict risk management protocols.
## 🎯 Key Features
### Core Strategy Logic
- **Dynamic Support/Resistance Detection**: Automatically identifies key levels using configurable lookback periods
- **Momentum Confirmation**: Volume-based filtering ensures trades align with market momentum
- **ATR-Based Risk Management**: Adaptive stop losses and take profits based on market volatility
- **Dual Entry System**: Both long and short opportunities with limit order execution
### Risk Management
- **ATR-Adaptive Stops**: Stop losses and take profits automatically adjust to market volatility
- **Reward-to-Risk Ratios**: Configurable R:R ratios with default 2:1 minimum
- **Maximum Loss Protection**: Optional daily loss limits to prevent overtrading
- **Session Time Filtering**: Trade only during specified market hours
### Strategy Modes
- **Conservative Mode**: 0.8x risk multiplier for cautious trading
- **Balanced Mode**: Standard 1.0x risk multiplier (default)
- **Aggressive Mode**: 1.2x risk multiplier for active trading
## 📊 Visual Features
### Dashboard Display
- Real-time strategy status and performance metrics
- Current support/resistance levels and ATR values
- Live risk-to-reward ratios for potential trades
- Win rate, profit factor, and drawdown statistics
- Adjustable dashboard size and positioning
### Chart Indicators
- Support and resistance lines with labels
- ATR-based levels (+/-1 ATR and +/-2 ATR)
- Dynamic visual updates as levels change
- Configurable line extensions and styling
## ⚙️ Configuration Options
### Entry Filters
- **Volume Filter**: Optional volume confirmation above SMA
- **Session Time Filter**: 12-hour format time restrictions
- **ATR vs Fixed Stops**: Choose between adaptive or fixed tick-based exits
### Risk Controls
- **ATR Period**: Default 14-period ATR calculation
- **Stop Loss Multiplier**: ATR-based stop distance (default 1.5x)
- **Take Profit Multiplier**: ATR-based target distance (default 1.5x)
- **Secondary Take Profit**: Optional TP2 with position scaling
## 📋 How It Works
### Entry Conditions
**Long Trades**: Triggered when price closes above support buffer but low touches support level, with volume and session confirmation
**Short Trades**: Triggered when price closes below resistance buffer but high touches resistance level, with volume and session confirmation
### Exit Strategy
- **Primary Take Profit**: ATR-based target with 2:1 R:R minimum
- **Stop Loss**: ATR-based protective stop
- **Optional TP2**: Extended target for partial profit taking
- **One Trade at a Time**: No overlapping positions
## 🎛️ Default Settings
- **Lookback Period**: 20 bars for support/resistance detection
- **ATR Period**: 14 bars for volatility calculation
- **Stop Loss**: 1.5x ATR from entry
- **Take Profit**: 1.5x ATR with 2:1 reward-to-risk ratio
- **Session**: 7:30 AM - 2:00 PM (configurable)
## ⚠️ Important Notes
### Risk Disclaimer
- This strategy is for educational and informational purposes only
- Past performance does not guarantee future results
- Always use proper position sizing and risk management
- Test thoroughly on historical data before live trading
- Consider market conditions and volatility when using
### Best Practices
- Backtest on sufficient historical data
- Start with conservative mode for new users
- Monitor performance regularly and adjust parameters as needed
- Use appropriate position sizing for your account
- Consider broker commissions and slippage in live trading
## 🔧 Customization
The strategy offers extensive customization options including:
- Adjustable time sessions with AM/PM format
- Configurable ATR and risk parameters
- Optional maximum daily loss limits
- Dashboard size and position controls
- Visual element toggles and styling
## 📈 Ideal For
- MNQ (Micro Nasdaq) futures traders
- Intraday momentum strategies
- Traders seeking systematic entry/exit rules
- Risk-conscious traders wanting automated stops
- Both beginner and experienced algorithmic traders
---
**Version**: Pine Script v5 Compatible
**Timeframe**: Works on multiple timeframes (test on 1m, 3m, 5m, 15m)
**Market**: Optimized for MNQ but adaptable to other instruments
**Strategy Type**: Trend following with momentum confirmation
