LibVolmLibrary "LibVolm"
This library provides a collection of core functions for volume and
money flow analysis. It offers implementations of several classic
volume-based indicators, with a focus on flexibility
for applications like multi-timeframe and session-based analysis.
Key Features:
1. **Suite of Classic Volume Indicators:** Includes standard
implementations of several foundational indicators:
- **On Balance Volume (`obv`):** A momentum indicator that
accumulates volume based on price direction.
- **Accumulation/Distribution Line (`adLine`):** Measures cumulative
money flow using the close's position within the bar's range.
- **Chaikin Money Flow (`cmf`):** An oscillator version of the ADL
that measures money flow over a specified lookback period.
2. **Anchored/Resettable Indicators:** The library includes flexible,
resettable indicators ideal for cyclical analysis:
- **Anchored VWAP (`vwap`):** Calculates a Volume Weighted Average
Price that can be reset on any user-defined `reset` condition.
It returns both the VWAP and the number of bars (`prdBars`) in
the current period.
- **Resettable CVD (`cvd`):** Computes a Cumulative Volume Delta
that can be reset on a custom `reset` anchor. The function
also tracks and returns the highest (`hi`) and lowest (`lo`)
delta values reached within the current period.
(Note: The delta sign is determined by a specific logic:
it first checks close vs. open, then close vs. prior
close, and persists the last non-zero sign).
3. **Volume Sanitization:** All functions that use the built-in
`volume` variable automatically sanitize it via an internal
function. This process replaces `na` values with 0 and ensures
no negative volume values are used, providing stable calculations.
---
**DISCLAIMER**
This library is provided "AS IS" and for informational and
educational purposes only. It does not constitute financial,
investment, or trading advice.
The author assumes no liability for any errors, inaccuracies,
or omissions in the code. Using this library to build
trading indicators or strategies is entirely at your own risk.
As a developer using this library, you are solely responsible
for the rigorous testing, validation, and performance of any
scripts you create based on these functions. The author shall
not be held liable for any financial losses incurred directly
or indirectly from the use of this library or any scripts
derived from it.
obv(price)
Calculates the On Balance Volume (OBV) cumulative indicator.
Parameters:
price (float) : series float Source price series, typically the close.
Returns: series float Cumulative OBV value.
adLine()
Computes the Accumulation/Distribution Line (AD Line).
Returns: series float Cumulative AD Line value.
cmf(length)
Computes Chaikin Money Flow (CMF).
Parameters:
length (int) : series int Lookback length for the CMF calculation.
Returns: series float CMF value.
vwap(price, reset)
Calculates an anchored Volume Weighted Average Price (VWAP).
Parameters:
price (float) : series float Source price series (usually *close*).
reset (bool) : series bool A signal that is *true* on the bar where the
accumulation should be reset.
Returns:
vwap series float The calculated Volume Weighted Average Price for the current period.
prdBars series int The number of bars that have passed since the last reset.
cvd(reset)
Calculates a resettable, cumulative Volume Delta (CVD).
It accumulates volume delta and tracks its high/low range. The
accumulation is reset to zero whenever the `reset` condition is true.
This is useful for session-based analysis, intra-bar calculations,
or any other custom-anchored accumulation.
Parameters:
reset (bool) : series bool A signal that is *true* on the bar where the
accumulation should be reset.
Returns:
cum series float The current cumulative volume delta.
hi series float The highest peak the cumulative delta has reached in the current period.
lo series float The lowest trough the cumulative delta has reached in the current period.
Volumeanalysis

WhispererRealtimeVolumeLibrary "WhispererRealtimeVolume"
▮ Overview
The Whisperer Realtime Volume Library is a lightweight and reusable Pine Script® library designed for real-time volume analysis.
It calculates up, down, and neutral volumes dynamically, making it an essential tool for traders who want to gain deeper insights into market activity.
This library is a simplified and modular version of the original "Realtime Volume Bars w Market Buy/Sell/Neutral split & Mkt Delta" indicator by the_MarketWhisperer , tailored for integration into custom scripts.
How bars are classified
- Up Bars
If the current bar’s closing price is higher than the previous bar’s closing price, it is classified as an up bar.
Volume handling:
The increase in volume for this bar is added to the up volume.
This represents buying pressure.
- Down Bars
If the current bar’s closing price is lower than the previous bar’s closing price, it is classified as a down bar.
Volume handling:
The increase in volume for this bar is added to the down volume.
This represents selling pressure.
- Neutral Bars
If the current bar’s closing price is the same as the previous bar’s closing price, it is classified as a neutral bar.
Volume handling:
If neutral volume is enabled, the volume is added to the neutral volume.
If neutral volume is not enabled, the volume is assigned to the same direction as the previous bar (up or down). If the previous direction is unknown, it is added to the neutral volume.
▮ What to look for
Real-Time Volume Calculation : Analyze up, down, and neutral volumes in real-time based on price movements and bar volume.
Customizable Start Line : Add a visual reference line to your chart for better context by viewing the starting point of real-time bars.
Ease of Integration : Designed as a library for seamless use in other Pine Script® indicators or strategies.
▮ How to use
Example code:
//@version=6
indicator("Volume Realtime from Whisperer")
import andre_007/WhispererRealtimeVolume/4 as MW
MW.displayStartLine(startLineColor = color.gray, startLineWidth = 1, startLineStyle = line.style_dashed,
displayStartLine = true, y1=volume, y2=volume + 10)
= MW.mw_upDownVolumeRealtime(true)
plot(volume, style=plot.style_columns, color=color.gray)
plot(volumeUp, style=plot.style_columns, color=color.green)
plot(volumeDown, style=plot.style_columns, color=color.red)
plot(volumeNeutral, style=plot.style_columns, color=color.purple)
▮ Credits
This library is inspired by the original work of the_MarketWhisperer , whose "Realtime Volume Bars" indicator served as the foundation.
Link to original indicator :

VolumeSpreadAnalysisLibrary "VolumeSpreadAnalysis"
A library for Volume Spread Analysis (VSA).
spread(_barIndex)
Calculates the spread of a bar.
Parameters:
_barIndex (int) : (int) The index of the bar.
Returns: (float) The spread of the bar.
volume(_barIndex)
Retrieves the volume of a bar.
Parameters:
_barIndex (int) : (int) The index of the bar.
Returns: (float) The volume of the bar.
body(_barIndex)
Calculates the body of a bar.
Parameters:
_barIndex (simple int) : (int) The index of the bar.
Returns: (float) The body size of the bar.
wickUpper(_barIndex)
Calculates the upper wick of a bar (upper shadow).
Parameters:
_barIndex (simple int) : (int) The index of the bar.
Returns: (float) The upper wick size of the bar.
wickLower(_barIndex)
Calculates the lower wick of a bar (lower shadow).
Parameters:
_barIndex (simple int) : (int) The index of the bar.
Returns: (float) The lower wick size of the bar.
calcForecastedSMA(_source, _length, _forecastedLevel)
Calculates the forecasted Simple Moving Average (SMA).
Parameters:
_source (float) : (series float) Source data for calculation.
_length (simple int) : (int) The length of the SMA.
_forecastedLevel (float) : (float) The forecasted level to include in the calculation.
Returns: (float) The forecasted SMA value.
calcForecastedEMA(_source, _length, _forecastedLevel)
Calculates the forecasted Exponential Moving Average (EMA).
Parameters:
_source (float) : (series float) Source data for calculation.
_length (simple int) : (int) The length of the EMA.
_forecastedLevel (float) : (float) The forecasted level to include in the calculation.
Returns: (float) The forecasted EMA value.
calcForecastedRMA(_source, _length, _forecastedLevel)
Calculates the forecasted Relative Moving Average (RMA).
Parameters:
_source (float) : (series float) Source data for calculation.
_length (simple int) : (int) The length of the RMA.
_forecastedLevel (float) : (float) The forecasted level to include in the calculation.
Returns: (float) The forecasted RMA value.
calcForecastedWMA(_source, _length, _forecastedLevel)
Calculates the forecasted Weighted Moving Average (WMA).
Parameters:
_source (float) : (series float) Source data for calculation.
_length (simple int) : (int) The length of the WMA.
_forecastedLevel (float) : (float) The forecasted level to include in the calculation.
Returns: (float) The forecasted WMA value.
calcElapsedTimePercent()
Calculates the elapsed time percent of the current bar.
Returns: (float) The elapsed time percent.
calcForecastedSpread(multiplierAtMidpoints, multiplierAtPeaks)
Calculates the forecasted spread using elapsed time and dynamic multipliers, handling spread's non-linear nature.
Parameters:
multiplierAtMidpoints (float) : (float) The multiplier value at midpoints.
multiplierAtPeaks (float) : (float) The multiplier value at peaks.
Returns: (float) The forecasted spread value.
calcForecastedVolume()
Calculates the forecasted volume using elapsed time, satisfying volume's linear nature.
Returns: (float) The forecasted volume value.
calcForecastedMA(_source, _length, _forecastedSource, _type)
Calculates the forecasted Moving Average (MA) based on the specified type.
Parameters:
_source (float) : (series float) Source data for calculation.
_length (simple int) : (int) The length of the MA.
_forecastedSource (float) : (float) The forecasted level to include in the calculation.
_type (simple string) : (string) The type of the MA ("SMA", "EMA", "SMMA (RMA)", "WMA").
Returns: (float) The forecasted MA value.
calcMA(_source, _length, _type)
Calculates the Moving Average (MA) based on the specified type.
Parameters:
_source (float) : (series float) Source data for calculation.
_length (simple int) : (int) The length of the MA.
_type (simple string) : (string) The type of the MA ("SMA", "EMA", "SMMA (RMA)", "WMA").
Returns: (float) The MA value.
bullBar(_barIndex)
Determines if the bar is bullish.
Parameters:
_barIndex (simple int) : (int) The index of the bar.
Returns: (bool) True if the bar is bullish, otherwise false.
bearBar(_barIndex)
Determines if the bar is bearish.
Parameters:
_barIndex (simple int) : (int) The index of the bar.
Returns: (bool) True if the bar is bearish, otherwise false.
breakout(_barIndex)
Determines if there is a breakout above the previous bar.
Parameters:
_barIndex (simple int) : (int) The index of the bar.
Returns: (bool) True if there is a breakout, otherwise false.
breakdown(_barIndex)
Determines if there is a breakdown below the previous bar.
Parameters:
_barIndex (simple int) : (int) The index of the bar.
Returns: (bool) True if there is a breakdown, otherwise false.
rejectionWickUpper(_rejectionWick)
Determines if the upper wick is a rejection wick.
Parameters:
_rejectionWick (simple float) : (float) The rejection wick percentage.
Returns: (bool) True if the upper wick is a rejection wick, otherwise false.
rejectionWickLower(_rejectionWick)
Determines if the lower wick is a rejection wick.
Parameters:
_rejectionWick (simple float) : (float) The rejection wick percentage.
Returns: (bool) True if the lower wick is a rejection wick, otherwise false.
setupDataVolume(_data, _mult_Low, _mult_High, _mult_Ultra, _maLengthVolume, _maTypeVolume)
Sets up data for volume levels.
Parameters:
_data (map) : (map) The map to store the levels.
_mult_Low (simple float) : (float) The multiplier for low level.
_mult_High (simple float) : (float) The multiplier for high level.
_mult_Ultra (simple float) : (float) The multiplier for ultra level.
_maLengthVolume (simple int) : (int) The length for MA.
_maTypeVolume (simple string) : (string) The type for MA.
Returns: (void) Nothing.
setupDataSpread(_data, _mult_Low, _mult_High, _mult_Ultra, _maLengthSpread, _maTypeSpread)
Sets up data for spread levels.
Parameters:
_data (map) : (map) The map to store the levels.
_mult_Low (simple float) : (float) The multiplier for low level.
_mult_High (simple float) : (float) The multiplier for high level.
_mult_Ultra (simple float) : (float) The multiplier for ultra level.
_maLengthSpread (simple int) : (int) The length for MA.
_maTypeSpread (simple string) : (string) The type for MA.
Returns: (void) Nothing.
setupDataForecastVolume(_dataForecast, _mult_Low, _mult_High, _mult_Ultra, _maLengthVolume, _predictedLevelVolume, _maTypeVolume)
Sets up data for volume and spread levels for forecast.
Parameters:
_dataForecast (map)
_mult_Low (simple float) : (float) The multiplier for low level.
_mult_High (simple float) : (float) The multiplier for high level.
_mult_Ultra (simple float) : (float) The multiplier for ultra level.
_maLengthVolume (simple int) : (int) The length for MA.
_predictedLevelVolume (float) : (float) The predicted level for MA.
_maTypeVolume (simple string) : (string) The type for MA.
Returns: (void) Nothing.
setupDataForecastSpread(_dataForecast, _mult_Low, _mult_High, _mult_Ultra, _maLengthSpread, _predictedLevelSpread, _maTypeSpread)
Sets up data for spread levels for forecast.
Parameters:
_dataForecast (map)
_mult_Low (simple float) : (float) The multiplier for low level.
_mult_High (simple float) : (float) The multiplier for high level.
_mult_Ultra (simple float) : (float) The multiplier for ultra level.
_maLengthSpread (simple int) : (int) The length for MA.
_predictedLevelSpread (float) : (float) The predicted level for MA.
_maTypeSpread (simple string) : (string) The type for MA.
Returns: (void) Nothing.
isVolumeLow(_data, _barIndex)
Determines if the volume is low.
Parameters:
_data (map) : (map) The data map with volume levels.
_barIndex (int)
Returns: (bool) True if the volume is low, otherwise false.
isVolumeNormal(_data, _barIndex)
Determines if the volume is normal.
Parameters:
_data (map) : (map) The data map with volume levels.
_barIndex (int)
Returns: (bool) True if the volume is normal, otherwise false.
isVolumeHigh(_data, _barIndex)
Determines if the volume is high.
Parameters:
_data (map) : (map) The data map with volume levels.
_barIndex (int)
Returns: (bool) True if the volume is high, otherwise false.
isVolumeUltra(_data, _barIndex)
Determines if the volume is ultra.
Parameters:
_data (map) : (map) The data map with volume levels.
_barIndex (int)
Returns: (bool) True if the volume is ultra, otherwise false.
isSpreadLow(_data, _barIndex)
Determines if the spread is low.
Parameters:
_data (map) : (map) The data map with spread levels.
_barIndex (int)
Returns: (bool) True if the spread is low, otherwise false.
isSpreadNormal(_data, _barIndex)
Determines if the spread is normal.
Parameters:
_data (map) : (map) The data map with spread levels.
_barIndex (int)
Returns: (bool) True if the spread is normal, otherwise false.
isSpreadHigh(_data, _barIndex)
Determines if the spread is high.
Parameters:
_data (map) : (map) The data map with spread levels.
_barIndex (int)
Returns: (bool) True if the spread is high, otherwise false.
isSpreadUltra(_data, _barIndex)
Determines if the spread is ultra.
Parameters:
_data (map) : (map) The data map with spread levels.
_barIndex (int)
Returns: (bool) True if the spread is ultra, otherwise false.
isVolumeText(_data)
Determines text string representing the volume area level.
Parameters:
_data (map) : (map) The data map with volume levels.
Returns: (string) Text string of Low, Normal, High, or Ultra.
isSpreadText(_data)
Determines text string representing the spread area level.
Parameters:
_data (map) : (map) The data map with spread levels.
Returns: (string) Text string of Low, Normal, High, or Ultra.
calcBarColor(_value, _level)
Calculates the color based level.
Parameters:
_value (float) : (float) The value to check.
_level (float) : (float) The value level for comparison.
Returns: (color) The color for the bar.
bullPinBar(_maxBodyPercent, _minWickPercent)
Determines if the bar is a bull pin bar.
Parameters:
_maxBodyPercent (simple float) : (float) The maximum body percentage.
_minWickPercent (simple float) : (float) The minimum wick percentage.
Returns: (bool) True if the bar is a bull pin bar, otherwise false.
bearPinBar(_maxBodyPercent, _minWickPercent)
Determines if the bar is a bear pin bar.
Parameters:
_maxBodyPercent (simple float) : (float) The maximum body percentage.
_minWickPercent (simple float) : (float) The minimum wick percentage.
Returns: (bool) True if the bar is a bear pin bar, otherwise false.
dojiBar(_maxBodyPercent)
Determines if the bar is a doji.
Parameters:
_maxBodyPercent (simple float) : (float) The maximum body percentage.
Returns: (bool) True if the bar is a doji, otherwise false.
spinningTopBar(_minWicksPercent, _emaLength)
Determines if the bar is a spinning top.
Parameters:
_minWicksPercent (simple float) : (float) The minimum wicks percentage.
_emaLength (simple int) : (int) The length for EMA calculation.
Returns: (bool) True if the bar is a spinning top, otherwise false.
highWaveBar(_minBodyPercent, _minWickPercent, _bars)
Determines if the bar is a high wave bar.
Parameters:
_minBodyPercent (simple float) : (float) The minimum body percentage.
_minWickPercent (simple float) : (float) The minimum wick percentage.
_bars (simple int) : (int) The number of bars for comparison.
Returns: (bool) True if the bar is a high wave bar, otherwise false.
consolidationBar(_data, _spread, _bars)
Determines if the bars are in consolidation.
Parameters:
_data (map) : (map) The data map with spread levels.
_spread (simple float) : (float) The spread percentage for comparison.
_bars (simple int) : (int) The number of bars for comparison.
Returns: (bool) True if the bars are in consolidation, otherwise false.
S_DownThrust(_data, _bullPinBarMaxBody, _bullPinBarMinWick)
Determines if there is a sign of strength (DownThrust).
Parameters:
_data (map) : (map) The data map with volume and spread levels.
_bullPinBarMaxBody (simple float) : (float) The maximum body percentage for bull pin bar.
_bullPinBarMinWick (simple float) : (float) The minimum wick percentage for bull pin bar.
Returns: (bool) True if there is a sign of strength (DownThrust), otherwise false.
S_SellingClimax(_data, _rejectionWick)
Determines if there is a sign of strength (Selling Climax).
Parameters:
_data (map) : (map) The data map with volume and spread levels.
_rejectionWick (simple float) : (float) The rejection wick percentage.
Returns: (bool) True if there is a sign of strength (Selling Climax), otherwise false.
S_NoEffortBearishResult()
Determines if there is a sign of strength (No Effort Bearish Result).
Returns: (bool) True if there is a sign of strength (No Effort Bearish Result), otherwise false.
S_BearishEffortNoResult()
Determines if there is a sign of strength (Bearish Effort No Result).
Returns: (bool) True if there is a sign of strength (Bearish Effort No Result), otherwise false.
S_InverseDownThrust(_data, _bearPinBarMaxBody, _bearPinBarMinWick)
Determines if there is a sign of strength (Inverse DownThrust).
Parameters:
_data (map) : (map) The data map with volume and spread levels.
_bearPinBarMaxBody (simple float) : (float) The maximum body percentage for bear pin bar.
_bearPinBarMinWick (simple float) : (float) The minimum wick percentage for bear pin bar.
Returns: (bool) True if there is a sign of strength (Inverse DownThrust), otherwise false.
S_FailedSellingClimax()
Determines if there is a sign of strength (Failed Selling Climax).
Returns: (bool) True if there is a sign of strength (Failed Selling Climax), otherwise false.
S_BullOutsideReversal(_data)
Determines if there is a sign of strength (Bull Outside Reversal).
Parameters:
_data (map) : (map) The data map with volume and spread levels.
Returns: (bool) True if there is a sign of strength (Bull Outside Reversal), otherwise false.
S_EndOfFallingMarket(_data)
Determines if there is a sign of strength (End of Falling Market).
Parameters:
_data (map) : (map) The data map with volume and spread levels.
Returns: (bool) True if there is a sign of strength (End of Falling Market), otherwise false.
S_PseudoDownThrust(_bullPinBarMaxBody, _bullPinBarMinWick)
Determines if there is a sign of strength (Pseudo DownThrust).
Parameters:
_bullPinBarMaxBody (simple float) : (float) The maximum body percentage for bull pin bar.
_bullPinBarMinWick (simple float) : (float) The minimum wick percentage for bull pin bar.
Returns: (bool) True if there is a sign of strength (Pseudo DownThrust), otherwise false.
S_NoSupply(_bullPinBarMaxBody, _bullPinBarMinWick)
Determines if there is a sign of strength (No Supply).
Parameters:
_bullPinBarMaxBody (simple float) : (float) The maximum body percentage for bull pin bar.
_bullPinBarMinWick (simple float) : (float) The minimum wick percentage for bull pin bar.
Returns: (bool) True if there is a sign of strength (No Supply), otherwise false.
W_UpThrust(_data, _bearPinBarMaxBody, _bearPinBarMinWick)
Determines if there is a sign of weakness (UpThrust).
Parameters:
_data (map) : (map) The data map with volume and spread levels.
_bearPinBarMaxBody (simple float) : (float) The maximum body percentage for bear pin bar.
_bearPinBarMinWick (simple float) : (float) The minimum wick percentage for bear pin bar.
Returns: (bool) True if there is a sign of weakness (UpThrust), otherwise false.
W_BuyingClimax(_data, _rejectionWick)
Determines if there is a sign of weakness (Buying Climax).
Parameters:
_data (map) : (map) The data map with volume and spread levels.
_rejectionWick (simple float) : (float) The rejection wick percentage.
Returns: (bool) True if there is a sign of weakness (Buying Climax), otherwise false.
W_NoEffortBullishResult()
Determines if there is a sign of weakness (No Effort Bullish Result).
Returns: (bool) True if there is a sign of weakness (No Effort Bullish Result), otherwise false.
W_BullishEffortNoResult()
Determines if there is a sign of weakness (Bullish Effort No Result).
Returns: (bool) True if there is a sign of weakness (Bullish Effort No Result), otherwise false.
W_InverseUpThrust(_data, _bullPinBarMaxBody, _bullPinBarMinWick)
Determines if there is a sign of weakness (Inverse UpThrust).
Parameters:
_data (map) : (map) The data map with volume and spread levels.
_bullPinBarMaxBody (simple float) : (float) The maximum body percentage for bull pin bar.
_bullPinBarMinWick (simple float) : (float) The minimum wick percentage for bull pin bar.
Returns: (bool) True if there is a sign of weakness (Inverse UpThrust), otherwise false.
W_FailedBuyingClimax()
Determines if there is a sign of weakness (Failed Buying Climax).
Returns: (bool) True if there is a sign of weakness (Failed Buying Climax), otherwise false.
W_BearOutsideReversal(_data)
Determines if there is a sign of weakness (Bear Outside Reversal).
Parameters:
_data (map) : (map) The data map with volume and spread levels.
Returns: (bool) True if there is a sign of weakness (Bear Outside Reversal), otherwise false.
W_EndOfRisingMarket(_data)
Determines if there is a sign of weakness (End of Rising Market).
Parameters:
_data (map) : (map) The data map with volume and spread levels.
Returns: (bool) True if there is a sign of weakness (End of Rising Market), otherwise false.
W_PseudoUpThrust(_bearPinBarMaxBody, _bearPinBarMinWick)
Determines if there is a sign of weakness (Pseudo UpThrust).
Parameters:
_bearPinBarMaxBody (simple float) : (float) The maximum body percentage for bear pin bar.
_bearPinBarMinWick (simple float) : (float) The minimum wick percentage for bear pin bar.
Returns: (bool) True if there is a sign of weakness (Pseudo UpThrust), otherwise false.
W_NoDemand(_bearPinBarMaxBody, _bearPinBarMinWick)
Determines if there is a sign of weakness (No Demand).
Parameters:
_bearPinBarMaxBody (simple float) : (float) The maximum body percentage for bear pin bar.
_bearPinBarMinWick (simple float) : (float) The minimum wick percentage for bear pin bar.
Returns: (bool) True if there is a sign of weakness (No Demand), otherwise false.
N_QuietDoji(_dojiBarMaxBody)
Determines if there is a neutral signal (Quiet Doji).
Parameters:
_dojiBarMaxBody (simple float) : (float) The maximum body percentage for doji bar.
Returns: (bool) True if there is a neutral signal (Quiet Doji), otherwise false.
N_BalancedDoji(_data, _dojiBarMaxBody)
Determines if there is a neutral signal (Balanced Doji).
Parameters:
_data (map) : (map) The data map with volume and spread levels.
_dojiBarMaxBody (simple float) : (float) The maximum body percentage for doji bar.
Returns: (bool) True if there is a neutral signal (Balanced Doji), otherwise false.
N_StrongDoji(_dojiBarMaxBody)
Determines if there is a neutral signal (Strong Doji).
Parameters:
_dojiBarMaxBody (simple float) : (float) The maximum body percentage for doji bar.
Returns: (bool) True if there is a neutral signal (Strong Doji), otherwise false.
N_QuietSpinningTop(_spinningTopBarMinWicks, _spinningTopBarEmaLength)
Determines if there is a neutral signal (Quiet Spinning Top).
Parameters:
_spinningTopBarMinWicks (simple float) : (float) The minimum wicks percentage for spinning top bar.
_spinningTopBarEmaLength (simple int) : (int) The length for EMA calculation.
Returns: (bool) True if there is a neutral signal (Quiet Spinning Top), otherwise false.
N_BalancedSpinningTop(_data, _spinningTopBarMinWicks, _spinningTopBarEmaLength)
Determines if there is a neutral signal (Balanced Spinning Top).
Parameters:
_data (map) : (map) The data map with volume and spread levels.
_spinningTopBarMinWicks (simple float) : (float) The minimum wicks percentage for spinning top bar.
_spinningTopBarEmaLength (simple int) : (int) The length for EMA calculation.
Returns: (bool) True if there is a neutral signal (Balanced Spinning Top), otherwise false.
N_StrongSpinningTop(_spinningTopBarMinWicks, _spinningTopBarEmaLength)
Determines if there is a neutral signal (Strong Spinning Top).
Parameters:
_spinningTopBarMinWicks (simple float) : (float) The minimum wicks percentage for spinning top bar.
_spinningTopBarEmaLength (simple int) : (int) The length for EMA calculation.
Returns: (bool) True if there is a neutral signal (Strong Spinning Top), otherwise false.
N_QuietHighWave(_highWaveBarMinBody, _highWaveBarMinWick, _highWaveBarBars)
Determines if there is a neutral signal (Quiet High Wave).
Parameters:
_highWaveBarMinBody (simple float) : (float) The minimum body percentage for high wave bar.
_highWaveBarMinWick (simple float) : (float) The minimum wick percentage for high wave bar.
_highWaveBarBars (simple int) : (int) The number of bars for comparison.
Returns: (bool) True if there is a neutral signal (Quiet High Wave), otherwise false.
N_BalancedHighWave(_data, _highWaveBarMinBody, _highWaveBarMinWick, _highWaveBarBars)
Determines if there is a neutral signal (Balanced High Wave).
Parameters:
_data (map) : (map) The data map with volume and spread levels.
_highWaveBarMinBody (simple float) : (float) The minimum body percentage for high wave bar.
_highWaveBarMinWick (simple float) : (float) The minimum wick percentage for high wave bar.
_highWaveBarBars (simple int) : (int) The number of bars for comparison.
Returns: (bool) True if there is a neutral signal (Balanced High Wave), otherwise false.
N_StrongHighWave(_highWaveBarMinBody, _highWaveBarMinWick, _highWaveBarBars)
Determines if there is a neutral signal (Strong High Wave).
Parameters:
_highWaveBarMinBody (simple float) : (float) The minimum body percentage for high wave bar.
_highWaveBarMinWick (simple float) : (float) The minimum wick percentage for high wave bar.
_highWaveBarBars (simple int) : (int) The number of bars for comparison.
Returns: (bool) True if there is a neutral signal (Strong High Wave), otherwise false.
N_Consolidation(_data, _consolidationBarSpread, _consolidationBarBars)
Determines if there is a neutral signal (Consolidation).
Parameters:
_data (map) : (map) The data map with volume and spread levels.
_consolidationBarSpread (simple float) : (float) The spread percentage for consolidation bar.
_consolidationBarBars (simple int) : (int) The number of bars for comparison.
Returns: (bool) True if there is a neutral signal (Consolidation), otherwise false.

SessionVolumeProfileLibrary "SessionVolumeProfile"
Analyzes price & volume during regular trading hours to provide a session volume profile analysis. The primary goal of this library is to provide the developer with three values: the value area high, low and the point of control. The library also provides methods for rendering the value areas and histograms. To learn more about this library and how you can use it, click on the website link in my profile where you will find a blog post with detailed information.
debug(vp, position)
Helper function to write some information about the supplied SVP object to the screen in a table.
Parameters:
vp (Object) : The SVP object to debug
position (string) : The position.* to place the table. Defaults to position.bottom_center
getLowerTimeframe()
Depending on the timeframe of the chart, determines a lower timeframe to grab volume data from for the analysis
Returns: The timeframe string to fetch volume for
get(volumeProfile, lowerTimeframeHigh, lowerTimeframeLow, lowerTimeframeVolume)
Populated the provided SessionVolumeProfile object with vp data on the session.
Parameters:
volumeProfile (Object) : The SessionVolumeProfile object to populate
lowerTimeframeHigh (float ) : The lower timeframe high values
lowerTimeframeLow (float ) : The lower timeframe low values
lowerTimeframeVolume (float ) : The lower timeframe volume values
drawPriorValueAreas(todaySessionVolumeProfile, extendYesterdayOverToday, showLabels, labelSize, pocColor, pocStyle, pocWidth, vahlColor, vahlStyle, vahlWidth, vaColor)
Given a SessionVolumeProfile Object, will render the historical value areas for that object.
Parameters:
todaySessionVolumeProfile (Object) : The SessionVolumeProfile Object to draw
extendYesterdayOverToday (bool) : Defaults to true
showLabels (bool) : Defaults to true
labelSize (string) : Defaults to size.small
pocColor (color) : Defaults to #e500a4
pocStyle (string) : Defaults to line.style_solid
pocWidth (int) : Defaults to 1
vahlColor (color) : The color of the value area high/low lines. Defaults to #1592e6
vahlStyle (string) : The style of the value area high/low lines. Defaults to line.style_solid
vahlWidth (int) : The width of the value area high/low lines. Defaults to 1
vaColor (color) : The color of the value area background. Defaults to #00bbf911)
drawHistogram(volumeProfile, bgColor, showVolumeOnHistogram)
Given a SessionVolumeProfile object, will render the histogram for that object.
Parameters:
volumeProfile (Object) : The SessionVolumeProfile object to draw
bgColor (color) : The baseline color to use for the histogram. Defaults to #00bbf9
showVolumeOnHistogram (bool) : Show the volume amount on the histogram bars. Defaults to false.
Object
Fields:
numberOfRows (series__integer)
valueAreaCoverage (series__integer)
trackDevelopingVa (series__bool)
valueAreaHigh (series__float)
pointOfControl (series__float)
valueAreaLow (series__float)
startTime (series__integer)
endTime (series__integer)
dayHigh (series__float)
dayLow (series__float)
step (series__float)
pointOfControlLevel (series__integer)
valueAreaHighLevel (series__integer)
valueAreaLowLevel (series__integer)
volumeRows (array__float)
priceLevelRows (array__float)
ltfSessionHighs (array__float)
ltfSessionLows (array__float)
ltfSessionVols (array__float)
lib_profileLibrary "lib_profile"
a library with functions to calculate a volume profile for either a set of candles within the current chart, or a single candle from its lower timeframe security data. All you need is to feed the
method delete(this)
deletes this bucket's plot from the chart
Namespace types: Bucket
Parameters:
this (Bucket)
method delete(this)
Namespace types: Profile
Parameters:
this (Profile)
method delete(this)
Namespace types: Bucket
Parameters:
this (Bucket )
method delete(this)
Namespace types: Profile
Parameters:
this (Profile )
method update(this, top, bottom, value, fraction)
updates this bucket's data
Namespace types: Bucket
Parameters:
this (Bucket)
top (float)
bottom (float)
value (float)
fraction (float)
method update(this, tops, bottoms, values)
update this Profile's data (recalculates the whole profile and applies the result to this object) TODO optimisation to calculate this incremental to improve performance in realtime on high resolution
Namespace types: Profile
Parameters:
this (Profile)
tops (float ) : array of range top/high values (either from ltf or chart candles using history() function
bottoms (float ) : array of range bottom/low values (either from ltf or chart candles using history() function
values (float ) : array of range volume/1 values (either from ltf or chart candles using history() function (1s can be used for analysing candles in bucket/price range over time)
method tostring(this)
allows debug print of a bucket
Namespace types: Bucket
Parameters:
this (Bucket)
method draw(this, start_t, start_i, end_t, end_i, args, line_color)
allows drawing a line in a Profile, representing this bucket and it's value + it's value's fraction of the Profile total value
Namespace types: Bucket
Parameters:
this (Bucket)
start_t (int) : the time x coordinate of the line's left end (depends on the Profile box)
start_i (int) : the bar_index x coordinate of the line's left end (depends on the Profile box)
end_t (int) : the time x coordinate of the line's right end (depends on the Profile box)
end_i (int) : the bar_index x coordinate of the line's right end (depends on the Profile box)
args (LineArgs type from robbatt/lib_plot_objects/24) : the default arguments for the line style
line_color (color) : the color override for POC/VAH/VAL lines
method draw(this, forced_width)
draw all components of this Profile (Box, Background, Bucket lines, POC/VAH/VAL overlay levels and labels)
Namespace types: Profile
Parameters:
this (Profile)
forced_width (int) : allows to force width of the Profile Box, overrides the ProfileArgs.default_size and ProfileArgs.extend arguments (default: na)
method init(this)
Namespace types: ProfileArgs
Parameters:
this (ProfileArgs)
method init(this)
Namespace types: Profile
Parameters:
this (Profile)
profile(tops, bottoms, values, resolution, vah_pc, val_pc, bucket_buffer)
split a chart/parent bar into 'resolution' sections, figure out in which section the most volume/time was spent, by analysing a given set of (intra)bars' top/bottom/volume values. Then return price center of the bin with the highest volume, essentially marking the point of control / highest volume (poc) in the chart/parent bar.
Parameters:
tops (float ) : array of range top/high values (either from ltf or chart candles using history() function
bottoms (float ) : array of range bottom/low values (either from ltf or chart candles using history() function
values (float ) : array of range volume/1 values (either from ltf or chart candles using history() function (1s can be used for analysing candles in bucket/price range over time)
resolution (int) : amount of buckets/price ranges to sort the candle data into (analyse how much volume / time was spent in a certain bucket/price range) (default: 25)
vah_pc (float) : a threshold percentage (of values' total) for the top end of the value area (default: 80)
val_pc (float) : a threshold percentage (of values' total) for the bottom end of the value area (default: 20)
bucket_buffer (Bucket ) : optional buffer of empty Buckets to fill, if omitted a new one is created and returned. The buffer length must match the resolution
Returns: poc (price level), vah (price level), val (price level), poc_index (idx in buckets), vah_index (idx in buckets), val_index (idx in buckets), buckets (filled buffer or new)
create_profile(start_idx, tops, bottoms, values, resolution, vah_pc, val_pc, args)
split a chart/parent bar into 'resolution' sections, figure out in which section the most volume/time was spent, by analysing a given set of (intra)bars' top/bottom/volume values. Then return price center of the bin with the highest volume, essentially marking the point of control / highest volume (poc) in the chart/parent bar.
Parameters:
start_idx (int) : the bar_index at which the Profile should start drawing
tops (float ) : array of range top/high values (either from ltf or chart candles using history() function
bottoms (float ) : array of range bottom/low values (either from ltf or chart candles using history() function
values (float ) : array of range volume/1 values (either from ltf or chart candles using history() function (1s can be used for analysing candles in bucket/price range over time)
resolution (int) : amount of buckets/price ranges to sort the candle data into (analyse how much volume / time was spent in a certain bucket/price range) (default: 25)
vah_pc (float) : a threshold percentage (of values' total) for the top end of the value area (default: 80)
val_pc (float) : a threshold percentage (of values' total) for the bottom end of the value area (default: 20)
args (ProfileArgs)
Returns: poc (price level), vah (price level), val (price level), poc_index (idx in buckets), vah_index (idx in buckets), val_index (idx in buckets), buckets (filled buffer or new)
history(src, len, offset)
allows fetching an array of values from the history series with offset from current candle
Parameters:
src (int)
len (int)
offset (int)
history(src, len, offset)
allows fetching an array of values from the history series with offset from current candle
Parameters:
src (float)
len (int)
offset (int)
history(src, len, offset)
allows fetching an array of values from the history series with offset from current candle
Parameters:
src (bool)
len (int)
offset (int)
history(src, len, offset)
allows fetching an array of values from the history series with offset from current candle
Parameters:
src (string)
len (int)
offset (int)
Bucket
Fields:
idx (series int) : the index of this Bucket within the Profile starting with 0 for the lowest Bucket at the bottom of the Profile
value (series float) : the value of this Bucket, can be volume or time, for using time pass and array of 1s to the update function
top (series float) : the top of this Bucket's price range (for calculation)
btm (series float) : the bottom of this Bucket's price range (for calculation)
center (series float) : the center of this Bucket's price range (for plotting)
fraction (series float) : the fraction this Bucket's value is compared to the total of the Profile
plot_bucket_line (Line type from robbatt/lib_plot_objects/24) : the line that resembles this bucket and it's valeu in the Profile
ProfileArgs
Fields:
show_poc (series bool) : whether to plot a POC line across the Profile Box (default: true)
show_profile (series bool) : whether to plot a line for each Bucket in the Profile Box, indicating the value per Bucket (Price range), e.g. volume that occured in a certain time and price range (default: false)
show_va (series bool) : whether to plot a VAH/VAL line across the Profile Box (default: false)
show_va_fill (series bool) : whether to fill the 'value' area between VAH/VAL line (default: false)
show_background (series bool) : whether to fill the Profile Box with a background color (default: false)
show_labels (series bool) : whether to add labels to the right end of the POC/VAH/VAL line (default: false)
show_price_levels (series bool) : whether add price values to the labels to the right end of the POC/VAH/VAL line (default: false)
extend (series bool) : whether extend the Profile Box to the current candle (default: false)
default_size (series int) : the default min. width of the Profile Box (default: 30)
args_poc_line (LineArgs type from robbatt/lib_plot_objects/24) : arguments for the poc line plot
args_va_line (LineArgs type from robbatt/lib_plot_objects/24) : arguments for the va line plot
args_poc_label (LabelArgs type from robbatt/lib_plot_objects/24) : arguments for the poc label plot
args_va_label (LabelArgs type from robbatt/lib_plot_objects/24) : arguments for the va label plot
args_profile_line (LineArgs type from robbatt/lib_plot_objects/24) : arguments for the Bucket line plots
args_profile_bg (BoxArgs type from robbatt/lib_plot_objects/24)
va_fill_color (series color) : color for the va area fill plot
Profile
Fields:
start (series int) : left x coordinate for the Profile Box
end (series int) : right x coordinate for the Profile Box
resolution (series int) : the amount of buckets/price ranges the Profile will dissect the data into
vah_threshold_pc (series float) : the percentage of the total data value to mark the upper threshold for the main value area
val_threshold_pc (series float) : the percentage of the total data value to mark the lower threshold for the main value area
args (ProfileArgs) : the style arguments for the Profile Box
h (series float) : the highest price of the data
l (series float) : the lowest price of the data
total (series float) : the total data value (e.g. volume of all candles, or just one each to analyse candle distribution over time)
buckets (Bucket ) : the Bucket objects holding the data for each price range bucket
poc_bucket_index (series int) : the Bucket index in buckets, that holds the poc Bucket
vah_bucket_index (series int) : the Bucket index in buckets, that holds the vah Bucket
val_bucket_index (series int) : the Bucket index in buckets, that holds the val Bucket
poc (series float) : the according price level marking the Point Of Control
vah (series float) : the according price level marking the Value Area High
val (series float) : the according price level marking the Value Area Low
plot_poc (Line type from robbatt/lib_plot_objects/24)
plot_vah (Line type from robbatt/lib_plot_objects/24)
plot_val (Line type from robbatt/lib_plot_objects/24)
plot_poc_label (Label type from robbatt/lib_plot_objects/24)
plot_vah_label (Label type from robbatt/lib_plot_objects/24)
plot_val_label (Label type from robbatt/lib_plot_objects/24)
plot_va_fill (LineFill type from robbatt/lib_plot_objects/24)
plot_profile_bg (Box type from robbatt/lib_plot_objects/24)
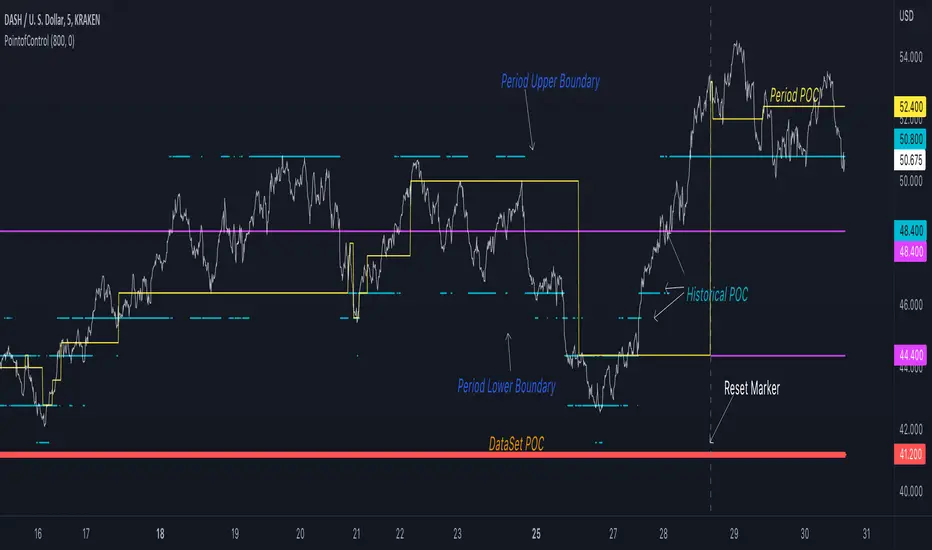
PointofControlLibrary "PointofControl"
POC_f()
The genesis of this project was to create a POC library that would be available to deliver volume profile information via pine to other scripts of indicators and strategies.
This is the indicator version of the library function.
A few things that would be unique with the built in
- it allows you to choose the kind of reset of the period, day/week or bars. This is simple enough to expand to other conditions
- it resets on bar count starting from the beginning of the data set (bar index =0) vs bars back from the end of the data set
- A 'period' in this context is the time between resets - the start of the POC until it resets (for example at the beginning of a new day or week)
- it will calculate an increment level rather than the user specifying ticks or price brackets
- it does not allow for setting the # of rows and then calculating the implied price levels
- When a period is complete it is often useful to look back at the POCs of historical periods, or extend them forward.
- This script will find the historical POCs around the current price and display them rather than extend all the historical POC lines to the right
- This script also looks across all the period POCs and identifies the master POC or what I call the Grand POC, and also the next 3 runner up POCs
There is a matching indicator to this library