ZScore SemiConductoresZ-Score of Semiconductor Sector Volume
This custom Pine Script indicator applies a Z-Score calculation to the aggregated trading volume of leading semiconductor companies. The goal is to highlight statistical extremes in sector activity that may signal unusual market behavior.
🔧 How it works
- Fixed ticker list: NVDA, AVGO, TSM, AMD, ASML, MU, ARM, ON, TXN, QCOM, INTC.
- Aggregate volume: The script sums the trading volume of all tickers in the list for the selected timeframe.
- Z-Score calculation:
- Moving average and standard deviation are computed over a configurable window (default = 50 bars).
- Formula:
Z= (Current Volume - Mean) / Standard Deviation
Visualization:
- Z-Score plotted in green.
- Reference lines at 0, ±1σ, ±2σ.
- Labels (triangles) mark critical signals when Z > +2 or Z < -2.
📈 Why it matters
- Detects abnormal surges or drops in sector-wide volume.
- Highlights potential euphoria (+2σ) or panic (-2σ) moments.
- Useful as a filter for trading strategies or as a sector-level alert system.
⚠️ Disclaimer: This script is for educational purposes only and not financial advice
Volumen

Institutional Edge Pro v1.0 - 9.3/10 ConfidenceEducational 5-layer confirmation system combining institutional order flow concepts, trend analysis, and risk management principles. Features Order Block detection, adaptive stop losses (EMA 9x21), and probability scoring. For educational purposes only.
## ⚡ KEY FEATURES
### 🔍 5-Layer Confirmation System
- **Layer 0:** Market Regime Detection (30% weight) - ADX, Choppiness Index, Volatility, Volume
- **Layer 1:** Golden/Death Cross Trend Filter (20% weight) - EMA 50/200 with gradient confirmation
- **Layer 1.5:** Fast Death Cross Stop Loss - EMA 9/21 dynamic exits
- **Layer 2:** Smart Order Block Detection (20% weight) - Institutional footprint tracking
- **Layer 3:** Probabilistic Confirmations (20% weight) - RSI, MACD, Volume, Structure, Volatility
- **Layer 4:** Dynamic Risk Management (10% weight) - ATR-based adaptive stops
### 📊 Visual Dashboard
- **Regime Score:** 0-100 market health indicator
- **Trend Status:** Real-time BULL/BEAR/NONE classification
- **Trend Quality:** Freshness metric (degrades over time)
- **Order Block Status:** Active OB tracking with validation
- **Probability Scores:** Live Long/Short setup probabilities

ICT HTF Volume Candles (Based on HTF Candles by Fadi)# ICT HTF Volume Candles - Multi-Timeframe Volume Analysis
## Overview
This indicator provides multi-timeframe volume visualization designed to complement price action analysis. It displays volume data from up to 6 higher timeframes simultaneously in a separate panel, allowing traders to identify volume spikes, divergences, and institutional activity without switching between timeframes.
**Original Concept Credits:** This indicator builds upon the HTF Candles framework by Fadi, adapting it specifically for volume analysis with enhanced features including gap-filling for extended hours, multiple scaling methods, and advanced synchronization.
## What Makes This Script Original
### Key Innovations:
1. **Three Volume Scaling Methods:**
- **Per-HTF Auto Scale:** Each timeframe scales independently for detailed comparison
- **Global Auto Scale:** All timeframes use unified scale for relative volume comparison
- **Manual Scale:** User-defined maximum for consistent analysis across sessions
2. **Bullish/Bearish Volume Differentiation:**
- Volume bars colored based on price movement (close vs open)
- Separate styling for bullish (green) and bearish (red) volume periods
- Helps identify whether volume supports price direction
3. **Advanced Time Synchronization:**
- Custom daily candle open times (Midnight, 8:30 AM, 9:30 AM ET)
- Timezone-aware calculations for New York trading hours
- Real-time countdown timers for each timeframe
- **Gap-filling technology** for continuous display during extended hours and weekends
4. **Flexible Display Options:**
- Configurable spacing and positioning
- Label placement (top, bottom, or both)
- Day-of-week or time interval labels on candles
- Works reliably in backtesting and live trading
## How It Works
### Volume Calculation
The indicator uses `request.security()` with optimized parameters to fetch volume data from higher timeframes:
- **Volume Open/High/Low/Close (OHLC):** Tracks volume changes within each HTF candle
- **Color Logic:** Compares HTF close vs open prices to determine bullish/bearish classification
- **Alignment:** All volume bars share a common baseline for easy visual comparison
- **Gap Handling:** Uses `gaps=barmerge.gaps_off` to maintain continuity during non-trading hours
### Technical Implementation
```
1. Monitors HTF timeframe changes using request.security() with lookahead
2. Creates new VolumeCandle object when HTF bar opens
3. Updates current candle's volume H/L/C on each chart bar
4. Applies selected scaling method to normalize display height
5. Repositions all candles and labels on each bar update
6. Fills gaps automatically during extended hours for consistent display
```
### Scaling Methods Explained
**Method 1 - Auto Scale per HTF:**
Each timeframe displays volume relative to its own maximum. Best for identifying patterns within each individual timeframe.
**Method 2 - Global Auto Scale:**
All timeframes share the same scale based on the highest volume across all HTFs. Best for comparing relative volume strength between timeframes.
**Method 3 - Manual Scale:**
User sets maximum volume value. Best for maintaining consistent scale across different trading sessions or instruments.
## How to Use This Indicator
### Setup
1. Add indicator to your chart (it appears in a separate panel below price)
2. Configure up to 6 higher timeframes (default: 5m, 15m, 1H, 4H, 1D, 1W)
3. Set number of candles to display for each timeframe
4. Choose volume scaling method based on your analysis needs
5. Enable "Fix gaps in non-trading hours" for extended hours trading (enabled by default)
### Interpretation
**Volume Spikes:**
- Sudden increase in volume height indicates institutional activity or strong conviction
- Compare volume between timeframes to identify where the real money is moving
- Look for volume spikes that appear across multiple timeframes simultaneously
**Bullish vs Bearish Volume:**
- **Green volume bars:** Price closed higher (buying pressure)
- **Red volume bars:** Price closed lower (selling pressure)
- High green volume during uptrend = confirmation of strength
- High red volume during downtrend = confirmation of weakness
- High volume opposite to trend = potential reversal warning
**Multi-Timeframe Context:**
- **5m/15m:** Scalping and day trading activity
- **1H/4H:** Swing trading and intraday institutional flows
- **Daily/Weekly:** Major position building and long-term trends
**Divergences:**
- Price making new highs but volume declining = weakening trend
- Volume increasing while price consolidates = potential breakout brewing
- Price breaks level but volume doesn't confirm = likely false breakout
### Practical Examples
**Example 1 - Institutional Confirmation:**
Price breaks above resistance. Check volume across timeframes:
- 5m shows spike = retail interest
- 15m + 1H + 4H all show spikes = institutional confirmation
- **Trade confidence: HIGH**
**Example 2 - False Breakout Detection:**
Price breaks resistance with:
- High volume on 5m only
- Normal/low volume on 1H and 4H
- **Interpretation:** Likely retail trap, institutions not participating
- **Action:** Wait for pullback or avoid
**Example 3 - Accumulation Phase:**
Price ranges sideways but:
- Daily volume gradually increasing
- Weekly volume above average
- **Interpretation:** Smart money accumulating
- **Action:** Prepare for breakout in direction of volume
**Example 4 - Volume Divergence:**
Price makes new high:
- Current high has lower volume than previous high across all timeframes
- **Interpretation:** Weakening momentum
- **Action:** Consider profit-taking or reversal trade
## Configuration Parameters
### Timeframe Settings
- **HTF 1-6:** Select timeframes (must be higher than chart timeframe)
- **Max Display:** Number of candles to show per timeframe (1-50)
- **Limit to Next HTFs:** Display only first N enabled timeframes (1-6)
### Styling
- **Bull/Bear Colors:** Separate colors for body, border, and wick
- **Padding from current candles:** Distance offset from live price action
- **Space between candles:** Gap between individual volume bars
- **Space between Higher Timeframes:** Gap between different timeframe groups
- **Candle Width:** Thickness of volume bars (1-4, multiplied by 2)
### Volume Settings
- **Volume Scale Method:** Choose 1, 2, or 3
- 1 = Auto Scale per HTF (each TF independent)
- 2 = Global Auto Scale (all TF unified)
- 3 = Manual Scale (user-defined max)
- **Auto Scale Volume:** Enable/disable automatic scaling
- **Manual Scale Max Volume:** Set maximum when using Method 3
### Label Settings
- **HTF Label:** Show/hide timeframe names with color and size options
- **Label Positions:** Display at Top, Bottom, or Both
- **Label Alignment:** Align centered or Follow Candles
- **Remaining Time:** Show countdown timer until next HTF candle
- **Interval Value:** Display day-of-week or time on each candle
### Custom Daily Candle
- **Enable Custom Daily:** Override default daily candle timing
- **Open Time Options:**
- **Midnight:** Standard 00:00 ET daily open
- **8:30 AM:** Align with economic data releases
- **9:30 AM:** Align with NYSE market open
- Useful for specific trading strategies or market alignment
### Advanced Settings
- **Fix gaps in non-trading hours:** Maintains alignment during extended hours and weekends (recommended: ON)
- Prevents visual gaps during forex weekend closures
- Ensures consistent display during crypto 24/7 trading
- Improves backtesting reliability
## Best Practices
1. **Pair with Price Action:** Use alongside HTF price candles indicator for complete picture
2. **Start Simple:** Enable 2-3 timeframes initially (e.g., 15m, 1H, 4H), add more as needed
3. **Match Settings:** Use same candle width/spacing as companion price indicator for visual alignment
4. **Scale Appropriately:**
- Use **Global scale** (Method 2) when comparing timeframes
- Use **Per-HTF scale** (Method 1) for pattern analysis within each timeframe
- Use **Manual scale** (Method 3) for consistent day-to-day comparison
5. **Watch for Volume Clusters:** High volume appearing simultaneously across multiple HTFs signals significant market events
6. **Confirm Breakouts:** Always check if volume supports the price movement across higher timeframes
7. **Extended Hours:** Keep "Fix gaps" enabled for 24/7 markets (Forex, Crypto) and weekend analysis
## Technical Notes
- **Timezone:** All calculations use America/New_York timezone for consistency
- **Real-time Updates:** Volume and timers update on each tick during market hours
- **Performance:** Optimized with max_bars_back=5000 for extensive historical analysis
- **Compatibility:** Works on all instruments with volume data (Stocks, Forex, Crypto, Futures)
- **Gap Handling:** Uses `barmerge.gaps_off` to fill data gaps during non-trading periods
- **Backtesting:** Uses `lookahead=barmerge.lookahead_on` for stable historical data without repainting
- **Data Continuity:** Automatically handles market closures, weekends, and extended hours
## Updates & Improvements
**Version 2.0 (Current):**
- ✅ Fixed alignment issues during extended hours and weekends
- ✅ Eliminated repainting in backtesting
- ✅ Added gap-filling technology for continuous display
- ✅ Improved data synchronization across all timeframes
- ✅ Enhanced NA value handling for data integrity
- ✅ Added advanced settings group for user control
## Support
For questions, suggestions, or feedback, please comment on the publication or message the author.
---
**Disclaimer:** This indicator is for educational and informational purposes only. It does not constitute financial advice. Past performance is not indicative of future results. Always perform your own analysis and implement proper risk management before making trading decisions.

DEVEL Volume Intention 0.0.2Indicator that detects the price intention based on the volume of the last 20 candles. Highlighting a candle if the volume is significantly greater than the average and plotting a rectangle if so.

Volume by NaughtyReal Volume Colored Bars
The indicator displays real volume as a histogram. Bullish bars (closing price higher than the previous one) are green, bearish bars (closing price lower) are red, and bars with volume lower than the two previous bars are pink. The default color is gray. Perfect for analyzing market volume dynamics.

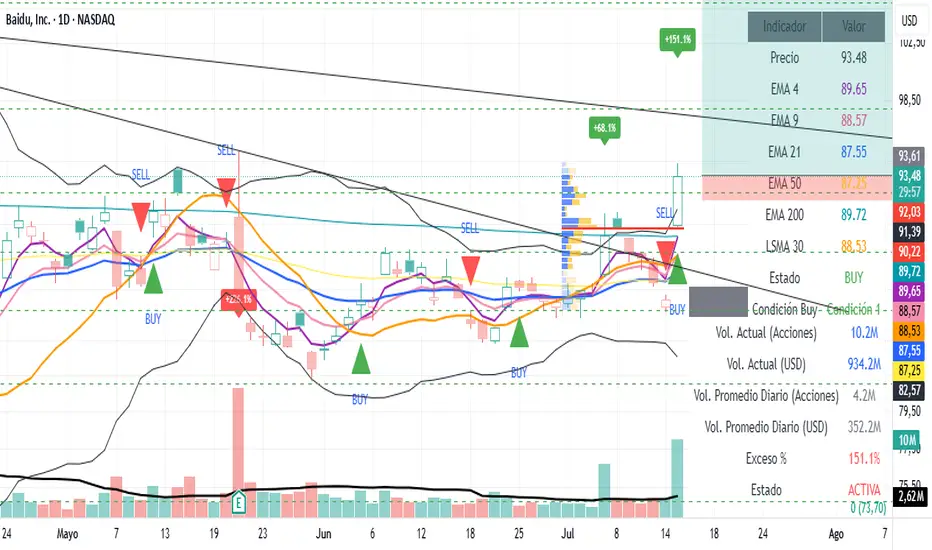
Volume Spike AlertIndicator Features:
📊 Core Functionalities:
Exceptional Volume Detection:
Calculates volume in USD (volume × price)
Compares it against a 90-day average (3 months)
Configurable from 1 to 252 days
Visual Signals:
Green labels for bullish candles with high volume
Red labels for bearish candles with high volume
Displays excess percentage (e.g., +45.2%)
Dual Alert System:
AlertCondition: For manual alert configuration in TradingView
Alert(): Automated alerts with detailed information
⚙️ Available Settings:
Average Period: 1–252 days (default: 90 days)
Enable/Disable Alerts: Configurable checkbox
Show/Hide Labels: Visual control
Label Size: Tiny, Small, Normal, Large
Minimum Threshold: Minimum percentage required to trigger a signal
📋 Displayed Information:
On Labels:
Excess percentage (e.g., +67.3%)
Color based on candle direction
In the Table:
Current volume in millions USD
Average volume in millions USD
Excess percentage
Alert status (ACTIVE/NORMAL)
Calculation period
In Alerts:
Candle type (BULLISH 🟢 / BEARISH 🔴)
Symbol and current price
Current volume vs. average
Timeframe used
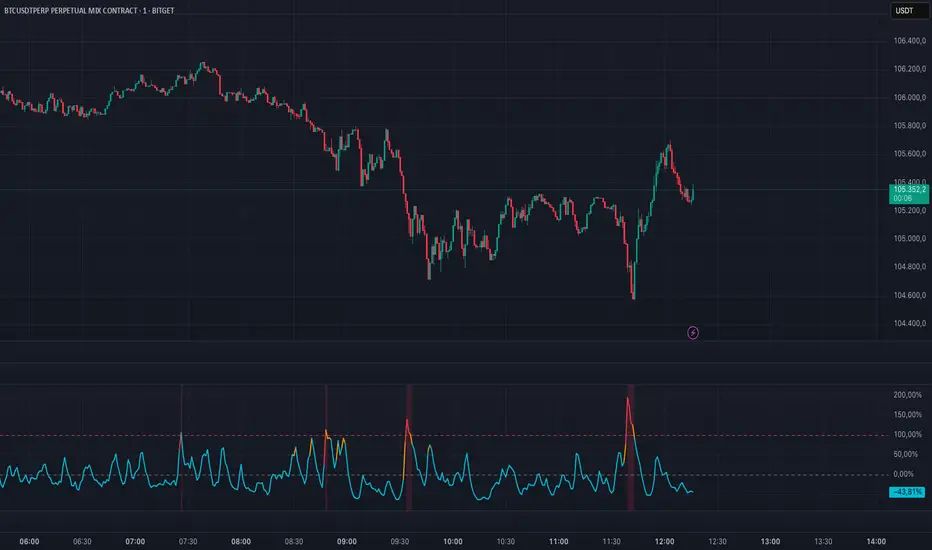
Volume Oscillator Pro – Spike Visualizer{NJ}📊 **Volume Oscillator Pro – Spike Visualizer (NJ)**
An enhanced volume oscillator for scalpers, day traders, and momentum traders.
This indicator visually highlights significant volume surges to help identify real market strength.
---
🔍 **Features:**
– Dynamic color changes based on volume pressure
– Warning zone starts at 70% (orange), confirmed spike at 100% (red)
– Horizontal spike line at 100% for clear reference
– Optional background color for extreme volume breakouts
---
⚙️ **Recommended Use:**
– Use on **1–5 minute charts** for scalping and fast momentum entries
– Combine with **price structure or candle pattern setups**
– Spikes above 100% often indicate large player entries or exits
– Helps you distinguish real movement from market noise
---
🧪 **Suggested Settings:**
– Short Length: `5`
– Long Length: `10`
– Spike Threshold: fixed at 100% (can be adjusted)
---
Created by **Nasir Jebri**
Modified Volume IndicatorThis indicator colors volume bars based on price and range conditions for a given period:
Green Bars:
The close is at least 70% of the way up the daily range (from the low).
The close is also 1% or more above the low.
Red Bars:
The close is at least 70% of the way down the daily range (from the high).
The close is also 1% or more below the high.
Gray Bars:
Volume bars that don’t meet the above conditions are neutral.
Purpose
Green Bars highlight strong upward closes.
Red Bars indicate weak downward closes.
Gray Bars show neutral or inconclusive price movement.
This indicator helps traders identify momentum shifts and trend strength in real-time.
Energy ScriptEnergy Script Indicator
Description of Indicator
The Energy Script Indicator calculates the market's energy using the formula `Energy = Price * sqrt(Volume)`; providing insight into market activity by combining price movement and volume. This indicator is designed to help traders identify potential reversals and continuation points based on energy levels.
Features
Energy Calculation: Utilizes price and volume to compute market energy, highlighting significant activity changes.
Smoothing Options: Two customizable smoothing periods to filter out noise and highlight trends.
Threshold Alert: Set a threshold value to receive alerts when energy exceeds predefined levels, aiding in quick decision-making.
Customizable Colors: Choose colors for different plot lines to suit your charting preferences.
How to Use:
1. Smoothing Periods: Adjust `Smoothing 1` and `Smoothing 2` to control the sensitivity of the energy plots.
2. Threshold: Set the `Threshold` value to identify significant energy levels. Enable or disable threshold plotting as needed.
3. Volume Integration: Toggle `Use Volume` to include or exclude volume in energy calculations.
4. Alerts: Receive alerts when energy levels cross the defined threshold, signaling potential market movements.
This indicator is a powerful tool for analyzing market dynamics by combining price action with volume, providing a deeper understanding of market energy and potential trading opportunities.

Volatility_ZigZag_LibraryThis is a Pine Script library for the public indicator "Volatility ZigZag" by brettkind. For further description, please refer to the information available on the original indicator page.
Library "Volatility_ZigZag_Library"
getValues_andStyling_VolatilityZigZag_byBrettkind(hl_src, SOURCE, length, min_dev_input, stdev_fctr, ZigZag, zz_color, zz_width, zz_devline, zz_points, zz_alert_sign, ZZ_Label, ZZ_Label_clr, rev_text, zz_bars_text, pcabs_text, avg_pcabs_text, pcrel_text, avg_pcrel_text, vol_text, avg_vol_text, input_currency)
Parameters:
hl_src (bool)
SOURCE (float)
length (int)
min_dev_input (float)
stdev_fctr (float)
ZigZag (bool)
zz_color (color)
zz_width (int)
zz_devline (bool)
zz_points (bool)
zz_alert_sign (bool)
ZZ_Label (bool)
ZZ_Label_clr (color)
rev_text (bool)
zz_bars_text (bool)
pcabs_text (bool)
avg_pcabs_text (bool)
pcrel_text (bool)
avg_pcrel_text (bool)
vol_text (bool)
avg_vol_text (bool)
input_currency (string)
getStatisticTable_VolatilityZigZag_byBrettkind(x1, Y1_array, draw_tbl)
Parameters:
x1 (int)
Y1_array (array)
draw_tbl (bool)
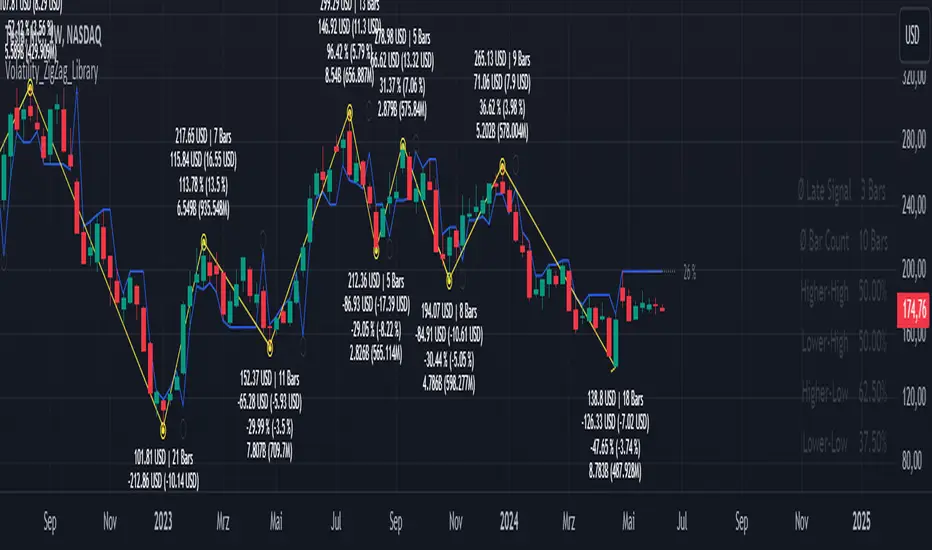
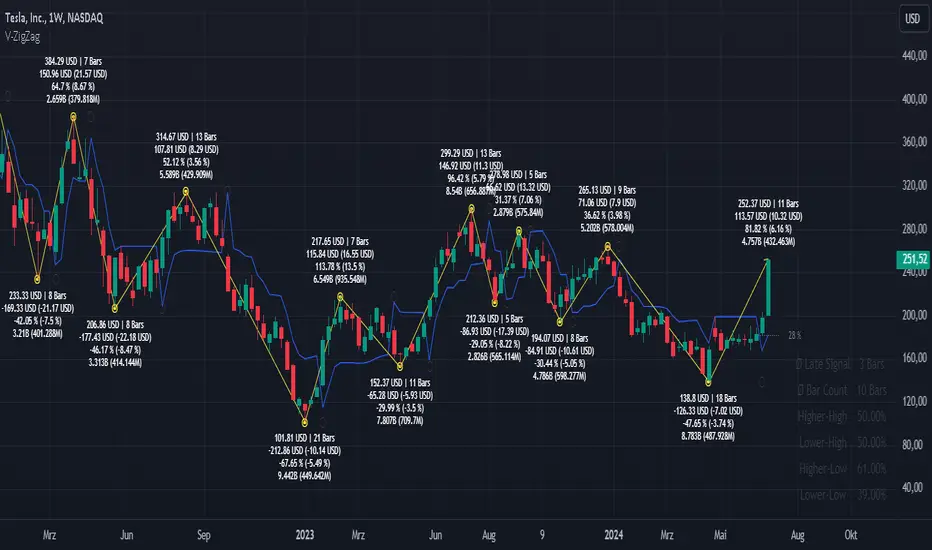
Volatility ZigZagIt calculates and plots zigzag lines based on volatility and price movements. It has various inputs for customization, allowing you to adjust parameters like source data, length, deviation, line styling, and labeling options.
The indicator identifies pivot points in the price movement, drawing lines between these pivots based on the deviation from certain price levels or volatility measures.
The script labels various data points at the ZigZag pivot points on the chart. These labels provide information about different aspects of the price movement and volume around these pivot points. Here's a breakdown of what gets labeled:
Price Change: Indicates the absolute and average percentage change between the two pivot points. It displays the absolute or relative change in price as a percentage. Additionally, the average absolute price increase or the average rate of increase can also be labeled.
Volume: Shows the total volume and average volume between the two pivot points.
Number of Bars: Indicates the number of bars between the current and the last pivot point.
Reversal Price: Displays the price of the reversal point (the previous pivot).
Volume peak based zonesThis is a simple but effective indicator based on simple volume.
What does this indicator for you:
Zones are drawn on the basis of volume peaks. It is used for this purpose the closing price to the high or to the low depending on the direction of the candle.
How can this be used:
With volume peaks one assumes that a movement has reached your end for the time being or a new movement is initiated.
This cannot be verified by simple volume alone.
If a zone is displayed is now to pay attention to the following:
Narrow zone: indicate when creating mostly a continuation of the trend. Can later, however, be used as support or resistance.
Medium zones: The price is in an accumulation phase. Here is crucial, whether a candle with increased volume (preferably above the volume SMA) arises and the high or the low of the zone by closing price leaves. Accordingly, a short or long position can be taken. As SL, the high or low of the zone or the candle itself can be used.
Large zones: The high and low of the zone indicate a range in which the price will stay in the near future. The low or the high can be used as a once if the price does not leave the zone despite high volume at the close.
Otherwise, this can be interpreted as a breakout.
Principles of Volume:
Rising Volume at Rising Price = Intact Trend
Rising Volume at Falling Price = Intact Trend
Falling volume at rising price = correction movement
Falling volume at falling price = correction movement
Have Funn!!

Awesome Cumulative Volume OscillatorThe indicator is called the "Awesome Cumulative Volume Oscillator" (ACVO), which analyzes the cumulative trading volume of the underlying asset.
The indicator also plots the deviation of the cumulative trading volume from the first SMA value, which is referred to as the "Cumulative Volume Deviation". The zero-line is plotted as a reference point.
If the "Cumulative Volume Deviation" is greater than 0, it indicates an uptrend, as the cumulative trading volume is above the first SMA value. If the "Cumulative Volume Deviation" is less than 0, it indicates a downtrend, as the cumulative trading volume is below the first SMA value.
However, it is important to note that using a single indicator is not sufficient to conduct a comprehensive market analysis. It is necessary to combine multiple indicators and analysis methods to make informed trading decisions.

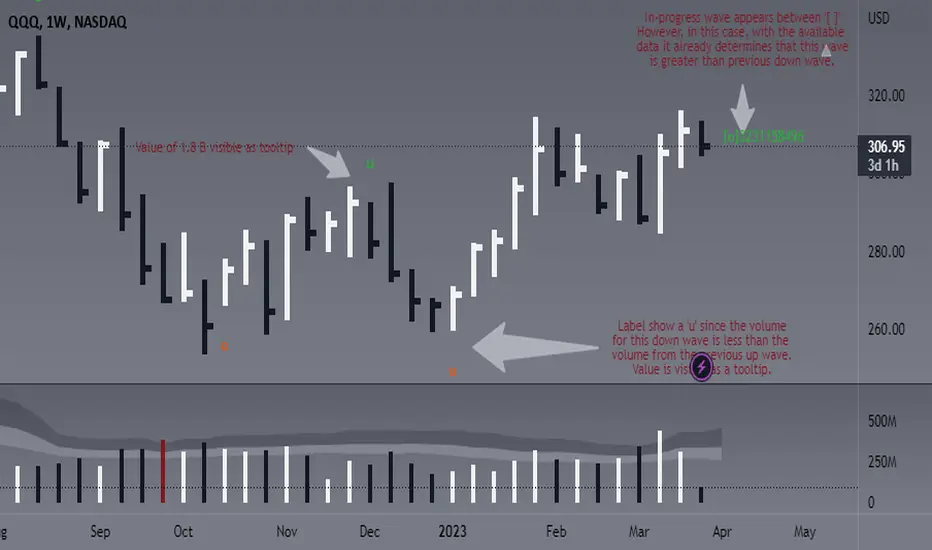
Weis Wave Volume - Simple labels and comparisonThis script is designed to identify and display the Weis Wave Volume on a chart. The Weis Wave Volume is a volume-based indicator that helps traders analyze market waves, identify trend reversals, and assess the strength of a trend. The script calculates wave volume based on user-defined input parameters, detects price waves, and displays the results as labels on the chart.
This version in particular is based on ideas from @the_MarketWhisperer and some other pieces of the script from @LucF.
The overall functionality of the script is to identify price waves and their corresponding volume. It does this by determining the trend direction and detecting trend reversals based on user-defined inputs such as the Trend reversal length and Price source for trend detection. The script also calculates and displays the cumulative volume of the current wave, the number of bars in the wave, the average volume in the wave, and consecutive increasing average volume bars in the same wave:
- An 'o' is printed to show that the volume of the current wave was 'O'ver/ above the count of the volume from preceding wave (regardless of it being up or down).
- An 'u' is printed to show that the volume of the current wave was 'U'nder/ below the count of the volume from preceding wave (regardless of it being up or down).
- Current wave will be between ' ' signaling that the wave is not confirmed yet.
- Actual values for the wave are available as tooltips. You decide how many bars to show the labels for, but for now and since I am a fan of clean charts, this is set to 50.
The user can adjust various inputs that affect the output of the script, such as Trend reversal length, Price source for trend detection, Labels for X last bars. Adjusting these inputs allows the trader to customize the script's behavior to better suit their trading style or specific market conditions. For example, by increasing the Trend reversal length, the script will require more consecutive bars in the opposite direction to confirm a trend reversal, potentially filtering out shorter-term price fluctuations. Similarly, adjusting the Price source for trend detection allows the user to base trend calculations on different price values, such as the high, low, or close of each bar.
In addition to the customizable inputs, the user can enable or disable the display of pivot markers and choose the colors for the up and down volume labels. This helps the trader to easily visualize and analyze the wave volume information on the chart.
In summary, this script offers traders a powerful tool for visualizing and analyzing the Weis Wave Volume on a chart. By identifying price waves, detecting trend reversals, and providing insights into the strength of a trend based on volume, the script can be a valuable addition to a trader's technical analysis toolbox. Please note this is not meant to provide any buy or sell signals, it should be rather used to complement your existing analysis.
Have fun and trade wisely ;)
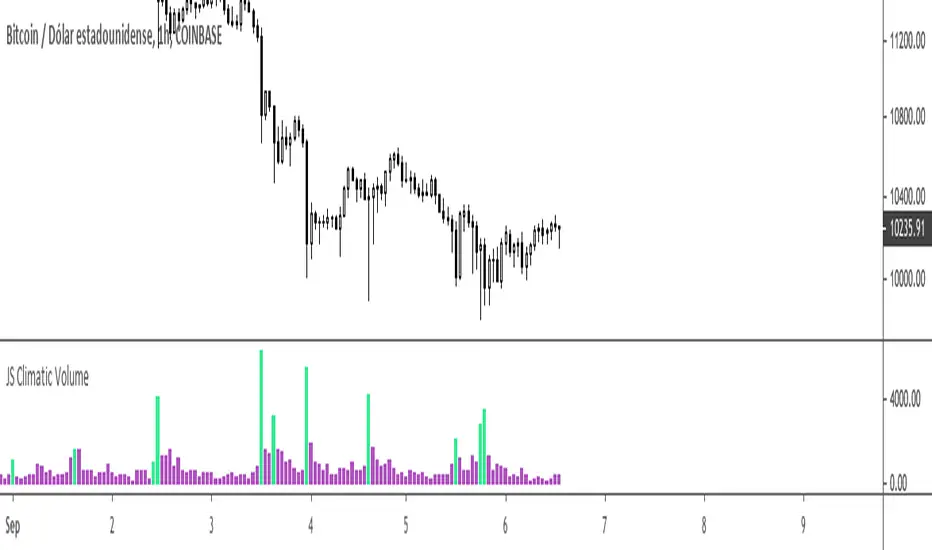
Climatic Volume Study (CVS) [JoseMetal]============
ENGLISH
============
- Description:
This indicator is similar to my previous volume indicator called "ADVO" (check my profile!), which determines accumulative and distributive volume (buy/sell, bullish/bearish candles), but instead of using ALL the volume it only uses CLIMATIC VOLUME candles filtered by SMA.
There's an option to ignore wicks (which is ENABLED by default), a big volume but small-doji candle doesn't tell too much.
- Visual:
1. Histogram: it shows bullish/bearish (aqua/yellow) climatic candles based on the volume SMA, when the volume of a bar exceeds the SMA. The bar shows up to +100% exceeding volume, more than that it shows a lime/red bar which is also wider.
2. Now we have 2 EMAs, one for accumulative climatic volume (blue) and other for distributive climatic volume (orange).
3. Differential EMA, the wider one, it takes different colors, green whenever the accumulative (blue) EMA is above the distributive one (orange), and red in the contrary case, this EMA is centered so the 50 point of the indicator is it's center, above 50 means accumulative/bullish (green) and below means distributive/bearish (red).
4. And to make all of this even more visual the background color has lime/red colors for crossovers on the EMAs (which is the same as the differential EMA color change), and whenever the accumulation/distribution continues we have a darker green/red color.
*As the indicator ONLY takes climatic volume candles, in some cases (i.e.: if you set the EMAs length too short) there may be a 0 result on the calculations, this plots the background in GRAY.
- Customization:
As usual in my indicators, everything is customizable, you can pick yours, settings, colors, figures etc.
- Usage and recommendations:
Default settings work good, smaller timeframes are usual a better idea to process volume indicators (like checking in 15 min what's happening under the curtain even if you're trading in 1-4H).
You can make the indicator more aggressive by reducing the SMA periods to 7, or more "situational" (check the current environment) to 25.
Same for the climatic volume EMAs, 15-25-50 are nice values., remember not to set it lower or there can be "neutral" areas with no result due to no climatic candled in range.
Enjoy!
============
ESPAÑOL
============
============
INGLÉS
============
- Descripción:
Este indicador es similar a mi anterior indicador de volumen llamado "ADVO" (¡revisa mi perfil!), que determina el volumen acumulativo y distributivo (velas de compra/venta, alcistas/bajistas), pero en lugar de utilizar TODO el volumen sólo utiliza velas de VOLUMEN CLIMÁTICO filtradas por SMA.
Hay una opción para ignorar las mechas (que está HABILITADA por defecto), una vela de gran volumen pero que se queda en una doji no nos dice demasiado.
- Visual:
1. Histograma: muestra velas climáticas alcistas/bajistas (cian/amarillo) basadas en la SMA de volumen, cuando el volumen de una barra supera la SMA. La barra muestra hasta un +100% de volumen excedente, más que eso muestra una barra de color lima/rojo que también es más ancha.
2. Ahora tenemos 2 EMAs, una para el volumen climático acumulativo (cian) y otra para el volumen climático distributivo (naranja).
3. EMA diferencial, la más ancha, toma diferentes colores, verde siempre que la EMA acumulativa (cian) esté por encima de la distributiva (naranja), y rojo en el caso contrario, esta EMA está centrada por lo que el punto 50 del indicador es su centro, por encima de 50 significa acumulativa/alcista (verde) y por debajo significa distributiva/bajista (rojo).
4. Y para hacer todo esto aún más visual el color de fondo tiene colores lima/rojo para los cruces en las EMAs (que es lo mismo que el cambio de color de la EMA diferencial), y siempre que la acumulación/distribución continúa tenemos un color verde/rojo más oscuro.
*Como el indicador SOLO toma velas de volumen climático, en algunos casos (por ejemplo: si se pone la longitud de las EMAs demasiado corta) puede haber un resultado 0 en los cálculos, esto dibuja el fondo en GRIS.
- Personalización:
Como es habitual en mis indicadores, todo es personalizable, puedes elegir configuración, ajustes, colores, figuras, etc.
- Uso y recomendaciones:
La configuración por defecto funciona bien, las temporalidades más pequeñas son generalmente una mejor idea para procesar los indicadores de volumen (como comprobar en 15 min lo que está sucediendo bajo el telón, incluso si estás está operando en 1-4H).
Puedes hacer que el indicador sea más agresivo reduciendo los períodos de la SMA a 7, o más "situacional" (comprobar el entorno actual) a 25.
Lo mismo para las EMAs de volumen climático, 15-25-50 son buenos valores., recuerda no ponerlo más bajo o puede haber zonas "neutras" sin resultado debido a que no hay velas climáticas en el rango.
¡Que lo disfrutéis!

Volume Bull & BearHello Trader,
thanks to the new request.security_lower_tf()-function we are able to calculate intrabar volume. So here is my approach.
Please be aware, that the selected resolution should always be smaller than the selected chart timeframe.
You can find the exact values for bullish and bearish volume in the data window.
Hope it helps some of you :)

Vwap SalvatierraVwap Salvatierra. an indicator that must be accompanied by other volume indicators.
Benefits:
- Long term Vwap.
- Middle Std. deviations, Calculated automatically.
- Previous zones available.
How to use:
when the price is >= stdev+3, look for shorts till came back to vwap
whe the price is <= stdev-3, look for longs till came back to vwap
if the vwap cannot be broken, as resistance, after several attempts, then sell
if the vwap can't be broken, like support, after several tries, then buy.

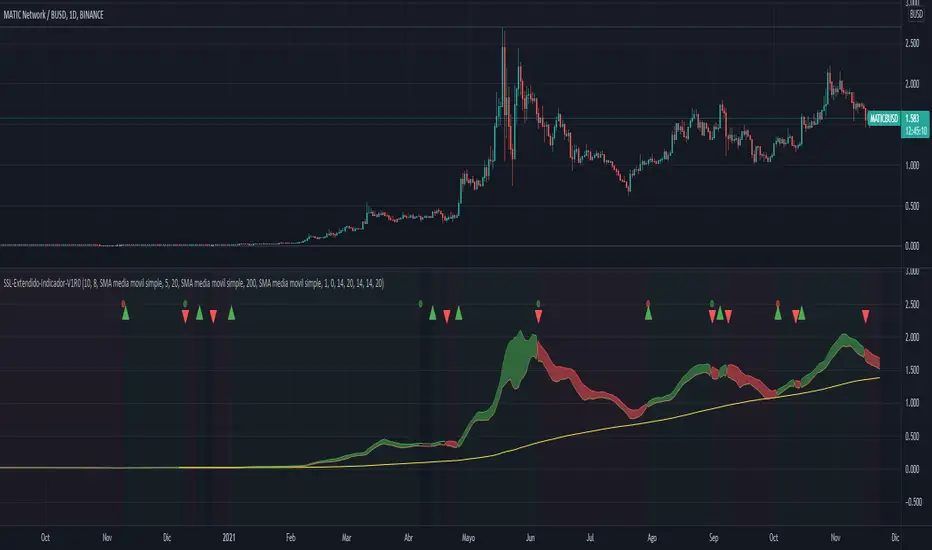
SSL-Extendido-Indicador Por NeilDESCRIPTION
SSL Indicator with ATR, Volume, ADX, TakeProfit, Profit Cycle Indicator and Extended Trend Control.
The component is based on moving averages, its effectiveness is greater in long periods: 4H, 1D, 1S
HOW DOES IT WORK
The component works with a fluctuation band in which the price moves, it consists of an upper moving average of 10 periods and a lower moving average of 8 periods, both configurable according to the volatility of the asset. Since the band has little width, prices trigger buy and sell alerts frequently, but the component has a trend control based on SMA, EMA, VWAP, HMA that allows to take advantage of the intermediate trend of the asset and cancel the early buy alerts and sale, maximizing the development of the parabola, additionally the component allows to confirm the entries with indicators such as: ATR (valatility), Volume and ADX (direction strength), this to achieve entries with a greater probability of success.
WHY USE IT
Its configuration is simple, it requires adjusting few parameters and although it is ideal for long-term operations, it allows periodic take profit, under the philosophy of profit evaluation at present point and not profit evaluation at future point, ensuring income in less time. additionally it has a visual profit indicator, which allows you to graphically see if a money generation cycle (buy or sell) is a winner or a loser, it also allows you to operate according to the general trend of the asset, that is, you can adjust the behavior of the resource to carry out purchase and sale operations or only purchase or only sale. This component not only graphically indicates when to take profit (takeProfit), but it is responsible for closing the current operation and opening a new operation in the same direction. This is the ideal resource for automated alert-based trading against platforms such as 3Commas.
HOW TO USE IT
Press the "Indicators" option, go to the "Public Library" segment, write the name "SSL-Extendido-Indicador por Neil", double-click on the record and it will be added to your work panel, now, all that remains is to configure its parameters and use it. By pressing the Reset Values Option, you will have a basic configuration that respects the fundamental concepts of trading and the use of multiple indicators in a single study.
--
DESCRIPCIÓN
Indicador SSL con ATR, Volume, ADX, TakeProfit, indicador de ciclo de ganancia y control de tendencia extendida.
El componente se basa en medias móviles, su efectividad es mayor en temporalidades largas: 4H,1D,1S
COMO FUNCIONA
El componente trabaja con una banda de fluctuación en la que se mueve el precio, consta de una media móvil superior de 10 periodos y una media móvil inferior de 8 periodos, ambas configurables según la volatilidad del activo. Dado que la banda tiene poca amplitud, los precios gatillan alertas de compra y venta frecuentemente, pero el componente posee un control de tendencia basado en SMA, EMA, VWAP, HMA que permite aprovechar la tendencia intermedia del activo y anular las alertas tempranas de compra y venta, maximizando el desarrollo de la parábola, adicionalmente el componente permite confirmar las entradas con indicadores como: ATR (volatilidad), Volumen y ADX (fuerza de la dirección), esto para lograr entradas con mayor probabilidad de éxito.
POR QUÉ USARLO
Su configuración es simple, requiere ajustar pocos parámetros y aunque es ideal para operaciones de temporalidad larga, permite efectuar take profit periódicos, bajo la filosofía de evaluación de ganancia a punto presente y no evaluación de ganancia a punto futuro, asegurando ingresos en menor tiempo, adicionalmente posee un indicador de ganancia visual, que permite ver gráficamente si un ciclo de generación de dinero (compra o venta) es ganador o perdedor, también permite operar según la tendencia general del activo, es decir que usted puede ajustar el comportamiento del recurso para efectuar operaciones de compra y venta o solo compra o solo venta. Este componente no solo indica gráficamente cuando tomar ganancias (takeProfit), sino que se encarga de cerrar la operación en curso y abrir una nueva operación en la misma dirección. Este es el recurso ideal para efectuar trading automatizado basado en alertas, contra plataformas como 3Commas.
COMO USARLO
Presione la opción "Indicadores", ubíquese en el segmento "Libreria Publica", escriba el nombre "SSL-Extendido-Indicador por Neil", haga doble clic sobre el registro y lo tendrá agregado en su panel de trabajo, ahora, solo resta configurar sus parámetros y usarlo. Presionando la opción Reestablecer Valores, ya tendrá una configuración básica que respeta los conceptos fundamentales del trading y el uso de múltiple de indicadores un un solo estudio.
SVA - Simple Volume Analyzer, by BlueJayBird [bjb] ENGLISH & SPANISH
------------------------------------- ENSLIGH
The idea was initially inspired in the concepts shared by @LazyBear on his indicator "Better Volume Indicator" (). But I found it somewhat complicated and dull. So I came up with this.
Concept:
It changes the color of volume bars based on surrounding volume changes.
Volume changes are plotted as volume MAs lines in the volume pane.
Whenever the volume is higher than these MAs, the bar changes color.
For this reason, the bar color change is RELATIVE TO the surroundings, because the color change depends on how far the MA has been extended due to sudden (or not) changes in the volume.
BAR COLORS:
Weak Green and Red: Low volume. The calm before or after the storm.
Normal Green and Red: Mid volume. Still low volume, you may get bored.
Yellow: High volume. Players are playing hard and harder.
White: Ultra-High Volume. The elephants stepped in.
NOTES:
SVA works better at lower timeframes. Though as far as I can tell, it works pretty well as far as 1D timeframe.
------------------------------------- SPANISH
La idea estuvo inicialmente inspirada en los conceptos expuestos por @LazyBear en su indicador "Better Volume Indicator" (). Pero lo encontré un poco complicado y falto de claridad. Así que me inventé este.
Conceptp:
Cambia el color de las barras basándose en los últimos cambios de volumen.
Los cambios de volumen son ploteados como lineas de medias móviles (MAs, es decir "Moving Averages") en la sección del volumen (chart pane).
En cualquier momento que el volumen es mayor que estos MAs, el color de las barras cambia.
Por esta razon, el cambio de color de las barras es RELATIVO a lo que está sucediendo alrededor, ya que el cambio de color depende de qué tan lejos el MA se haya extendido por causa de los últimos cambios (o no) de volumen.
BAR COLORS:
Verde y rojo apagados: Volumen bajo (Low Volume). La calma antes de la tormenta.
Verde y rojo normales: Volumen medio (Mid volume). Volumen todavía bajo. Es posible que te aburras.
Amarillo: Volumen alto (High Volume). Los jugadores están jugando duro.
Blanco: Volumen ultra-alto (Ultra-High Volume). Los elefantes entran a la cancha.
NOTAS:
SVA funciona mejor en temporalidades menores. Pero por lo que he visto, funciona bien hasta la temporalidad de 1D.

KINSKI Flexible Volume OscillatorThe Volume Oscillator is a trend-oriented indicator that shows the strength or weakness of price trends. This indicator calculates the volume from two moving averages (MA). The value of the slow volume MA is then subtracted from the value of the fast moving average. The Volume Oscillator measures volume by analyzing the relationship between these two moving averages.
The special feature of this indicator is that the type of moving average can be selected as the basis for calculation. Currently, it is possible to choose between the following MA variants:
"COVWMA", "DEMA", "EMA", "EHMA", "FRAMA", "HMA", "KAMA", "RMA", "SMA", "SMMA", "VIDYA", "VWMA", "WMA".
Upward and downward movements are represented in different colors. The following color variants are available:
Color green: Strong upward trend
Color green/dark: weakening upward trend
Color red: strong downward trend
Color red/dark: weakening downward trend
The colors, as well as the style can be adjusted in the settings according to your own needs.

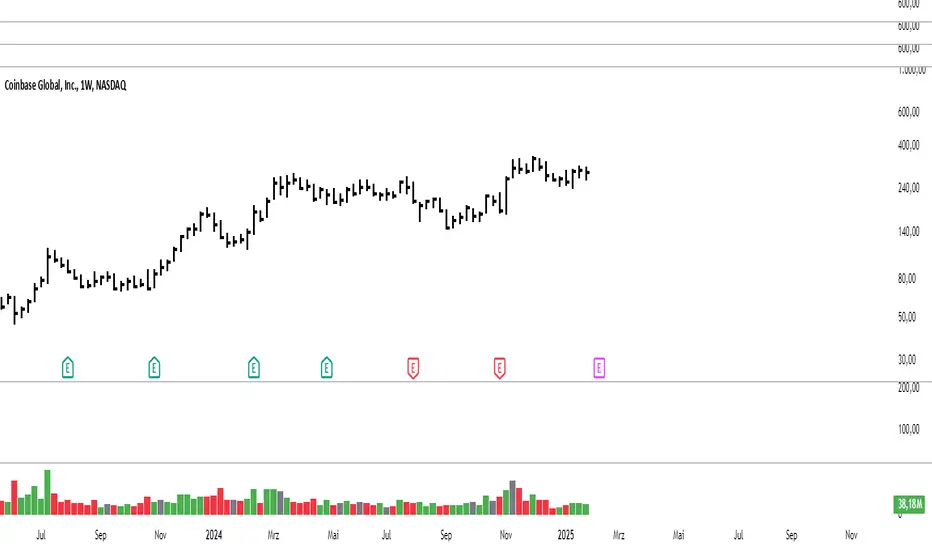
Climatic Volume indicator Buy/Sell ENGLISH
this indicator is contrarian and it's use in my strategy
Strategy: when price falls the graph show as two moments with panic during the downtrend: two candlesticks of panic
Both candlesticks are associating with two Volume climatic bars (when volumen double the average volume of last 10 bars). In that moment the institutions buy (remember, the institutions only buy during panic and sell in the euphoria moment because they generate a new trend in the market)
Buy Signal: Bear candlestick with climatic volume in downtrend (first institutions buying) + a few candlesticks more with low volume (lower than average volume of last 10 bars) + second candlestick climatic volume in downtrend (last institutions buying before the new trend)
Moving Stop Loss to break even or first sell of us: bull candlestick with climatic volume associated in uptrend (first take profit of institutions)
Sell Signal: Second bull candlestick with climatic volume associated in uptrend (in this moment the institutions take profit in the timeframe where we are operating and wait for a future new swing)
ESPAÑOL
El indicador es un indicador contratendencial
Estrategia: Cuando el precio cae el grafico nos muestra dos momentos de pánico durante la tendencia bajista: dos velas japonesas de panic
ambas velas japonesas están asociadas a dos barras de volumen climático (un volumen que supera en un 100% el volumen promedio de las ultimas 10 barras). En ese momento las instituciones compran (recuerden que las instituciones compran durante el pánico y venden durante la euforia porque ellos generan una nueva tendencia en el mercado)
Señal de compra: vela japonesa bajista con un volumen climático asociado en una tendencia bajista (primera compra de instituciones) + algunas velas japonesas con bajo volumen + una segunda vela japonesa con volumen climático en una tendencia bajista (la ultima compra de institucionales antes de la nueva tendencia)
Mover stop loss a precio de entrada o hacer nuestra primera venta: vela japonesa alcista con volumen climático asociado en una tendencia alcista (primera toma de ganancias de institucionales)
Señal de venta: Segunda vela japonesa con volumen climático asociado en una alcista (en ese momento las instituciones toman ganancias en el timeframe donde estamos operando y esperan un nuevo swing futuro)

Volume histogramThis volume indicator detects and paints with different colors up to 3 ranges of volume level necessary to identify the price zones where large investors act and trade with the price and volume's strategy.
It will be easier and faster for you to identify the important volume levels in order to apply them to your trades.
The greater difference and advantage over other existing volume indicators are the following:
Parameters may be adjusted to the quantity of candles which are necessary in order to calculate the average volume, and to the percentage which the high volume should be regarding the average volume for each candle.
It paints in 3 different colors: high volume, medium volume and low volume; the visual control is better with the size of the volume.
It is possible to set as many alerts as you need in order to let you know when the desired volume level is reached.
Este indicador de volumen detecta y pinta de color diferente hasta 3 rangos de nivel de volumen necesarios para identificar las zonas de precio donde actuan los grandes inversores y operar con la estrategia de precio y volumen.
Te será más fácil y rápido identificar los niveles importantes de volumen para aplicarlos a tus operaciones.
La gran diferencia y ventaja con respecto a otros indicadores de volumen existentes son tres.
Puedes ajustar los parámetros sobre qué cantidad de velas tiene en cuenta para calcular el volumen medio, y cuanto porcentaje debe ser el volumen alto con respecto al volumen medio para cada vela.
Te pinta en 3 colores diferentes el Volumen Alto, Volumen Medio y Volumen bajo, teniendo mejor control visual en el tamaño del volumen.
Puedes colocar tantas alertas como necesites para avisarte cuando llegue al nivel de volumen deseado.
Parameters Settings / Parámetros Ajustables:
Highest vs Average Vol Size (%) : Highest Volume Size vs Average Volume, default 200% / Tamaño del Volumen Alto con respecto al volumen Medio, en porcentaje. Por defecto, 200%
Vol Average Length : Candles Number to calculate Average Volume, default 500 / Cantidad de velas para calcular el Volumen Medio, por defecto 500.
Color Settings / Colores Ajustables:
Color 0 : Highest Volume, Above a % Average Volume
Color 1 : Above Average Volume
Color 2 : Below Average Volume

[JS] Climatic VolumeNot all the high volumes are important, this tool helps to identify the relevant market volumes
Can be useful to confirm a trend, a continuation or reversal