Absorption PROOF - Absorption PRO (Clean & Smart)Ultra-clean, high-precision absorption reversal strategy.Detects institutional buying/selling pressure using volume-weighted delta proxy and VWAP deviation zones.Smart RSI + early-session range filter automatically separates valid range-bound reversals from trend exhaustion.Green/Red circles → High-probability entries (fully tradable)
Small crosses + colored zones → Rejected signals (avoid)
Blue dotted lines → Session range ±100% deviation levels (optional)
By default: only signals and rejection zones displayed — zero clutter.Minimalist, professional, and deadly accurate on futures & forex (1m–15m).Less noise. Better trades.
Volume Profile

Volume weighted average price band strategy [Kevin-Patrick]VWAP Bands strategy, Credit
VWAP Machine Learning Bands is an advanced indicator designed to enhance trading analysis by integrating VWAP with a machine learning-inspired adaptive smoothing approach. This tool helps traders identify trend-based support and resistance zones, predict potential price movements, and generate dynamic trade signals.
Key Features
Adaptive ML VWAP Calculation: Uses a dynamically adjusted SMA-based VWAP model with volatility sensitivity for improved trend analysis.
Forecasting Mechanism: The 'Forecast' parameter shifts the ML output forward, providing predictive insights into potential price movements.
Volatility-Based Band Adjustments: The 'Sigma' parameter fine-tunes the impact of volatility on ML smoothing, adapting to market conditions.
Multi-Tier Standard Deviation Bands: Includes two levels of bands to define potential breakout or mean-reversion zones.
Dynamic Trend-Based Colouring: The VWAP and ML lines change colour based on their relative positions, visually indicating bullish and bearish conditions.
Custom Signal Detection Modes: Allows traders to choose between signals from Band 1, Band 2, or both, for more tailored trade setups.
+ Strategy setting by Kevin-Patrick

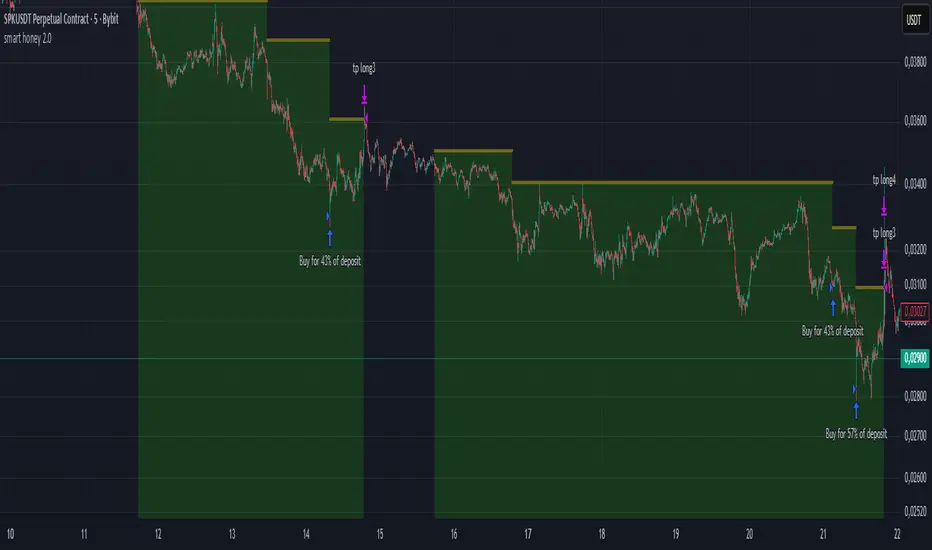
smart honey 2.0The smart honey 2.0 is a long-only trading strategy based on averaging entries.
At "Entry" you can set to enter a trade at a specified averaging level. The best backtest result at "only 4th averaging".
"Tp" is take profit.
"Sensitivity" controls the frequency of trades - lower sensitivity means fewer, but higher-quality trades.
Settings recommendations
For 1m-5m timeframes, use low sensitivity and take profit values. For higher timeframes, increase the take profit value.
For example, a profitable setting for many coins on a 5-minute timeframe is
Tp = 1.5%
Sensitivity = 2.7
Entry = only 4th averaging
The strategy features a "Blue line" showing liquidity clusters influenced by Sensitivity. Price often bounces off this line.
You can also set alerts for lists of coins, receiving notifications at each new candle about active positions
Volumemetrix Variance StrategyThe “Volumemetrix Variance Strategy” is an advanced Pine Script strategy designed to identify trade entries and exits using a combination of volume profile analysis, candle structure, and volatility filters. It constructs a dynamic volume profile over a specified lookback period to identify critical price levels such as the Point of Control (PoC), Value Area High (VAH), and Value Area Low (VAL). These levels represent zones of high trading activity that often act as support and resistance. The script smooths and adjusts these levels across different timeframes to align short-term market structure with higher-timeframe trends. It incorporates a variety of filters to exclude doji candles, detect continuation or rejection patterns, and confirm alignment with higher timeframe candle direction (e.g., 4-hour bullish or bearish bias).
Trade logic is built around detecting crossovers and breakouts relative to the PoC and value areas. The system can trigger entries based on several configurable behaviors: breakout, retake, bounce, reversal, or rejection near key volume zones. It supports flexible entry conditions for long, short, or both sides of the market, as well as a range of customizable settings for time-based trading restrictions, end-of-day position closures, and alert-based data capture. For execution, the script includes integrated risk management—users can specify take-profit and stop-loss levels, enable moving (trailing) stops, and even apply a “power curve” model to dynamically adjust trailing stops using exponential decay logic that adapts to price progress.
Overall, the Volumemetrix Variance Strategy is a hybrid between a quantitative volume-based strategy and a volatility-adaptive trade manager. It combines fixed range volume profiling with multi-timeframe confirmation, candle pattern validation, and adaptive exit logic. Its architecture allows for detailed trade automation, alert generation for external systems, and real-time control over parameters such as ATR scaling, entry delay, or bar confirmation. The result is a high-granularity framework for both backtesting and live execution that seeks to capture statistically favorable setups around liquidity concentration zones.

Yuri Garcia Smart Money Strategy FULL (COMPLIANT)Yuri Garcia Smart Money Strategy FULL (Slope Divergence)
This script is not a mashup of random indicators. It is an original, coherent strategy that blends multiple institutional-grade tools to form a unified Smart Money trading system. Each component contributes to precise trade filtering, context, and confirmation — no element is decorative or redundant.
🔍 Strategy Logic: How It Works
This strategy integrates the following tools, each with a clearly defined role:
1. Volume Cluster Zones (Orange bands)
Identifies strong buy/sell areas using the highest volume nodes over a rolling window. These act as dynamic points of control where Smart Money is likely active.
2. HTF Zones (4H) (Purple band)
Defines institutional zones by using the 20-bar high/low on the 4-hour chart. These set the outer bounds for valid entries, ensuring alignment with larger market structure.
3. Wick Pullback Filter (Orange circle 🔶)
Detects exhaustion or absorption near zones. Used to confirm genuine rejection after liquidity sweeps or traps.
4. Cumulative Delta Confirmation (Red square 🟥)
Analyzes whether buyers or sellers are dominant using delta volume. Trades only trigger when volume confirms the intended direction.
5. Slope-Based Delta Divergence (Optional)
Detects hidden reversals between price and delta. This prevents late entries and provides early insight into potential trap reversals.
6. Liquidity Grab Detection (Blue diamond 🔷)
Marks smart money stop hunts — temporary price breaks beyond highs/lows, followed by reversal. Used as a confluence tool.
7. ATR-Based Dynamic Risk Control
The strategy uses ATR to calculate SL/TP dynamically. This allows position sizing to adjust to volatility, reducing overexposure in high-momentum conditions.
🎯 Entry Criteria
All the following conditions must be met:
✅ Price is inside a Volume Cluster Zone
✅ Price is within the HTF Institutional Zone
✅ Wick Pullback confirms reaction
✅ Delta confirms strength of buyers/sellers
✅ (Optional) Slope-based divergence signals hidden shift
✅ (Optional) Liquidity grab occurs
Only then will the strategy trigger an entry.
📈 Visual Legend (Symbols on Chart)
Symbol Description
🟣 Purple Zone HTF Support/Resistance zone (4H context)
🟠 Orange Zone Volume cluster from top 3 volume nodes
🔶 Orange Circle Wick Pullback confirmation
🟥 Red Square Delta Confirmation
🔷 Blue Diamond Liquidity Grab indicator
🔵 Blue X Price is inside HTF Zone
🔻 Red Triangle SHORT entry signal
🔺 Green Triangle LONG entry signal
These visuals make it easier to read the chart intuitively while understanding each condition’s role.
⚙️ Strategy Settings Justification
Default Qty: 2% of equity (sustainable risk)
RRR: 2.0 (adaptive to volatility)
ATR Multiplier: 2.0 for SL/TP
Commission: 0.1% used
Slippage: 2 points for realism
Minimum Trades for Testing: Designed to generate over 100 trades under normal backtest conditions
Dataset: Supports BTC, GOLD, Forex, Indices with realistic volatility and volume
These settings reflect a realistic use case for average retail traders and avoid overfitting or unrealistic returns.
📌 How to Use
Apply on 15-minute or 1-hour timeframe.
Wait for full alignment of all entry conditions.
Confirm visually or use included alerts for manual or bot execution.
SL and TP are automatically handled.
🚫 Important Notes
This script is original, not a remix or mashup of unrelated indicators.
Each component was designed to work in harmony, enhancing trade quality and confidence.
No external scripts are required to function.
Alert messages are pre-formatted for both manual and webhook use.

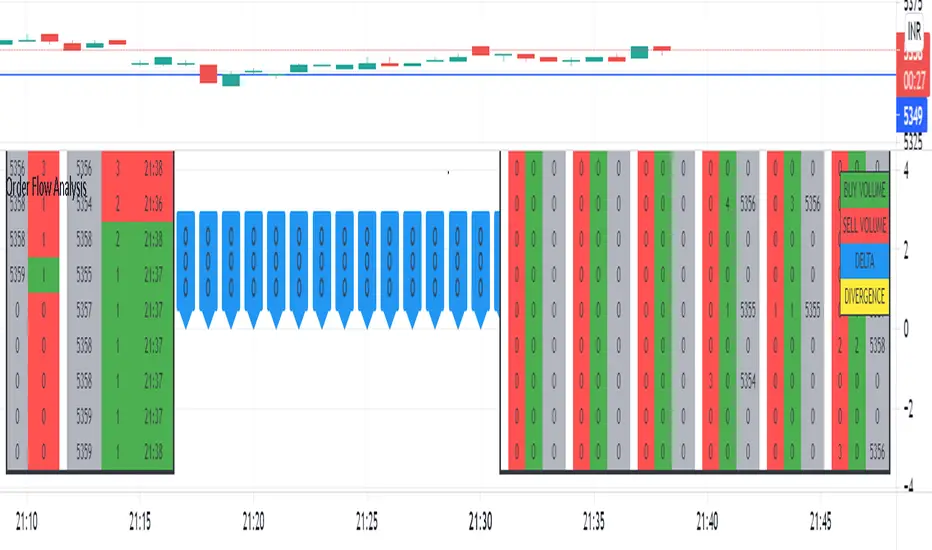
Order Flow Analysis - MultiThis version of Order Flow Analysis tracks delta for six symbols.
The first ticker is the same symbol as the chart. Other tickers, the number of delta bars, location, font sizes and colors can be configured in settings. This also identifies top tick volume and lists in each bar.
Please do not refresh the browser or else values may be reset. Also, ignore the first delta bar values.

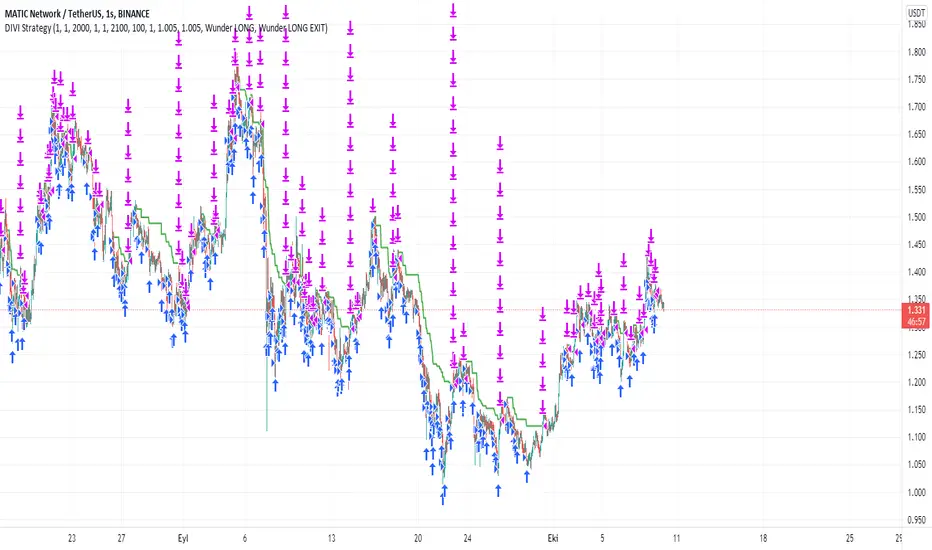
DIVI Wunder StrategyAs it is known, divergence is a situation we encounter very often on graphs. Various divergencies may occur according to many indicators. MACD divergence, RSI divergence... In the strategy I use only positive divergence. What is positive divergence I will explain on MACD positive divergence A MACD positive divergence is a situation in which the MACD does not reach a new low, despite the fact that the price of the stock reached a new low. This is seen as a bullish trading signal—hence, the term “positive divergence.” So I thought of these divergencies and came up with a new strategy. Combining the divergencies with the VOLPIN strategy I wrote earlier, a great strategy has emerged. When the divergence signals are came from MACD,RSI,CCI,OBV,Chaikin Money Flow, VWmacd and Money Flow Index all these indicators I sent a buy signal until the 40 times completed. ThenI sent to sell signal when the price come to take profit level. In this strategy, you divide your principal into as many parts as you want. For example, let's say that you have 1000 dollars of money and you make purchases by dividing this money into 40 equal parts in the default settings of the indicator. $25 per purchase. After each purchase is made as 25 dollars, you can adjust your profit rate from the profit taking settings. When you look at the results of the strategy, your profit rate will be very high. I usually use this strategy in one hour periods. Of course you change it whatever you want. Also change all settings from panel to get more profit. Have fun :)
Order Flow AnalysisThe script plots the order flow clusters for the last six candles in the middle right.
The cluster contains buy volume, sell volume and the price range of the volume.
It calculates uptick volume as buy volume and down tick volume as sell volume and calculates the delta(shown in labels). Recent ATR is considered to determine each cell price range in the cluster.
At the left side, the top volume ticks and the live ticks are displayed.
Please note this works only during market trading hours.
Do not refresh the browser tab and do not change the timeframe, which will cause a reset of numbers.