Historic Volume/Market ProfilesHistoric Volume/Market Profile is a Periodic Volume Profile with all of the improvements known in the original Volume/Market Profile.
VMP is a 2 in 1 Volume and Market Profile Indicator.
HVMP uses the base of VMP to offer a quick and simple view at multiple historic profiles at the same time.
This includes:
Cluster Identification for High Volume and Low Volume Areas.
Maximizing granularity by utilizing boxes and lines to get up to 1000 rows.
New Inclusions in HVMP vs VMP:
HVMP granularity is determined by the # of profiles on display. By doing this, each profile will get an even amount of allocated rows to use and granularity is scaled per-profile, to fit within the row allowance.
For Example: 1000/(# of profiles) = Maximum # of rows per profile.
HVMP introduces the "Auto-Scale" Option (on by Default), this automatically fits each profile within the defined timeframe period to provide a consistent display when switching timeframes.
Even with "Auto-Scale" enabled, "Display Size" dictates which direction the profile is displayed.
Below is a Negative Display Size (Displays from right to left, starting at the end of the period)
Below is a Positive Display Size (Displays from left to right, starting at the beginning of the period)
HVMP is only for historical data, you can get a live profile with the same Node Identification using VMP (Volume Market/Profile). The indicator that this one is based on.
Find it Here: Volume/Market Profile
Enjoy!
Volumeprofileindicator

Volume Profile Bar-Magnified Order Blocks [MyTradingCoder]Introducing "Volume Profile Bar-Magnified Order Blocks", an innovative and unique trading indicator designed to provide traders with a comprehensive understanding of market dynamics. This tool takes the concept of identifying order blocks on your chart and elevates it by integrating a detailed volume profile within each order block zone.
Unlike standard order block indicators, Volume Profile Bar-Magnified Order Blocks pulls data from lower timeframe bars and assigns it to various segments of the order block. By providing this volume profile inside the order block, the indicator supplies a deeper, multi-dimensional view of market activity that can enhance your trading decisions.
Crucially, users have the ability to fine-tune the detection of order blocks. This is made possible through a single input setting called "Tuning". This integer value allows you to control the significance and frequency of the order blocks. Higher numbers will produce more significant order blocks, though they will appear less frequently. Lower numbers, on the other hand, will yield less significant order blocks, but they will occur more often. This enables you to adjust the sensitivity of the indicator according to your specific trading strategy and style.
Key Settings:
Number of Segments: Customize the level of detail in your volume profile by selecting the number of segments you want inside each order block.
Tuning: Adjust the sensitivity of order block detection to align with your trading strategy. Higher values produce more significant but less frequent order blocks, while lower values yield less significant but more frequent order blocks.
Color Inputs: Personalize the look of your chart by selecting the colors for various elements of the indicator. This ensures a seamless integration with your current chart aesthetics and improves visual clarity.
Here is a s creenshot that beautifully demonstrates the power of this indicator. You'll see how the price rejects perfectly off the highest volume segment in an order block, showcasing the indicator's potential for pinpointing high-impact price levels.
While Volume Profile Bar-Magnified Order Blocks offers many unique features, it should be used in conjunction with other indicators and forms of analysis for a complete trading strategy. As with all tools, it does not guarantee profitable trades but is intended to give traders more information to base their decisions on. Use it to complement your existing analysis and enhance your understanding of market behavior.
Experience a new level of clarity in your trading with Volume Profile Bar-Magnified Order Blocks - an indicator that goes beyond the surface to help you navigate the markets more effectively.

Volume Profile Regression Channel [LuxAlgo]The Volume Profile Regression Channel calculates a volume profile from an anchored linear regression channel. Users can choose the starting and ending points for the indicator calculation interval.
Like a regular volume profile, a "line" of control (LOC), value area, and a developing LOC are displayed.
🔶 SETTINGS
Sections: The number of sections the linear regression channel is divided into for the calculation of the volume profile.
Width %: Determines the length of the profile within the channel relative to the channel length.
Value Area %: Highlights the sections starting from the POC whose accumulated volume is equal to the user-defined percentage of the total profile sections volume.
🔶 USAGES
Regular volume profiles are often constructed from a horizontal price area, this can allow highlighting price areas where most trading activity takes place.
However, when price is strongly trending a classical volume profile can sometimes be more uniform. This is where using an angled volume profile can be useful.
The line of control allows highlighting the section of the channel with the most accumulated volume, this line can be used as a potential future support/resistance. This is where an angled volume profile might be the most useful.
The developing LOC highlights the LOC location at a specific time within the profile (from left to right) and can sometimes provide an estimate of the underlying trend in the price.
🔶 DETAILS
To be computed the script requires a left and right chart time coordinates. When adding the script to their charts users can determine the left and right time coordinates by clicking on the chart.
The linear regression channel width is determined so that the channel precisely encompasses the whole price.
🔶 LIMITATIONS
Using a very large calculation interval can return timeouts. Users can reduce the calculation interval to fix that issue from occurring.
The amount of drawing objects that can be used is limited, as such using a high calculation interval can display an incomplete profile.
🔶 ACKNOWLEDGEMENTS
If you are interested in these types of scripts, @HeWhoMustNotBeNamed published a similar script where users can use a custom line angle. See his 'Angled Volume Profile' script from March 2023.

Volume Profile Matrix [LuxAlgo]The Volume Profile Matrix indicator extends from regular volume profiles by also considering calculation intervals within the calculation window rather than only dividing the calculation window in rows.
Note that this indicator is subject to repainting & back-painting, however, treating the indicator as a tool for identifying frequent points of interest can still be very useful.
🔶 SETTINGS
Lookback: Number of most recent bars used to calculate the indicator.
Columns: Number of columns (intervals) used to calculate the volume profile matrix.
Rows: Number of rows (intervals) used to calculate the volume profile matrix.
🔶 USAGE
The Volume Profile Matrix indicator can be used to obtain more information regarding liquidity on specific time intervals. Instead of simply dividing the calculation window into equidistant rows, the calculation is done through a grid.
Grid cells with trading activity occurring inside them are colored. More activity is highlighted through a gradient and by default, cells with a color that are closer to red indicate that more trading activity took place within that cell. The cell with the highest amount of trading activity is always highlighted in yellow.
Each interval (column) includes a point of control which highlights an estimate of the price level with the highest traded volume on that interval. The level with the highest traded volume of the overall grid is extended to the most recent bar.

Bar Magnified Volume Profile/Fixed Range [ChartPrime]This indicator draws a volume profile by utilizing data from the lower timeframe to get a more accurate representation of where volume occurred on a bar to bar basis. The indicator creates a price range, and then splits that price range into 100 grids by default. The indicator then drops down to the lower timeframe, approximately 16 times lower than the current timeframe being viewed on the chart, and then parses through all of the lower timeframe bars, and attributes the lower timeframe bar volume to all grids that it is touching. The volume is dispersed proportionally to the grids which it is touching by whatever percent of the candle is inside each grid. For example, if one of the lower timeframe bars is interacting with "2" of the grids in the profile, and 60% of the candle is inside of the top grid, 60% of the volume from said candle will be attributed to the grid.
To make all of this magic happen, this script utilizes a quadratic time complexity algorithm while parsing and attributing the volume to all of the grids. Due to this type of algorithm being used in the script, many of the user inputs have been limited to allow for simplicity, but also to prevent possible errors when executing loops. For the most part, all of the settings have been thoroughly tested and configured with the right amount of limitations to prevent these errors, but also still give the user a broad range of flexibility to adjust the script to their liking.
📗 SETTINGS
Lookback Period: The lookback period determines how many bars back the script will search for the "highest high" and the "lowest low" which will then be used to generate the grids in-between
Number Of Levels: This setting determines how many grids there will be within the volume profile/fixed range. This is personal preference, however it is capped at 100 to prevent time complexity issues
Profile Length: This setting allows you to stretch or thin the volume profile. A higher number will stretch it more, vise versa a smaller number will thin it further. This does not change the volume profiles results or values, only its visual appearance.
Profile Offset: This setting allows you to offset the profile to the left or right, in the event the user does not appreciate the positioning of the default location of the profile. A higher number will shift it to the right, vise versa a lower number will shift it to the left. This is personal preference and does not affect the results or values of the profile.
🧰 UTILITY
The volume profile/fixed range can be used in many ways. One of the most popular methods is to identify high volume areas on the chart to be used as trade entries or exits in the event of the price revisiting the high volume areas. Take this picture as an example. The image clearly demonstrates how the 2 highest areas of volume within this magnified volume profile also line up to great areas of support and resistance in the market.
Here are some other useful methods of using the volume profile/fixed range
Identify Key Support and Resistance Levels for Setups
Determine Logical Take Profits and Stop Losses
Calculate Initial R Multiplier
Identify Balanced vs Imbalanced Markets
Determine Strength of Trends

Volume profile zonesHi all!
This script calculates and shows the volume profile for the range of a higher timeframe candle. It then shows support or resistance (/supply or demand) zones based on the volume profiles with the most volume. The defaults are just my preferred settings so feel free to play with them! Also feel free to let me know about bugs and features. I already have a list of features to make, e.g.:
base on pivots
more info zone calculations, e.g. breaks and retests, virgin point of control etc.
add alerts
get rid of getPriceLevels()
get rid of _barVolumeProfile prefix
handle realtime
...
Best of trading luck!

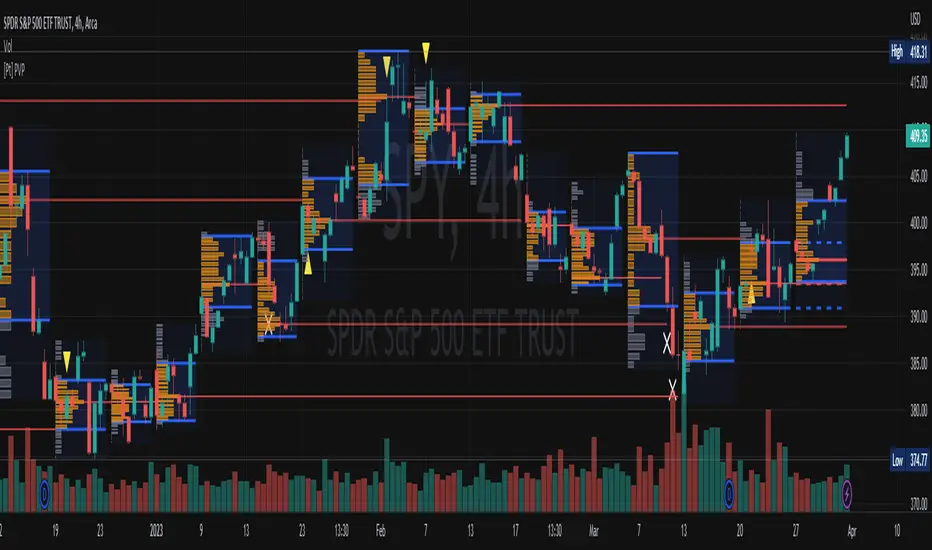
[Pt] Periodic Volume ProfileThis script is an attempt to recreate the Periodic Volume Profile that is built-in by TradingView, with slightly different features. Related blog: www.tradingview.com
This script is based on another script "Volume Profile, Pivot Anchored" by @dgtrd
*Note that only limited number Volume Profile can be displayed on the chart due to limitations on displaying boxes and lines.
Description
This Periodic Volume Profile (PVP) indicator allows trades to view volume profiles for periods longer than the current timeframe. The indicator builds one general volume profile for each new period, set by the user through the “Periodic Timeframe” input parameter.
This script also has the option to extend Point of Control (POC) lines with optional end conditions: Until Bar Touch, Until Last Bar, Until Bar Cross, or None, which extends to the right.
Signals are generated for Naked POC touches and crosses by a triangle symbol and a cross symbol, by default.
Alerts are available for POC touches and crosses.
What is Volume Profile?
Volume profile is a technical analysis tool that shows the volume of trades at different prices for a given security or market over a specific period of time.
Volume profile can be used to identify key levels of support and resistance, as well as to assess the overall supply and demand for a security. For example, if there is a high volume of trades at a particular price level, this may indicate that there is a significant level of support or resistance at that price. On the other hand, if there is relatively low volume at a particular price, this may indicate that there is not much interest in trading at that level.
Traders can use volume profile to identify trends, make trading decisions, and set stop-loss and take-profit orders. It can also be useful for identifying patterns such as "pockets of liquidity," which are areas where there is a high volume of trades but relatively little price movement.
It is important to note that volume profile should be used in conjunction with other technical analysis tools and should not be relied upon in isolation. It is also important to consider the overall context and market conditions when interpreting volume profile data.
Key Difference with TradingView's PVP indicator - TradingView's PVP intraday period does not align with standard intraday timeframes as it is determined by # of bars. This script provides volume profiles that aligns with higher timeframe periods.
Enjoy~!
Volume/Market ProfileVolume/Market Profile is a 2 in 1 Volume Profile and Market Profile Indicator.
This indicator is my own calculations for compiling a volume profile and market profile.
The profile is progressively calculated live as the chart develops.
I have made use of both Boxes AND Lines to allow me to display a finer granularity profile by displaying up to twice the max amount of lines allowed in tradingview.
I have spent a lot of time to make sure the values are getting appended exactly as intended so that I can assure this profile is operating as precisely as possible within the limitations of the data available.
To make my calculations easier to use in other places, I have made my volume profile a function that can be extracted and used whenever you need values from a volume profile.
Feel free to read through the script if you don't understand how this profile is developed. I have made a commentary of my volume profile function to help you understand what exactly happens to compile the profiles.
As mentioned before, This indicator doubles as a market profile. To view both at the same time you will need to add the indicator on your chart twice.
I have built in comprehensive customizations to allow you to display your profiles however fits your needs.
Timeframe: The aggregation period for profiles, to see a 1 week profile, change the timeframe to 1 week.
Note: You can add custom timeframes by adding a custom timeframe in your chart timeframe dropdown menu. When you add timeframes in this area, they appear as options within indicators with the timeframe input.
Sensitivity: Allows for greater or less granularity changes. The calculation method for granularity automatically changes depending on the range of your chart.
Note: Multiply this value by 100 and that will be the max range (in ticks) of your price before the indicator automatically adjusts to make the profile less granular. (ex. If price ranges $1, and 1 tick is $0.01, granularity will be 0.01 with a sensitivity of 1+)
Value Area %: % of total volume to display as the value zone. (_% of total profile values are contained within the value zone)
Calculate as Market Profile: Uses a 1 Instead of the candle volume, to display a Market Profile. (If selected POC -> TPOC)
Display Size: Sets the # of bars from the profile axis to the profile's max value. If set negative, profile will be displayed left of axis, if positive, profile will be displayed to the right of the axis.
Display Offset: Sets the # of bars in front(or behind) the current chart bar to set the axis of the profile. If negative, the axis will be to the left of the current chart bar, if positive the axis will be right of the current chart bar.
Display Historical POC/VAH/VAL: Choose to display historical poc,vah,val lines.
Colors: I'm not explaining colors.
Enjoy!

Volume Profile With Buy & Sell Pressure LabelVOLUME PROFILE WITH BUY AND SELL PRESSURE LABEL
This volume profile indicator shows volume traded for each bar and is colored according to the difference in buy and sell pressure(DMI).
***HOW TO USE***
If the bar and background is colored green, there is more market buying than selling on that bar.
If the bar and background is colored red, there is more market selling than buying on that bar.
If the bar and background is colored blue, there is an equal amount of market buying and selling on that bar.
***BUY/SELL LABEL***
There is also a label on the right side that tells you whether there is more buying or selling on the current bar. This table updates in real time and changes colors so you can get an easy, quick interpretation of the current buy/sell pressure without having to look at the volume bars so you can make faster decisions on whether to enter or exit a trade. The table changes colors in sync with the volume bars and background. Green means more market buying than selling. Red means more market selling than buying. Blue means an equal amount of market buying and selling.
***MARKETS***
This indicator can be used as a signal on all markets, including stocks, crypto, futures and forex.
***TIMEFRAMES***
This volume profile indicator can be used on all timeframes.
***TIPS***
Try using numerous indicators of ours on your chart so you can instantly see the bullish or bearish trend of multiple indicators in real time without having to analyze the data. Some of our favorites are our Auto Fibonacci, DMI, Momentum, Auto Support And Resistance and Money Flow Index in combination with this Volume Profile. They all have real time Bullish and Bearish labels as well so you can immediately understand each indicator's trend.
