Liquidation Heatmap [Alpha Extract]A sophisticated liquidity zone visualization system that identifies and maps potential liquidation levels based on swing point analysis with volume-weighted intensity measurement and gradient heatmap coloring. Utilizing pivot-based pocket detection and ATR-scaled zone heights, this indicator delivers institutional-grade liquidity mapping with dynamic color intensity reflecting relative liquidity concentration. The system's dual-swing detection architecture combined with configurable weight metrics creates comprehensive liquidation level identification suitable for strategic position planning and market structure analysis.
🔶 Advanced Pivot-Based Pocket Detection
Implements dual swing width analysis to identify potential liquidation zones at pivot highs and lows with configurable lookback periods for comprehensive level coverage. The system detects primary swing points using main pivot width and optional secondary swing detection for increased pocket density, creating layered liquidity maps that capture both major and minor liquidation levels across extended price history.
🔶 Multi-Metric Weight Calculation Engine
Features flexible weight source selection including Volume, Range (high-low spread), and Volume × Range composite metrics for liquidity intensity measurement. The system calculates pocket weights based on market activity at pivot formation, enabling traders to identify which liquidation levels represent higher concentration of potential stops and liquidations with configurable minimum weight thresholds for noise filtering.
🔶 ATR-Based Zone Height Framework
Utilizes Average True Range calculations with percentage-based multipliers to determine pocket vertical dimensions that adapt to market volatility conditions. The system creates ATR-scaled bands above swing highs for short liquidation zones and below swing lows for long liquidation zones, ensuring zone heights remain proportional to current market volatility for accurate level representation.
🔶 Dynamic Gradient Heatmap Visualization
Implements sophisticated color gradient system that maps pocket weights to intensity scales, creating intuitive visual representation of relative liquidity concentration. The system applies power-law transformation with configurable contrast adjustment to enhance differentiation between weak and strong liquidity pockets, using cyan-to-blue gradients for long liquidations and yellow-to-orange for short liquidations.
🔶 Intelligent Pocket State Management
Features advanced pocket tracking system that monitors price interaction with liquidation zones and updates pocket states dynamically. The system detects when price trades through pocket midpoints, marking them as "hit" with optional preservation or removal, and manages pocket extension for untouched levels with configurable forward projection to maintain visibility of approaching liquidity zones.
🔶 Real-Time Liquidity Scale Display
Provides gradient legend showing min-max range of pocket weights with 24-segment color bar for instant liquidity intensity reference. The system positions the scale at chart edge with volume-formatted labels, enabling traders to quickly assess relative strength of visible liquidation pockets without numerical clutter on the main chart area.
🔶 Touched Pocket Border System
Implements visual confirmation of executed liquidations through border highlighting when price trades through pocket zones. The system applies configurable transparency to touched pocket borders with inverted slider logic (lower values fade borders, higher values emphasize them), providing clear historical record of liquidated levels while maintaining focus on active untouched pockets.
🔶 Dual-Swing Density Enhancement
Features optional secondary swing width parameter that creates additional pocket layer with tighter pivot detection for increased liquidation level density. The system runs parallel pivot detection at both primary and secondary swing widths, populating chart with comprehensive liquidity mapping that captures both major swing liquidations and intermediate level clusters.
🔶 Adaptive Pocket Extension Framework
Utilizes intelligent time-based extension that projects untouched pockets forward by configurable bar count, maintaining visibility as price approaches potential liquidation zones. The system freezes touched pocket right edges at hit timestamps while extending active pockets dynamically, creating clear distinction between historical liquidations and forward-projected active levels.
🔶 Weight-Based Label Integration
Provides floating labels on untouched pockets displaying volume-formatted weight values with dynamic positioning that follows pocket extension. The system automatically manages label lifecycle, creating labels for new pockets, updating positions as pockets extend, and removing labels when pockets are touched, ensuring clean chart presentation with relevant liquidity information.
🔶 Performance Optimization Framework
Implements efficient array management with automatic clean-up of old pockets beyond lookback period and optimized box/label deletion to maintain smooth performance. The system includes configurable maximum object counts (500 boxes, 50 labels, 100 lines) with intelligent removal of oldest elements when limits are approached, ensuring consistent operation across extended timeframes.
This indicator delivers sophisticated liquidity zone analysis through pivot-based detection and volume-weighted intensity measurement with intuitive heatmap visualization. Unlike simple support/resistance indicators, the Liquidation Heatmap combines swing point identification with market activity metrics to identify where concentrated liquidations are likely to occur, while the gradient color system instantly communicates relative liquidity strength. The system's dual-swing architecture, configurable weight metrics, ATR-adaptive zone heights, and intelligent state management make it essential for traders seeking strategic position planning around institutional liquidity levels across cryptocurrency, forex, and futures markets. The visual heatmap approach enables instant identification of high-probability reversal zones where cascading liquidations may trigger significant price reactions.
Volume

Volume Flow Anatomy [Kodexius]Volume Flow Anatomy is a dynamic, multi-dimensional volume map that reconstructs how buy, sell, and “stealth” activity is distributed across price rather than just across time. Instead of relying on a static, session-based volume profile, it uses an exponentially decaying memory of recent bars to build a constantly evolving “anatomy” of the auction, where each price level carries an adaptive history of order flow.
The script separates buy vs. sell pressure, adds a third “Stealth Flow” dimension for low-volume price movement (ease of movement / divergence), and automatically derives POC, Value Area, imbalances, absorption zones, and classic profile shapes (D, P, b, B). This gives the trader a compact but highly information-dense map on the right side of the chart to read control (buyers vs. sellers), structure (balanced vs. trending vs. double distribution), and key reaction levels (support/resistance born from flow, not just wicks).
🔹 Features
🔸 Dynamic Lookback with Decay
- The script computes an effective lookback N from the Decay Factor and caps it with Max Lookback.
- Higher decay keeps more history; lower decay emphasizes the most recent flow.
- The profile continuously adapts as new bars are printed.
🔸 Price-Bucketed Flow Map
Each bucket accumulates:
- Sell Flow (sell pressure)
- Buy Flow (buy pressure)
- Stealth Flow (low-volume price movement)
- Box width at each bucket is proportional to the relative intensity of that component.
🔸 Stealth Flow (Low-Volume Price Movement)
- Measures close to close movement relative to volume, emphasizing price movement that occurs on comparatively low volume.
- Helps reveal hidden participation, inefficient moves, and areas that may be vulnerable to re-tests or reversions.
🔸 POC & 70% Value Area (VA)
- Identifies the Point of Control (price bucket with the highest total volume) over the effective lookback.
- Builds a 70% Value Area by expanding from POC towards the nearest high volume neighbors until 70% of the total volume is included.
- POC is drawn as a line over the analyzed range; VA is displayed as a shaded band in the profile area.
🔸 Market Profile Shape Detection
Splits the profile vertically into three zones (bottom / middle / top) and compares their volume distribution.
Classifies structure as:
- D-Shape (Balanced)
- P-Shape (Short Covering)
- b-Shape (Long Liquidation)
- B-Shape (Double Distribution)
Displays a shape label with color coded bias for quick auction context interpretation.
🔸 Imbalance Zones & Absorption
Imbalance: detects buckets where Buy Flow or Sell Flow exceeds the opposite side by at least Imbalance Ratio.
Absorption: flags zones with high volume but low price “ease”, where price is not moving much despite significant volume.
Extends these levels into horizontal zones, marking potential support/resistance and trap areas.
Bullish Imbalance Zone :
Bearish Imbalance Zone :
Absorption Zone :
🔸 Range Context & On-Chart Legend
Draws a Range Box covering the dynamically determined lookback (N bars), with a label displaying the effective bar count.
A bottom-right legend summarizes:
- Color keys for Buy / Sell / Stealth
- POC / VA status
- Bullish vs. Bearish dominance percentage
- Profile shape classification
- Imbalance and Absorption conventions
🔹 Calculations
1. Dynamic Lookback & Price Buckets
int N = math.min(int(4 / (1 - decayFactor) - 1), maxHistory)
float priceHigh = ta.highest(high, N)
float priceLow = ta.lowest(low, N)
float bucketSize = (priceHigh - priceLow) / bucketCount
The effective lookback N is derived from the Decay Factor, using the approximation 4 / (1 - decay) to capture roughly 99% of the decayed influence, then capped with maxHistory to control performance. Over that adaptive range, the script finds the highest and lowest prices and divides the band into bucketCount equal slices (bucketSize). Each slice is a price bucket that will accumulate volume-flow information.
2. Exponentially Decayed Volume Allocation
addValue(array profile, float weight, float minPrice, float maxPrice) =>
for j = 0 to bucketCount - 1
float bucketMin = priceLow + j * bucketSize
float bucketMax = bucketMin + bucketSize
float overlapMin = math.max(minPrice, bucketMin)
float overlapMax = math.min(maxPrice, bucketMax)
float overlapRange = overlapMax - overlapMin
if overlapRange > 0
profile.set(j, profile.get(j) * decayFactor + weight * overlapRange)
This function is the core engine of the indicator. For a given price span and intensity, it checks every bucket for overlap, distributes the weight proportionally to the overlapping range, and before adding new value, decays the existing bucket content by decayFactor. This results in an exponentially weighted profile: recent activity dominates, while older levels retain a gradually fading footprint.
3. POC and 70% Value Area
array totalProfile = array.new(bucketCount, 0)
for j = 0 to bucketCount - 1
float total = sellProfile.get(j) + buyProfile.get(j)
totalProfile.set(j, total)
if total > eaMax
eaMax := total
int pocIdx = 0
float pocVal = 0.0
for j = 0 to bucketCount - 1
if totalProfile.get(j) > pocVal
pocVal := totalProfile.get(j)
pocIdx := j
float totalSum = totalProfile.sum()
float targetSum = totalSum * 0.70
int vaLow = pocIdx
int vaHigh = pocIdx
float currentSum = pocVal
while currentSum < targetSum and (vaLow > 0 or vaHigh < bucketCount - 1)
float lowVal = vaLow > 0 ? totalProfile.get(vaLow - 1) : 0.0
float highVal = vaHigh < bucketCount - 1 ? totalProfile.get(vaHigh + 1) : 0.0
First, totalProfile is built as the sum of buy and sell flow per bucket, and eaMax (the maximum total) is tracked for later normalization. The POC bucket (pocIdx) is simply the index with the highest totalProfile value.
To compute the 70% Value Area, the algorithm starts at the POC bucket and expands outward, each step adding either the upper or lower neighbor depending on which has more volume. This continues until the cumulative volume reaches 70% of totalSum. The result is a volume-driven VA, not necessarily symmetric around POC, which more accurately represents where the market has truly traded.
4. Market Profile Shape Classification
float volTopThird = 0.0
float volMidThird = 0.0
float volBotThird = 0.0
int thirdIdx = int(bucketCount / 3)
for j = 0 to bucketCount - 1
float val = totalProfile.get(j)
if j < thirdIdx
volBotThird += val
else if j < thirdIdx * 2
volMidThird += val
else
volTopThird += val
float totalVolShape = totalProfile.sum()
string shapeStr = "D-Shape (Balanced)"
if (volTopThird > totalVolShape * 0.20) and (volBotThird > totalVolShape * 0.20) and (volMidThird < totalVolShape * 0.50)
shapeStr := "B-Shape (Double Dist)"
else
if pocIdx > bucketCount * 0.5 and volTopThird > volBotThird * 1.3
shapeStr := "P-Shape (Short Covering)"
else if pocIdx < bucketCount * 0.5 and volBotThird > volTopThird * 1.3
shapeStr := "b-Shape (Long Liquidation)"
else
shapeStr := "D-Shape (Balanced)"
The profile is split into bottom, middle, and top thirds. The script compares how much volume is concentrated in each and combines that with the relative location of POC. If both extremes are heavy and the middle light, it labels a B-Shape (double distribution). If the POC is high and the top dominates the bottom, it’s a P-Shape (short covering). If the POC is low and the bottom dominates, it’s a b-Shape (long liquidation). Otherwise, it defaults to a D-Shape (balanced). This provides a quick, at-a-glance assessment of auction structure.
5. Imbalances, Absorption & Zones
bool isBuyImb = showImb and sVal > 0 and (bVal / sVal >= imbRatio)
bool isSellImb = showImb and bVal > 0 and (sVal / bVal >= imbRatio)
float volRatio = eaMax > 0 ? tVal / eaMax : 0
float stRatio = esmRange > 0 ? (stVal - esmMin) / esmRange : 1.0
bool isAbsorp = showAbsorp and volRatio > 0.6 and stRatio < 0.25
if showImbZone
if isSellImb
zoneBoxes.push(box.new(bar_index - N + 1, bucketHi, bar_index + 1, bucketLo, ...))
if isBuyImb
zoneBoxes.push(box.new(bar_index - N + 1, bucketHi, bar_index + 1, bucketLo, ...))
if isAbsorp
zoneBoxes.push(box.new(bar_index - N + 1, bucketHi, bar_index + 1, bucketLo, ...))
Imbalances are identified where one side’s volume (buy or sell) exceeds the other by at least Imbalance Ratio. These buckets are marked as buy or sell imbalance zones, indicating aggressive participation from one side.
Absorption is detected by combining a high volume ratio (volRatio) with a low normalized stealth ratio (stRatio). High volume with limited price movement suggests that opposing orders are absorbing flow at that level. Both imbalance and absorption buckets are extended into horizontal zones from the start of the lookback to the current bar, visually emphasizing key support/resistance and liquidity areas.
6. Building Buy, Sell & Stealth Profiles
sellProfile := array.new(bucketCount, 0)
buyProfile := array.new(bucketCount, 0)
stealthProfile := array.new(bucketCount, 0)
Three arrays are used to store Sell Flow, Buy Flow, and Stealth Flow. Bars are processed from oldest to newest so that decay is applied in correct chronological order. For each bar, a volume density (volume / range) is calculated and distributed across the candle range. Bull candles feed buyProfile, bear candles feed sellProfile.
Stealth Flow computes the close-to-close move between consecutive bars, scaled by 1 / (1 + volume). Big moves on low volume produce high stealth values, which are then allocated across the move’s price span into stealthProfile. This yields a three-layer profile per price level: directional volume and stealthy price movement.

Advanced Breakout SystemAdvanced Breakout System
Developed by: Mohammed Bedaiwi
This script hunts for high-probability breakouts by combining price consolidation zones, volume spikes vs. average volume, smart money flow (OBV), and a Momentum Override for explosive moves that skip consolidation. Additionally, it automatically identifies and plots Support and Resistance levels with price labels to help you visualize market structure.
The system follows a "Watch & Confirm" logic: it first prints a WATCH setup, then a BUY only if price confirms strength.
🔑 Color Legend (Visual Guide)
🟡 WATCH – Setup (Yellow Arrow Down) :
Potential breakout setup detected. Monitor the stock and do not enter yet. Triggered when price breaks out of a recent consolidation with strong volume or makes a big momentum move (e.g. >5%) in a single bar.
🟢 BUY – Confirmation (Green Arrow Up) :
Confirmed breakout. Consider entering a long position according to your own rules. Triggered when price trades above the high of the WATCH candle.
🟠 SELL – Break (Orange Arrow) :
Short-term trend weakness. Triggered when price closes below the Fast EMA (9). Used as a protective exit or partial profit-taking.
🔴 SELL – Dump (Dark Red Arrow) :
Distribution / volume dump. Triggered by a bearish candle with abnormally high volume compared to the average (e.g. ≥ Dump Volume Multiplier × average volume).
🟣 SELL – Pattern (Purple Arrow) :
Bearish price-action pattern (such as a bearish engulfing). Indicates a possible top or reversal.
🔴/🟢 Support & Resistance Lines :
Small horizontal lines plotted at key swing points. Red Line: Resistance (Swing High). Green Line: Support (Swing Low). Both include exact price labels for quick reference.
⚙️ Inputs
Entry settings: Consolidation Lookback (default 20) = bars used to detect consolidation. Consolidation Range % (default 12%) = max allowed range size; higher values make the script more sensitive. Volume Spike Multiplier (default 1.2) = factor above average volume to count as a spike. Force Signal on Big Moves (default ON) = forces a WATCH signal if price jumps more than a set % (e.g. 5%) even without consolidation/OBV confirmation.
Exit settings: Enable Fast Exit (EMA 9) toggles the SELL – Break signal. Dump Volume Multiplier defines what counts as “dump” volume (e.g. 2× average).
Support & Resistance: Adjustable Pivot Left/Right bars allow you to control the sensitivity of the support and resistance lines.
⚠️ Disclaimer
Trading involves significant risk of loss. This script is for educational and informational purposes only and is not financial advice or a recommendation to buy or sell any asset. BUY and SELL signals are rule-based and derived from historical behavior and do not guarantee future performance. Always use your own analysis and risk management.

ICT Order Block Identifier [Eˣ]📦 Order Block Identifier - Free Indicator
Overview
The Order Block Identifier automatically detects and displays institutional order blocks on your charts - the exact zones where banks, hedge funds, and market makers place their orders. Based on ICT (Inner Circle Trader) concepts, this indicator helps you trade alongside smart money by identifying where institutions are likely to defend their positions and where price often finds support or resistance.
━━━━━━━━━━━━━━━━━━━━━━━━━━━━
🎯 What This Indicator Does
Detects Order Blocks:
• 🟢 Bullish Order Blocks (OB+) - Last bearish candle before strong bullish move
• 🔴 Bearish Order Blocks (OB-) - Last bullish candle before strong bearish move
• Automatically identifies institutional buying/selling zones
• Tracks up to 30 order blocks simultaneously
• Works on all timeframes and instruments
Smart Features:
• Auto-Timeframe Adjustment - Optimizes detection for 1min to Weekly charts
• Active Block Highlighting - Shows which OB price is approaching (🎯)
• Mitigation Tracking - Knows when blocks are "used" and no longer valid
• ATR-Based Detection - Adapts to each instrument's volatility
• Strength Filtering - Choose Low/Medium/High to control sensitivity
Visual Display:
• Clean boxes extending from order block to current price
• Color-coded: Green (bullish), Red (bearish), Gray (mitigated)
• OB+ / OB- labels for quick identification
• Active blocks highlighted with 🎯 emoji
• Distance indicator showing how far price is from nearest OB
Statistics Panel:
• Count of active bullish and bearish order blocks
• Market bias based on OB balance
• Distance to nearest order block
• Real-time status updates
━━━━━━━━━━━━━━━━━━━━━━━━━━━━
📚 Understanding Order Blocks
What Are Order Blocks?
Order blocks are the "footprints" left behind by institutional traders (banks, hedge funds, market makers) when they enter large positions. Because institutions can't fill massive orders at once without moving the market, they:
1. Place orders gradually over time
2. Leave zones where their buy/sell orders are concentrated
3. Defend these zones when price returns
4. Create reliable support and resistance levels
The ICT Concept:
Developed by Michael Huddleston (Inner Circle Trader), order block theory states that:
• The last opposite-colored candle before a strong move contains institutional orders
• Price often returns to test these zones before continuing
• These zones act as strong support (bullish OB) or resistance (bearish OB)
• Smart money defends their positions at these levels
Why Order Blocks Work:
• Unfilled Orders: Institutions may still have pending orders in the block
• Position Defense: They protect their entries by adding to positions
• Stop Placement: Retail stops cluster near these zones (liquidity for institutions)
• Market Structure: Price respects these levels due to order flow dynamics
━━━━━━━━━━━━━━━━━━━━━━━━━━━━
🟢 Bullish Order Blocks Explained
How They Form:
1. Price is consolidating or declining
2. Institutions begin accumulating (buying)
3. A strong bullish move erupts
4. The last bearish candle before this move = Bullish Order Block
5. This candle represents where institutions were buying aggressively
Why The Last Bearish Candle?
• Institutions absorbed all selling pressure at this level
• Their buy orders filled as price was declining
• When price returns, they defend this zone with more buying
• It becomes a demand zone / support level
Trading Bullish Order Blocks:
Setup:
• Wait for price to retrace back to bullish OB (green box)
• Look for rejection/reversal pattern (pin bar, engulfing, etc.)
• Enter long when price bounces from the OB zone
• Stop loss: Below the order block
• Target: Recent high or opposite order block
Best Scenarios:
• OB aligns with other support (trendline, fibonacci, round number)
• First touch of OB (unmitigated) has highest probability
• Occurs during high-volume sessions (London/NY)
• Trend is bullish on higher timeframe
Example Trade:
• Bullish OB forms at $50,000 (last red candle before rally)
• Price rallies to $52,000 then retraces
• Price drops back to $50,100 (touching OB)
• Bullish pin bar forms on the OB
• Enter long at $50,200, stop at $49,800
• Target: $52,000+ (previous high)
━━━━━━━━━━━━━━━━━━━━━━━━━━━━
🔴 Bearish Order Blocks Explained
How They Form:
1. Price is consolidating or rising
2. Institutions begin distributing (selling)
3. A strong bearish move erupts
4. The last bullish candle before this move = Bearish Order Block
5. This candle represents where institutions were selling aggressively
Why The Last Bullish Candle?
• Institutions absorbed all buying pressure at this level
• Their sell orders filled as price was rising
• When price returns, they defend this zone with more selling
• It becomes a supply zone / resistance level
Trading Bearish Order Blocks:
Setup:
• Wait for price to retrace back to bearish OB (red box)
• Look for rejection/reversal pattern (shooting star, bearish engulfing)
• Enter short when price rejects from the OB zone
• Stop loss: Above the order block
• Target: Recent low or opposite order block
Best Scenarios:
• OB aligns with other resistance (trendline, fibonacci, round number)
• First touch of OB (unmitigated) has highest probability
• Occurs during high-volume sessions (London/NY)
• Trend is bearish on higher timeframe
Example Trade:
• Bearish OB forms at $48,000 (last green candle before drop)
• Price drops to $46,000 then retraces
• Price rallies back to $47,900 (touching OB)
• Bearish engulfing forms at the OB
• Enter short at $47,800, stop at $48,200
• Target: $46,000- (previous low)
━━━━━━━━━━━━━━━━━━━━━━━━━━━━
📊 How To Use This Indicator
Strategy 1: Order Block Retest (Classic)
Best For: Swing trading, capturing reversals
Timeframes: 15min, 1H, 4H, Daily
Win Rate: 60-70% (first touch)
Entry Rules:
1. Identify unmitigated order block (bright color, not gray)
2. Wait for price to return to the OB zone
3. Look for price action confirmation:
• Bullish OB: Pin bar, bullish engulfing, hammer
• Bearish OB: Shooting star, bearish engulfing, doji
4. Enter in the direction of the OB
5. Stop loss: Beyond the opposite side of OB (20-30 pips)
6. Target: 2-3R or opposite OB
Example:
• Bullish OB at $100-$102
• Price drops to $101.50 (enters OB)
• Bullish pin bar forms with low at $100.80
• Enter long at $102 (OB high), stop at $99.50
• Risk: $2.50, Target: $107.50 (3R)
Strategy 2: Break & Retest
Best For: Trend trading, breakout confirmation
Timeframes: 5min, 15min, 1H
Win Rate: 65-75%
Entry Rules:
1. Price breaks through an order block
2. Wait for pullback to the broken OB
3. The OB now acts as support (if broken up) or resistance (if broken down)
4. Enter when price respects the flipped OB
5. Stop: Inside the OB zone
6. Target: Next OB or structure level
Why It Works: Broken OBs flip polarity - support becomes resistance and vice versa
Strategy 3: Multi-Timeframe Confirmation
Best For: High-probability setups
Timeframes: Combine 1H + 4H or 15min + 1H
Win Rate: 70-80%
Entry Rules:
1. Identify order block on higher timeframe (4H or Daily)
2. Switch to lower timeframe (1H or 15min)
3. Wait for lower TF order block to form within higher TF OB
4. Trade the lower TF OB in direction of higher TF OB
5. Stop: Below lower TF OB
6. Target: Edge of higher TF OB or beyond
Why It Works: Alignment across timeframes = institutional consensus
Strategy 4: Order Block to Order Block
Best For: Range trading, swing entries
Timeframes: 1H, 4H
Win Rate: 55-65%
Entry Rules:
1. Identify both bullish OB below and bearish OB above
2. Price is ranging between these OBs
3. Enter long at bullish OB, target bearish OB
4. Enter short at bearish OB, target bullish OB
5. Stop: Beyond the trading OB
6. Exit at opposite OB
Why It Works: Price moves from one institutional zone to another
Strategy 5: Mitigation Fade
Best For: Aggressive scalping
Timeframes: 5min, 15min
Win Rate: 50-60% (higher risk)
Entry Rules:
1. Price approaches an order block
2. Instead of bouncing, price breaks through (mitigates it)
3. Enter immediately in direction of breakout
4. Stop: Back inside the mitigated OB
5. Quick target: 1-1.5R
Why It Works: When OB fails, it often leads to strong continuation
━━━━━━━━━━━━━━━━━━━━━━━━━━━━
⚙️ Settings Explained
Core Settings
Auto-Adjust for Timeframe (Default: ON)
• Automatically optimizes detection for current chart timeframe
• 1min: 3 bars lookback
• 5min: 4 bars lookback
• 15min: 5 bars lookback
• 1H: 6 bars lookback
• 4H: 8 bars lookback
• Daily+: 10-12 bars lookback
• Recommended: Keep ON for best results
Manual Detection Length (Default: 5)
• Only used when Auto-Adjust is OFF
• Number of bars to look back for the "last opposite candle"
• Lower (2-4): More sensitive, more blocks, more noise
• Higher (6-10): Less sensitive, fewer blocks, higher quality
• Recommended: Use Auto-Adjust instead
Display Settings
Show Bullish/Bearish Order Blocks
• Toggle each type on/off independently
• Customize colors for each OB type
• Tip: Match colors to your chart theme
Max Order Blocks to Display (Default: 10)
• Limits how many OBs are shown at once
• Lower (5-8): Cleaner chart, only recent blocks
• Higher (15-30): More historical context
• Recommended: 8-12 for most trading
Show Order Block Labels (Default: ON)
• Displays "OB+" and "OB-" text on blocks
• Shows 🎯 on active (nearest) block
• Turn OFF for minimal chart appearance
• Recommended: Keep ON for clarity
Extend Blocks (bars) (Default: 50)
• How far to extend OB boxes to the right
• Lower (20-30): Shorter boxes, less clutter
• Higher (100+): Longer boxes, easier to see
• Blocks auto-extend until mitigated or limit reached
• Recommended: 40-60 bars
Filters
Block Strength Filter (Default: Medium)
• Controls how strong a move must be to create an OB
• Low: 0.5x ATR move required - Many blocks, more noise
• Medium: 1x ATR move required - Balanced quality/quantity
• High: 1.5x ATR move required - Only strongest institutional moves
• Recommended for beginners: High
• Recommended for experienced: Medium
• Recommended for scalpers: Low
Min Block Size % (Default: 0.1)
• Minimum size of OB as percentage of price
• Filters out tiny, insignificant blocks
• Crypto: 0.1-0.3%
• Forex: 0.05-0.15%
• Stocks: 0.1-0.5%
• Adjust based on instrument volatility
Advanced Settings
Show Mitigated Blocks (Default: OFF)
• When ON: Shows gray boxes for "used" order blocks
• When OFF: Blocks disappear after mitigation
• Use ON: For learning and analysis
• Use OFF: For clean, active trading
Highlight Active Block (Default: ON)
• Highlights the nearest order block to current price
• Active block shown with 🎯 emoji and brighter color
• Helps focus on most relevant trading opportunity
• Recommended: Keep ON
━━━━━━━━━━━━━━━━━━━━━━━━━━━━
📱 Info Panel Guide
Bullish OB Count
• Number of active (unmitigated) bullish order blocks
• Higher number = More support zones below price
• Multiple bullish OBs = Strong demand structure
Bearish OB Count
• Number of active (unmitigated) bearish order blocks
• Higher number = More resistance zones above price
• Multiple bearish OBs = Strong supply structure
Bias Indicator
• ⬆ Bullish: More bullish OBs than bearish (demand > supply)
• ⬇ Bearish: More bearish OBs than bullish (supply > demand)
• ↔ Neutral: Equal OBs on both sides
• Trade in direction of bias for higher probability
Near Indicator
• Shows which OB price is closest to
• Displays distance as percentage
• Example: "Bull OB 0.85%" = Bullish OB is 0.85% below current price
• Watch for "Near" alerts to time entries
━━━━━━━━━━━━━━━━━━━━━━━━━━━━
📱 Alert Setup
This indicator includes 4 alert types:
1. Price Entering Bullish OB
• Fires when price touches a bullish order block
• Action: Watch for bounce/reversal pattern
• High-probability long setup developing
2. Price Entering Bearish OB
• Fires when price touches a bearish order block
• Action: Watch for rejection/reversal pattern
• High-probability short setup developing
3. New Bullish OB Detected
• Fires when a new bullish order block forms
• Action: Mark the zone for future retest
• New demand zone identified
4. New Bearish OB Detected
• Fires when a new bearish order block forms
• Action: Mark the zone for future retest
• New supply zone identified
To Set Up Alerts:
1. Click "Alert" button (clock icon)
2. Select "Order Block Identifier"
3. Choose your alert condition
4. Configure notification method
5. Click "Create"
Pro Tip: Set "Price Entering" alerts to catch trading opportunities in real-time
━━━━━━━━━━━━━━━━━━━━━━━━━━━━
💎 Pro Tips & Best Practices
✅ DO:
• First touch is best - Unmitigated OBs have highest win rate (60-70%)
• Wait for confirmation - Don't buy/sell just because price touched OB
• Use multiple timeframes - Higher TF OBs are stronger than lower TF
• Combine with structure - OB + trendline/support = high probability
• Trade with the bias - More bullish OBs = favor longs
• Respect mitigation - Once OB is mitigated, it's less reliable
• Use proper stop loss - Always place stops beyond the OB zone
• Consider session timing - OBs work best during London/NY sessions
⚠️ DON'T:
• Don't blindly buy/sell at OBs - Wait for confirmation
• Don't ignore mitigation - Gray blocks are much weaker
• Don't trade every OB - Quality over quantity
• Don't fight strong trends - OBs can be run through in strong momentum
• Don't use alone - Combine with price action, support/resistance
• Don't expect 100% win rate - Even best OBs fail sometimes (30-40% of time)
• Don't overtrade - Wait for A+ setups with confluence
🎯 Best Timeframes By Trading Style:
• Scalpers: 1min, 5min (quick OB touches)
• Day Traders: 5min, 15min, 1H (balanced view)
• Swing Traders: 1H, 4H, Daily (major institutional zones)
• Position Traders: 4H, Daily, Weekly (strongest OBs)
🔥 Best Instruments:
• Excellent: Forex major pairs (EUR/USD, GBP/USD), BTC, ETH, ES, NQ
• Good: Gold, Oil, Major indices, Large-cap stocks
• Moderate: Altcoins, small-cap stocks (more noise)
• Avoid: Very low liquidity instruments (OBs less reliable)
⏰ Best Times To Trade OBs:
• London Session (03:00-12:00 EST): Highest OB respect rate
• NY Session (08:00-17:00 EST): Strong OB reactions
• London-NY Overlap (08:00-12:00 EST): Best probability
• Asian Session: Lower probability, wait for London
━━━━━━━━━━━━━━━━━━━━━━━━━━━━
🎓 Advanced Order Block Concepts
Order Block Flips (Polarity Change)
When price breaks through an OB and closes beyond it:
• Bullish OB that's broken becomes bearish (support becomes resistance)
• Bearish OB that's broken becomes bullish (resistance becomes support)
• Trading: Watch for retest of broken OB from opposite side
Order Block Refinement
When multiple OBs form at similar level:
• Later OB "refines" or "replaces" the earlier one
• Use the most recent OB as the active zone
• Older OBs become less relevant
Order Block Clusters
Multiple OBs stacked close together:
• Creates a "super zone" of institutional interest
• Higher probability of reversal
• Wider zone for entries (more room for confirmation)
Fair Value Gaps + Order Blocks
When OB aligns with Fair Value Gap:
• Extremely high probability setup
• Price is drawn to fill the gap AND test the OB
• Double confluence = institutional magnet
Order Block Mitigation Types
• Full Mitigation: Price fully enters and closes inside OB
• Partial Mitigation: Price wicks into OB but closes outside
• False Mitigation: Quick touch then immediate rejection
• Partial/false mitigation = OB still somewhat valid
━━━━━━━━━━━━━━━━━━━━━━━━━━━━
📈 Common Order Block Patterns
Pattern 1: The Perfect Retest
• OB forms during strong move
• Price continues 100-200+ pips
• Price retraces back to OB
• Clean bounce with confirmation candle
• Highest probability pattern
Pattern 2: The Double Tap
• Price tests OB, bounces weakly
• Price tests same OB again
• Second test produces stronger reaction
• Second touch often better entry
Pattern 3: The Fake-Out
• Price breaks through OB
• Immediately reverses back
• "Stop hunt" or liquidity grab
• Enter after price reclaims OB
Pattern 4: The Ladder
• Multiple OBs stacked like stairs
• Price steps from one OB to next
• Each OB provides support/resistance
• Trade OB-to-OB movements
Pattern 5: The Failed OB
• Price crashes through OB without pause
• OB completely invalidated
• Often signals strong momentum
• Don't fight it, trade the breakout
━━━━━━━━━━━━━━━━━━━━━━━━━━━━
🚀 What Makes This Different?
Unlike basic support/resistance indicators, Order Block Identifier:
• ICT Methodology - Based on proven institutional concepts
• Auto-Timeframe Optimization - Works perfectly on all timeframes
• ATR-Based Detection - Adapts to each instrument's volatility
• Mitigation Tracking - Knows when blocks are no longer valid
• Active Block Highlighting - Shows most relevant opportunity
• Smart Filtering - Only shows high-quality institutional zones
• Visual Clarity - Clean, professional appearance
• Real-Time Updates - Blocks update as price action develops
Based On Professional Concepts:
• ICT Smart Money Concepts (SMC)
• Institutional order flow analysis
• Market maker behavior patterns
• Supply and demand zone theory
━━━━━━━━━━━━━━━━━━━━━━━━━━━━
📈 Upgrade Your Trading Arsenal
This free indicator gives you institutional-level order block analysis. Want more?
🔥 Check out my premium scripts for:
• Automated entries at order blocks with confirmation
• Fair Value Gap detection combined with OBs
• Multi-timeframe order block strategies
• Breaker blocks and advanced ICT concepts
• Complete smart money trading systems
• And much more...
👉 Visit my profile to trade like institutions!
━━━━━━━━━━━━━━━━━━━━━━━━━━━━
📝 Important Notes
• Order blocks are high-probability zones, not guarantees
• Always use confirmation (price action patterns)
• First touch of OB is most reliable (60-70% win rate)
• Mitigated blocks are much weaker (30-40% win rate)
• Works best during high-volume sessions
• Combine with proper risk management (1-2% risk per trade)
• Not all OBs are created equal - look for confluence
• Practice on demo before trading live
• Past performance doesn't guarantee future results
Learning Curve:
• Week 1-2: Learn to identify OBs and wait for retests
• Week 3-4: Practice entry confirmation and risk management
• Month 2-3: Combine with other analysis (MTF, structure, FVGs)
• Month 3+: Develop personal OB trading system
Disclaimer: For educational purposes only. Order block trading requires practice and proper risk management. Always do your own research.
━━━━━━━━━━━━━━━━━━━━━━━━━━━━
🙏 Support This Work
If this indicator helps you trade with institutions:
• ⭐ Give it a thumbs up
• 💬 Share your best order block trades in comments
• 🔔 Follow for more free ICT/SMC tools
• 🚀 Share with traders learning smart money concepts
Questions about order blocks? Drop a comment and I'll explain!
━━━━━━━━━━━━━━━━━━━━━━━━━━━━
Developed with ❤️ for traders who want to see what institutions see
━━━━━━━━━━━━━━━━━━━━━━━━━━━━
Version History
• v1.0 - Initial release with auto-timeframe detection and ATR-based strength filtering

CRR - Smart Money Concept (Pro Expo)Detects Market Structure
Finds pivots using Structure Period.
Marks:
HH (Higher High), LH (Lower High)
HL (Higher Low), LL (Lower Low)
Can draw swing points at highs and lows.
Detects Structure Breaks
When the price breaks the last swing:
BMS (Break of Market Structure) → continuation.
ChoCH (Change of Character) → possible trend reversal.
Differentiates between strong and weak movements using filters.
Confirmation Filters (optional)
If useFilters is enabled, to validate breaks it uses:
ATR → the close must cross the level by at least atrMult * ATR.
Volume → the current volume must be > volMult * average volume.
MACD → in the direction of the break.
Gap → avoids some false breakouts due to gaps.
Internal Fibonacci Retracement of the Last Range
Draws 38.2%, 50%, and 61.8% between the last swing high and swing low.
Serves as internal bounce/discount/premium zones.
Current Range
Draws two dashed yellow lines:
Top: last swing High.
Bottom: last swing Low.
Shows you the range where the price is currently trading.
🧩 In short:
This script draws complete SMC structure (HH/HL/LL/LH + BMS + ChoCH), validates breakouts with ATR, volume, MACD, and gaps, and also displays internal Fibonacci retracement + current range, all automatically and cleanly.

SYXX - HTF Candle Overlay
This script, titled "HTF Candle Overlay by SYXX," is designed to visualize the full range and structure of a higher-timeframe (HTF) candle directly onto a lower-timeframe chart. It helps traders maintain context by showing where the current price action sits relative to a much larger candle's boundaries. Combined with LuxAlgo Volume Node Profile.
1. 🔍 Primary Feature: Higher Timeframe Candle Projection
Configurable Timeframe: The user sets the desired HTF using the Interval input, which defaults to 'D' (Daily). The indicator then tracks the High, Low, Open, and Close of that HTF bar.
Live and Historical Drawing: The script uses box.new to draw boxes representing the candle's full range (High to Low).
Historical Boxes (if changeHTF): When a new HTF candle closes, the completed box for the previous period is drawn.
Live Box (if barstate.islast): The indicator draws a live, dynamic box for the current, incomplete HTF candle, which expands with every new High or Low on the lower chart.
2. 🎨 Visualization & Customization
Color-Coded Bias: The boxes are colored based on the HTF candle's direction:
Bullish/Long (BgLong): Green color is used if the HTF candle closed higher than it opened (close > htfOpen).
Bearish/Short (BgShort): Red color is used if the HTF candle closed lower than it opened.
Box Styling: Users can customize the box's appearance, including border color and style, border thickness, and background opacity (BoxOpacity).
Midline: An optional MidLine is calculated as the average of the HTF High and Low, acting as a potential support/resistance reference point.
Range Display: The indicator can display the range of the box in pips (BoxRangePips) or the percentage of movement relative to the full range (BoxRangePercentage).
Time Labels: It plots time labels that show the start and end time of the completed HTF period (e.g., "07:00 - 11:00").
3. 🚨 Alert System (Placeholders)
The script includes placeholder inputs for standard trading alerts, though the internal logic for checking these conditions is currently commented out or set to false:
Alert: Break Above/Below Box: To signal a breakout of the HTF High or Low.
Alert: Price Re-Enters Box: To signal a pullback back into the range.

Volume Profiles on Weekly TWAP and Zscore ColoringThis indicator takes (DeadCats) volume profile and starts a new profile when price reaches a new Weekly TWAP line or deviation line.
The candles are also colored by Z score based on the 5 deviations from the Daily TWAP, which is anchored from previous days settlement time, 14:59:30CT. The max number of deviations can be changed in the settings to change the sensitivity of the z score coloring.

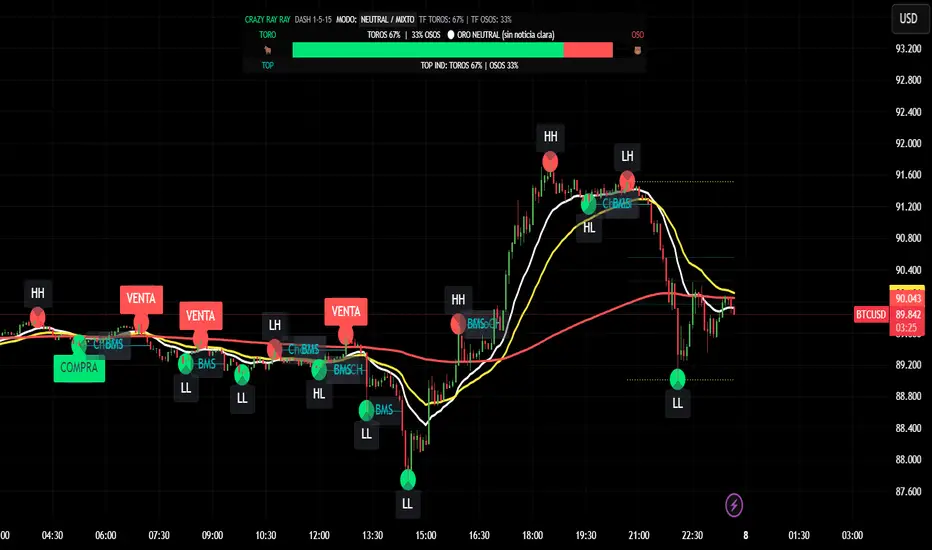
CRR - GANAEMAs on the chart (visual trend)
EMA 15 (white), 30 (yellow), 200 (red).
2️⃣ DASH Engine 1m–5m–15m (+ 1H and 1D)
For each TF (1m, 5m, 15m) it calculates a bull/bear score using:
EMA structure (15, 30, 50, 100, 200).
MACD.
RSI.
Relationship with EMA 30 and VWAP.
FVG in favor.
ATR change (volatility **increasing**).
From this it derives:
t1 (1m), t2 (5m), t3 (15m),
t4 (1H) and t5 (1D) (only for EMA200).
It detects:
ALL BULL → “BULLISH - BUYS ONLY”.
ALL BEAR → “BEARISH - SELLS ONLY”.
Otherwise → “NEUTRAL / MIXED”.
In addition:
Calculates BULL TF vs BEAR TF (%) between 1m–5m–15m.
Displays a visual bar 🐂🟩 vs 🐻🟥.
3️⃣ GOLD News (manual)
Special bar that says:
Neutral
BUY (positive)
SELL (negative)
Paints the HUD with color according to the news you select.
4️⃣ NO RETRACEMENT Alerts (beast mode 💣)
Very strict conditions using the 5 TFs:
BUY NO RETRACEMENT if:
4 or more TFs in bull mode (bullTF_all >= 4),
1m ultra bull (EMA bull, RSI>60, MACD bull, high volume, price above EMA15 and VWAP, FVG ≥ 0).
SELL NO RETRACEMENT is the same but bearish.
Creates alerts:
CRR BUY NO RETRACEMENT
CRR SELL NO RETRACEMENT
5️⃣ PRO LITE Patterns: Double Top / Double Bottom
Detects double tops and double bottoms with:
Minimum bar distance.
Tolerance in %. Optional filters:
MACD, RSI, ATR (volatility), volume, FVG.
If everything aligns:
Plots SELL at double top.
Plots BUY at double bottom.
6️⃣ TOP Indicators Block (SMI + WaveTrend + Supertrend)
SMI (momentum), WaveTrend, and Supertrend:
Counts which are in bull mode and which are in bear mode.
Displays:
TOP IND: BULLS XX% | BEARS YY%.
7️⃣ Integrated Internal SMC Module
Structure HH, LH, HL, LL.
BMS (break of structure) and ChoCH (change of character).
Filter with ATR + volume + MACD + gaps.
Internal Fibonacci of the last range (38.2, 50, 61.8).
Dotted yellow lines of the current range (swing high/low).
🧠 In short:
It's your command center for XAUUSD:
Global mode (buy only / sell only / mixed),
% of timeframes favoring bulls/bears,
gold news,
no-lag alerts,
filtered double top/bottom,
TOP indicators,
and complete SMC (structure + BMS/ChoCH + Fibonacci + range)...
all integrated into a single CRAZY RAY RAY HUD
Smart Money Tracker [Eˣ]💰 Smart Money Tracker - Free Indicator
Overview
The Smart Money Tracker helps you identify when institutional traders (banks, hedge funds, and large players) are actively buying or selling. By analyzing unusual volume patterns and price action, this indicator reveals hidden accumulation and distribution zones that often precede major price moves.
━━━━━━━━━━━━━━━━━━━━━━━━━━━━
🎯 What This Indicator Does
Tracks Institutional Activity:
• Detects when "smart money" is accumulating (buying) at support levels
• Identifies when institutions are distributing (selling) at resistance levels
• Shows real-time buying and selling pressure through volume analysis
• Highlights bars where unusual institutional activity is detected
Visual Signals:
• 🟢 Green Circles Below Bars = Accumulation Zone (institutions buying at lows)
• 🔴 Red Circles Above Bars = Distribution Zone (institutions selling at highs)
• Green Background Tint = Strong buying pressure detected
• Red Background Tint = Strong selling pressure detected
• Dashed Lines = Key institutional levels to watch
Money Flow Histogram:
• Shows buying vs selling pressure in real-time
• Scale from -100 (extreme selling) to +100 (extreme buying)
• Green bars = Net buying pressure
• Red bars = Net selling pressure
━━━━━━━━━━━━━━━━━━━━━━━━━━━━
📊 How To Use This Indicator
Basic Usage
1. Look For Accumulation Signals (🟢)
• Green circles appear when institutions are buying at support
• These zones often mark the end of pullbacks
• Price typically bounces from these levels
• Trading Signal: Consider long positions when accumulation appears at key support
2. Watch For Distribution Signals (🔴)
• Red circles appear when institutions are selling at resistance
• These zones often mark local tops
• Price typically reverses from these levels
• Trading Signal: Consider taking profits or short positions when distribution appears at resistance
3. Monitor The Pressure Histogram
• Values above +20 = Strong buying pressure (bullish)
• Values above +5 = Moderate buying pressure
• Values between -5 and +5 = Neutral/ranging
• Values below -5 = Moderate selling pressure
• Values below -20 = Strong selling pressure (bearish)
4. Check The Info Panel (Top Right)
• Status: Quick summary of current market pressure
• Pressure: Numerical value of buying/selling force
• Volume: Current volume status (High/Normal)
• Accumulation Count: Number of accumulation signals in last 20 bars
• Distribution Count: Number of distribution signals in last 20 bars
━━━━━━━━━━━━━━━━━━━━━━━━━━━━
💡 Trading Strategies
Strategy 1: Accumulation Bounce
1. Wait for green accumulation circle at support level
2. Confirm with positive money flow histogram
3. Enter long when price bounces from accumulation zone
4. Set stop loss below the accumulation level
Strategy 2: Distribution Reversal
1. Watch for red distribution circle at resistance
2. Confirm with negative money flow histogram
3. Consider taking profits on longs or entering shorts
4. Set stop loss above the distribution level
Strategy 3: Pressure Divergence
1. Price making new highs but histogram declining = Bearish divergence
2. Price making new lows but histogram rising = Bullish divergence
3. These often signal trend exhaustion and reversals
Strategy 4: Zone Confluence
1. When accumulation zones align with major support = High probability long
2. When distribution zones align with major resistance = High probability short
3. Multiple signals at same level = Institutional interest confirmation
━━━━━━━━━━━━━━━━━━━━━━━━━━━━
⚙️ Settings Explained
Volume Analysis Length (Default: 20)
• Lookback period for calculating average volume
• Lower values = More sensitive to recent volume spikes
• Higher values = Smoother, less sensitive to noise
• Recommended: 14-20 for day trading, 20-30 for swing trading
Smart Money Threshold (Default: 1.5)
• Multiplier for detecting "unusual" volume
• Lower values = More signals (more sensitive)
• Higher values = Fewer signals (only extreme volume)
• Recommended: 1.3-1.5 for volatile markets, 1.5-2.0 for calmer markets
Show Accumulation/Distribution Zones
• Toggle ON/OFF the dashed zone lines
• Keep ON to track key institutional levels
Show Smart Money Labels
• Toggle ON/OFF the zone labels
• Turn OFF for cleaner chart appearance
Show Pressure Histogram
• Toggle ON/OFF the money flow histogram
• Keep ON to see real-time pressure gauge
━━━━━━━━━━━━━━━━━━━━━━━━━━━━
🎓 Understanding The Methodology
What Is "Smart Money"?
Smart money refers to institutional traders, banks, hedge funds, and large players who have significant capital and often move markets. These players:
• Buy during weakness (accumulation)
• Sell during strength (distribution)
• Create support and resistance zones
• Their activity precedes major moves
How The Indicator Detects Smart Money:
1. Volume Analysis: Compares current volume to average volume to detect unusual activity
2. Price Action: Analyzes candle closes, wicks, and position within the range
3. Context: Identifies if activity happens at key swing highs or lows
4. Flow Calculation: Measures directional volume flow (buying vs selling)
Why This Works:
• Institutions cannot hide large orders - they create volume spikes
• Accumulation at lows shows conviction in higher prices
• Distribution at highs shows institutions taking profits
• Following smart money increases probability of success
━━━━━━━━━━━━━━━━━━━━━━━━━━━━
📱 Alert Setup
This indicator includes 4 built-in alert types:
1. Accumulation Detected - Fires when institutions buy at support
2. Distribution Detected - Fires when institutions sell at resistance
3. Strong Buying Pressure - Fires when pressure histogram exceeds +30
4. Strong Selling Pressure - Fires when pressure histogram drops below -30
To Set Up Alerts:
1. Click the "Alert" button (clock icon) in TradingView
2. Select "Smart Money Tracker" from the indicator dropdown
3. Choose your alert condition
4. Configure notification settings
5. Click "Create"
━━━━━━━━━━━━━━━━━━━━━━━━━━━━
💎 Pro Tips
✅ Best Timeframes: Works on all timeframes, but most effective on 15min, 1H, 4H, and Daily
✅ Combine With: Support/resistance levels, trend indicators, or your existing strategy
✅ Volume Matters: Signals are stronger on higher timeframes with significant volume
✅ Multiple Signals: Repeated accumulation/distribution at same level = Strong institutional interest
✅ Market Context: Use alongside broader market trend analysis for best results
⚠️ Avoid: Low volume periods, major news events (false signals possible), and over-relying on single indicator
━━━━━━━━━━━━━━━━━━━━━━━━━━━━
🚀 What Makes This Different?
Unlike basic volume indicators, Smart Money Tracker:
• Contextual Analysis - Doesn't just measure volume, but WHERE and HOW it occurs
• Visual Clarity - Instant visual feedback on institutional activity
• Multi-Layered - Combines volume, price action, and flow analysis
• Actionable - Clear zones and signals for trading decisions
• Professional Grade - Uses techniques from institutional trading desks
━━━━━━━━━━━━━━━━━━━━━━━━━━━━
📈 Upgrade Your Trading
This free indicator gives you institutional-level insights. Want more?
🔥 Check out my premium scripts for:
• Automated entry and exit signals
• Advanced multi-timeframe analysis
• Dynamic stop loss management
• Backtested strategies with performance stats
• And much more...
👉 Visit my profile to see all available tools!
━━━━━━━━━━━━━━━━━━━━━━━━━━━━
📝 Notes
• This indicator works best as part of a complete trading system
• Always use proper risk management and position sizing
• Past performance does not guarantee future results
• Consider combining with other forms of analysis
• Test thoroughly on demo accounts before live trading
━━━━━━━━━━━━━━━━━━━━━━━━━━━━
🙏 Support This Work
If you find this indicator helpful:
• ⭐ Give it a thumbs up
• 💬 Leave a comment with your experience
• 🔔 Follow for more free tools and updates
• 🚀 Share with fellow traders
Questions? Drop a comment below and I'll help you out!
━━━━━━━━━━━━━━━━━━━━━━━━━━━━
Developed with ❤️ for the TradingView community
━━━━━━━━━━━━━━━━━━━━━━━━━━━━
Version History
• v1.0 - Initial release with core smart money detection features

X FP Imbalancesprovides advanced volume profile analysis by isolating and visualizing market aggression at a granular price level. It is a powerful tool for short-term and intraday traders seeking objective confirmation of supply and demand dynamics, primarily used to identify high-probability reversal or continuation points based on order flow principles.
Key Functionality and Methodology
The indicator operates by transforming standard time-based candle data into a Volume-at-Price footprint, focusing specifically on aggressive market activity.
Granular Aggression Measurement (Delta)
The script dynamically segments the price range into discrete price levels (tickAmount). This granularity is controlled either by a user-defined fixed tick count or automatically adjusted using the Average True Range (ATR) to adapt the box size to current market volatility.
The script uses lower timeframe data (e.g., 1-minute bars) to accurately distribute the total volume into each price level, distinguishing between aggressive buying (Up Volume) and aggressive selling (Down Volume).
The core output is Delta, which is the net difference between aggressive buying and aggressive selling at each price level.
Stacked Imbalance Identification
The indicator identifies an imbalance when the volume from one side (e.g., aggressive buyers) overwhelms the total volume at that level by a user-defined percentage (imbalanceP).
A single price level where the Delta percentage exceeds the threshold is defined as an Imbalance.
The Stacked Imbalance is the primary signal, triggered when the imbalance is detected on a user-defined number of consecutive price levels (stacked) in the same direction (e.g., 3 consecutive levels of aggressive buying). This signals a high-conviction structural break or strong rejection.
Stacked imbalances are visually highlighted and can trigger real-time alerts upon bar close.
Strategic Applications
This indicator is invaluable for traders who integrate order flow concepts into their decision-making process.
One-Sided Stack (Supply/Demand Zone): Aggressive selling (Red Stack) at a high price, followed by price reversal, identifies a Structural Supply Zone (Resistance). The level is where sellers aggressively rejected demand, leaving an untested area of supply.
Overlapping Stacks (Climax Reversal): Consecutive Buy Stacks followed immediately by Sell Stacks in a tight range signals Buyer Exhaustion and an immediate Climax Reversal. The buying power was absorbed and instantly overwhelmed by waiting supply.
Absence of Stack: When price moves sharply through a level without creating any Stacked Imbalances, it suggests an Orderly Move or Liquidity Void. The absence of resistance means the market move is structurally weak and often vulnerable to a retest.
The choice between a Fixed Tick Distance (for micro-pattern precision) and ATR-based sizing (for volatility-adjusted analysis) allows the user to tailor the indicator to specific asset classes and trading styles.

Volume Profile on Grid with Zscore ColoringThis indicator takes (DeadCatCode) volume profile and starts a new profile when price reaches a new Grid Interval, chosen in the settings.
The candles are also colored by Z score (colors pulled from ChartPrime) based on the 5 deviations from the Daily TWAP, which is anchored from previous days settlement time, 14:59:30CT. The max number of deviations can be changed in the settings to change the sensitivity of the z score coloring.

Volume Threshold Levels - Crypto LidyaVolume Threshold Levels – Crypto Lidya
Understanding volume behavior is one of the most effective ways to detect trend changes, manipulation candles, aggressive entries, and institutional activity.
Volume Threshold Levels (VTL) not only displays raw volume but also calculates dynamic volume thresholds (2x – 3x – 4x) based on the moving average, allowing you to identify statistically meaningful volume anomalies with precision.
📌 1. Volume Columns
The indicator plots each bar’s volume using traditional column-style visualization.
Green: Bullish candle
Red: Bearish candle
Gray: Neutral candle
This helps traders clearly understand the relationship between price and volume.
📌 2. Average Volume Area
VTL offers two types of moving averages for volume:
SMA (Simple Moving Average)
EMA (Exponential Moving Average)
The average volume is drawn as a soft yellow area across the chart.
This area acts as the baseline for normal volume levels.
📌 3. Dynamic Threshold Lines (2x / 3x / 4x)
The script calculates and displays multipliers of the average volume:
2x Average
3x Average
4x Average
These levels appear as bright yellow lines.
They are extremely useful for identifying breakouts, traps, and aggressive institutional entries.
📌 4. Volume Spike Detection (Alerts)
VTL identifies upward crossovers where volume breaks above key levels:
1x Volume Signal
2x Volume Signal
3x Volume Signal
4x Volume Signal
These can be used directly as TradingView alerts.
This allows you to automate detection of high-impact volume spikes.
📌 5. Use Cases
The indicator performs exceptionally well in:
Breakout confirmation
Liquidity sweep analysis
Detecting manipulation candles
Combining with OB, FVG, or other SMC structures
Scalping and low-timeframe aggressive volume interpretation
Algorithmic filters for volume-based strategies
📌 6. Summary
VTL delivers:
✔ Dynamic average volume baseline
✔ Clear 2x–3x–4x volume thresholds
✔ Accurate detection of upside volume explosions
✔ A strong tool for traders who rely on volume confirmation
Completely open-source and ready to be extended.

MTF EMA Hariss 369Indicators used here are Current Time Frame (CTF) and Higher Time Frame (HTF) 20 EMAs. 20 EMA is good to detect dynamic support and resistance levels. HTF EMA acts as trend filter to visualize price moment in bigger view. RVOL has also been considered to fire buy and sell signals.
Buy signal is plotted when price closes above CTF 20 EMA and CTF 20 EMA is above HTF 20 EMA and RVOL is greater than 1.5. One can adjust the RVOL value from input section depending on the class of asset. However, 1.5 is recommended for smooth trading.
Sell signal is plotted when price closes below CTF 20 EMA and CTF 20 EMA is below HTF 20 EMA RVOL is greater 1.5.
Choosing higher time frame depends upon the trading style.
CTF HTF
5m 15m
15m 1h
1h 4h
The above setting of CTF and HTF work well when combined together. However, one can choose according to trading pattern with respect to time frame.
*This is purely for educational purpose only*

VWAP Multi-Timeframe Pro [Eˣ]🎯 VWAP MULTI-TIMEFRAME PRO - The Institution's Favorite Indicator on Steroids
The Volume Weighted Average Price (VWAP) is the most widely used indicator by institutional traders, market makers, and professional desks worldwide. While most traders only monitor the Daily VWAP, professionals track multiple timeframes simultaneously to identify high-probability support/resistance zones. This indicator brings institutional-grade multi-timeframe VWAP analysis to your chart.
═══════════════════════════════════════
⚡ WHAT MAKES THIS SPECIAL
═══════════════════════════════════════
• 5 SIMULTANEOUS TIMEFRAMES: Daily, Weekly, Monthly, Quarterly, and Yearly VWAPs all visible at once
• STANDARD DEVIATION BANDS: Statistical overbought/oversold zones (similar to Bollinger Bands for VWAP)
• REAL-TIME POSITION ANALYSIS: Live table showing price position relative to each VWAP with percentage distance
• SMART CROSS DETECTION: Automatic visual markers when price crosses key VWAP levels
• OVERALL BIAS INDICATOR: Instant bullish/neutral/bearish reading based on VWAP alignment
• FULLY CUSTOMIZABLE: Colors, widths, bands, labels - tailor everything to your style
• COMPREHENSIVE ALERTS: Get notified for crosses, band touches, and key level interactions
═══════════════════════════════════════
📚 UNDERSTANDING VWAP
═══════════════════════════════════════
What is VWAP?
VWAP calculates the average price weighted by volume. Unlike simple moving averages, VWAP gives more weight to price levels where significant volume occurred. This makes it the "true average price" that institutions use to evaluate whether they're getting good fills.
Why Institutions Love VWAP:
- Algorithmic traders use VWAP as a benchmark for execution quality
- Market makers use VWAP to determine fair value
- Large funds use VWAP to minimize market impact when entering/exiting positions
- Banks and brokers measure trading performance against VWAP
The Multi-Timeframe Edge:
When multiple timeframe VWAPs align or converge, they create powerful support/resistance zones where institutions are likely to defend positions or enter new ones.
═══════════════════════════════════════
📊 HOW TO READ THE INDICATOR
═══════════════════════════════════════
VWAP LINES:
- BLUE = Daily VWAP (resets each day)
- PURPLE = Weekly VWAP (resets each week)
- ORANGE = Monthly VWAP (resets each month)
- RED = Quarterly VWAP (resets each quarter) - optional
- MAROON = Yearly VWAP (resets each year) - optional
PRICE POSITION:
- Price ABOVE VWAP = Bullish territory, buyers in control
- Price BELOW VWAP = Bearish territory, sellers in control
- Price AT VWAP = Equilibrium, decision point
STANDARD DEVIATION BANDS:
- Upper Band = Potential resistance, overbought zone
- Lower Band = Potential support, oversold zone
- 1st Band (solid dots) = 1 standard deviation (68% of price action)
- 2nd Band (crosses) = 2 standard deviations (95% of price action)
CROSS MARKERS:
- Triangles = Daily VWAP crosses
- Diamonds = Weekly VWAP crosses
- Squares = Monthly VWAP crosses
POSITION TABLE:
Shows real-time data for each active VWAP:
- Value = Current VWAP price level
- Position = Whether price is above (▲) or below (▼) with percentage distance
- Bias = Overall market sentiment based on VWAP alignment
═══════════════════════════════════════
💡 TRADING STRATEGIES
═══════════════════════════════════════
STRATEGY 1: MEAN REVERSION (Best for ranging markets)
1. Wait for price to reach upper or lower standard deviation bands
2. Look for reversal signals (candlestick patterns, divergence, etc.)
3. Enter trade expecting price to return to VWAP
4. Target = Opposite band or VWAP itself
5. Stop = Beyond the band or previous swing high/low
Example: Price reaches lower daily band + bullish engulfing → Buy, target daily VWAP
STRATEGY 2: TREND FOLLOWING (Best for trending markets)
1. Identify trend direction using higher timeframe VWAPs
2. Only take trades in direction of higher TF VWAPs
3. Enter on pullbacks to lower TF VWAP
4. Use VWAP as dynamic trailing stop
Example: Price above Weekly + Monthly VWAP (bullish) → Wait for pullback to Daily VWAP → Buy with stop below Daily VWAP
STRATEGY 3: CONFLUENCE ZONES (High probability setups)
1. Look for areas where multiple VWAPs converge (within 0.5-1%)
2. These create strong support/resistance zones
3. Trade bounces off confluence zones or breakouts through them
4. More VWAPs converging = stronger level
Example: Daily, Weekly, and Monthly VWAP all at $100 → Very strong support/resistance
STRATEGY 4: VWAP CROSSES (Momentum shifts)
1. Watch for price crossing multiple VWAPs simultaneously
2. Cross above multiple VWAPs = Bullish momentum shift
3. Cross below multiple VWAPs = Bearish momentum shift
4. Confirm with volume spike for stronger signal
Example: Price crosses above Daily + Weekly VWAP on high volume → Strong buy signal
STRATEGY 5: INSTITUTIONAL POSITIONING (For swing/position traders)
1. Focus on Weekly and Monthly VWAPs
2. These are where large institutions defend positions
3. Look for price action respect at these levels
4. Failed breaks often lead to explosive moves in opposite direction
Example: Price tests Monthly VWAP 3 times and bounces → Strong buy zone
═══════════════════════════════════════
⚙️ SETTINGS GUIDE
═══════════════════════════════════════
TIMEFRAMES SECTION:
- Toggle each timeframe on/off based on your trading style
- Customize colors to match your chart theme
- Adjust line widths for better visibility (1-5)
BANDS SECTION:
- Show Standard Deviation Bands: Enable/disable bands
- Band Multiplier: Default 1.0 (1 std dev). Increase to 1.5 or 2.0 for wider bands in volatile markets
- Band Transparency: Adjust visibility (higher = more transparent)
- Show 2nd Band Level: Enable 2 standard deviation bands for extreme zones
- 2nd Band Multiplier: Default 2.0 (2 std dev)
DISPLAY SECTION:
- Show VWAP Labels: Display D/W/M/Q/Y labels on right side of chart
- Mark VWAP Crosses: Show visual markers when price crosses VWAPs
- Show Price Position Table: Display real-time position analysis table
═══════════════════════════════════════
🎨 RECOMMENDED SETTINGS BY TRADING STYLE
═══════════════════════════════════════
DAY TRADERS / SCALPERS:
- Enable: Daily + Weekly VWAP
- Band Multiplier: 1.0
- Chart Timeframe: 1min, 5min, 15min
- Focus: Quick mean reversion plays off Daily VWAP and bands
SWING TRADERS:
- Enable: Daily + Weekly + Monthly VWAP
- Band Multiplier: 1.0 - 1.5
- Chart Timeframe: 1H, 4H, Daily
- Focus: Trade in direction of Weekly/Monthly, enter at Daily VWAP
POSITION TRADERS / INVESTORS:
- Enable: Weekly + Monthly + Quarterly VWAP
- Band Multiplier: 1.5 - 2.0
- Chart Timeframe: Daily, Weekly
- Focus: Major support/resistance at Monthly/Quarterly levels
═══════════════════════════════════════
🔔 ALERT SETUP GUIDE
═══════════════════════════════════════
This indicator includes 8 alert conditions:
VWAP CROSS ALERTS:
1. Price Crossed Above Daily VWAP - Potential bullish momentum
2. Price Crossed Below Daily VWAP - Potential bearish momentum
3. Price Crossed Above Weekly VWAP - Stronger bullish signal
4. Price Crossed Below Weekly VWAP - Stronger bearish signal
5. Price Crossed Above Monthly VWAP - Major trend shift signal
6. Price Crossed Below Monthly VWAP - Major trend shift signal
BAND ALERTS:
7. Price Reached Upper Band - Potential overbought, watch for reversal
8. Price Reached Lower Band - Potential oversold, watch for reversal
How to Set Alerts:
1. Click the "Alert" button (clock icon) at top of chart
2. Select "VWAP Multi-Timeframe Pro" from Condition dropdown
3. Choose your desired alert condition
4. Set alert name and notification preferences
5. Click "Create"
Pro Tip: Set multiple alerts for different conditions to catch all opportunities. For example, set alerts for both Daily and Weekly crosses to catch both short-term and intermediate-term setups.
═══════════════════════════════════════
💎 ADVANCED TIPS & TRICKS
═══════════════════════════════════════
1. THE VWAP MAGNET EFFECT
Price tends to gravitate back toward VWAP, especially during the first hour of trading. Use this for quick scalps: when price deviates significantly from Daily VWAP in the morning, it often returns by mid-session.
2. OPENING RANGE + VWAP
Combine VWAP with opening range high/low. When price breaks opening range while above VWAP = strong bullish setup. Breaking opening range while below VWAP = strong bearish setup.
3. VWAP RECLAIM/LOSS
- "Reclaiming VWAP" (price moves back above after being below) = bullish signal
- "Losing VWAP" (price moves back below after being above) = bearish signal
These often mark intraday trend changes.
4. MULTI-TIMEFRAME ALIGNMENT
When Daily, Weekly, AND Monthly VWAPs all point in same direction (all above or all below price), it indicates very strong trend. Trade WITH this alignment, not against it.
5. VWAP ANCHORING
Note where each VWAP resets:
- Daily = Midnight
- Weekly = Monday open
- Monthly = 1st of month
- Quarterly = Jan 1, Apr 1, Jul 1, Oct 1
- Yearly = January 1st
The first few days after a reset can show directional bias for the entire period.
6. VOLUME CONFIRMATION
VWAP crosses are more reliable when accompanied by above-average volume. A cross on low volume may be a false signal.
7. BAND WALK
In strong trends, price can "walk the bands" - staying near upper band in uptrends or lower band in downtrends. Don't blindly fade these; wait for actual reversal signals.
8. CONFLUENCE WITH OTHER INDICATORS
Combine VWAP with:
- Support/Resistance levels
- Fibonacci retracements
- Moving averages
- Volume profile levels
When VWAP aligns with other technical levels, the zone becomes even more significant.
═══════════════════════════════════════
⚠️ IMPORTANT NOTES & LIMITATIONS
═══════════════════════════════════════
VWAP RESETS:
VWAP is a cumulative calculation that resets at the start of each new period. This is standard VWAP behavior, not a bug. When you see a VWAP "jump" at midnight (Daily) or Monday open (Weekly), this is normal.
EXTENDED HOURS:
If your chart includes extended hours data, VWAP will include that data. For stocks, you may want to use regular hours only for cleaner VWAP levels.
LOW VOLUME PERIODS:
During very low volume periods (pre-market, holidays), VWAP may be less reliable as it can be easily skewed by a few large trades.
CRYPTO MARKETS:
Since crypto trades 24/7, Daily VWAP resets at midnight UTC (or your chart's timezone). Weekly VWAP resets Monday 00:00 UTC.
NOT A STANDALONE SYSTEM:
While VWAP is powerful, it should be part of a complete trading system including risk management, proper position sizing, and confirmation from other technical factors.
═══════════════════════════════════════
📈 MARKET-SPECIFIC USAGE
═══════════════════════════════════════
STOCKS / EQUITIES:
VWAP is most powerful in liquid stocks. Focus on Daily and Weekly VWAP. Institutional traders heavily use VWAP for large orders. Best during regular market hours.
CRYPTO:
Works excellent in major pairs (BTC, ETH) due to 24/7 volume. Use Daily for intraday, Weekly for swing trades. Be aware of timezone for VWAP reset.
FOREX:
Less commonly used but still effective in major pairs during liquid sessions (London/NY overlap). Focus on Daily and Weekly timeframes.
FUTURES / INDICES:
Highly effective in ES, NQ, and other liquid futures. Institutions use VWAP extensively. All timeframes relevant depending on trading style.
═══════════════════════════════════════
🎓 LEARNING RESOURCES
═══════════════════════════════════════
To deepen your understanding of VWAP:
- Study how market makers use VWAP for order execution
- Research "VWAP algorithms" used by institutional traders
- Practice identifying VWAP respect vs. rejection on historical charts
- Paper trade VWAP strategies before using real capital
- Observe how VWAP behaves in different market conditions (trending vs. ranging)
═══════════════════════════════════════
✨ FINAL THOUGHTS
═══════════════════════════════════════
VWAP Multi-Timeframe Pro brings institutional-grade analysis to retail traders. By monitoring multiple timeframes simultaneously, you can see the same levels that big money is watching and make more informed trading decisions.
Remember: VWAP is a tool, not a crystal ball. Use it as part of a comprehensive trading plan with proper risk management. The best traders use VWAP to understand WHERE institutions are positioned and HOW price is behaving relative to fair value.
This is a free, professional-grade indicator with no ads, no upsells, and no gimmicks. If you find it valuable, please give it a like and follow for more quality indicators and trading tools.
Happy trading, and may your VWAPs always be in your favor! 🎯
---
Disclaimer: This indicator is for educational purposes. Past performance does not guarantee future results. Always practice proper risk management and never risk more than you can afford to lose.

VWAP + Candle LeverageWhat if you could extract more value from each trade based on your stop loss and entry, increasing your leverage safely? Could your winning trades be even more profitable?
This indicator uses the VWAP (Volume Weighted Average Price) to calculate safe leverage per candle, allowing traders to maximize each trade within a defined stop loss. Actual profit remains variable depending on market movement and applied leverage.
How signals appear and how leverage is determined
L (green): signals that price crossed above the VWAP (potential long entry).
S (red): signals that price crossed below the VWAP (potential short entry).
Each crossover shows a label with “x”, indicating the theoretical safe leverage for that candle.
How safe leverage is calculated:
Long: close ÷ (close − candle low)
Short: close ÷ (candle high − close)
How leverage is applied:
Identify the signal candle and record close, high, and low.
Calculate the difference between the close price and the stop price (low for Long, high for Short).
The percentage difference between these prices is our safe leverage: the smaller the difference, the higher the leverage possible, always respecting the stop loss.
The “x” label shows this maximum leverage, protecting the position balance using the candle’s stop loss.
Actual profit will still depend on market movement, but the stop loss is already defined and secure.
Main benefits:
Maximize trade potential with known stop loss
Plan entries and position sizing safely
Clearly visualize safe leverage per candle
Simple, efficient, and educational
Disclaimer:
The indicator does not execute trades automatically and is not a full trading system. It is intended solely for educational purposes and safe leverage management.
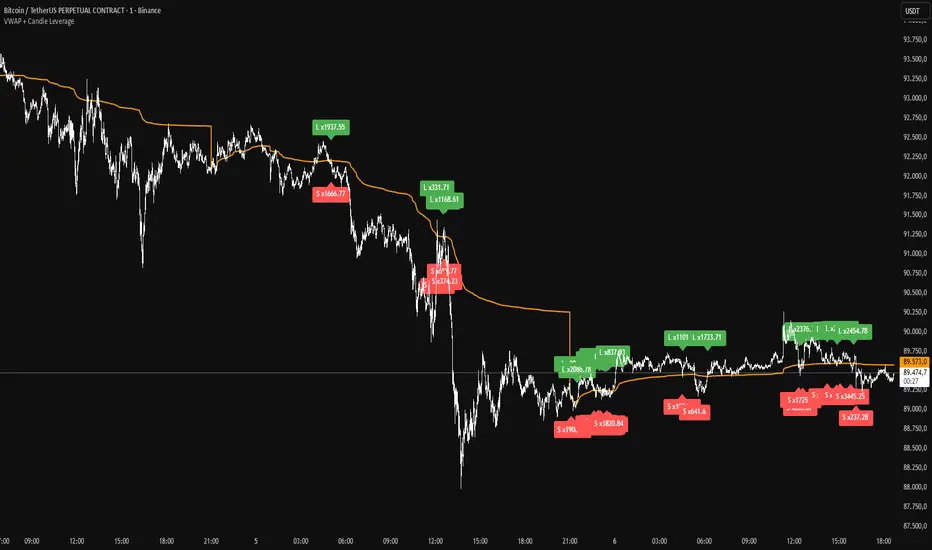
Session Dynamics & Pivot Overlay (Arjo)## **OVERVIEW**
The **Session Dynamics & Pivot Overlay (Arjo)** is a visual analysis tool that displays session-based price ranges, anchored volume-weighted averages, daily pivot levels, and smoothed trend conditions on the chart. It highlights how price interacts with custom sessions, midpoint levels, and dynamic ranges, providing a structured visual layout that helps users observe market behavior over time without implying any form of prediction or trading signal.
## **CONCEPTS**
This indicator incorporates several widely used analytical concepts:
- **Session Ranges:** Identifies user-defined time windows and visually displays their high, low, and midpoint behavior throughout the session.
- **VWAP (Morning Session):** Shows volume-weighted average price calculations for a defined morning period, assisting with visual comparison between price and weighted averages.
- **Daily Pivot Levels:** Displays R1–R2, S1–S2, central pivot, and associated levels derived from prior daily price data.
- **Trend Smoothing:** Uses SuperSmoother filtering and an additional EMA to highlight whether the smoothed trend is rising or falling.
- **EMA + ATR Bands:** Plots a 20-period EMA with upper and lower ATR-derived bands to help visualize short-term price displacement relative to average true range.
All of these elements are presented solely for structural and comparative chart analysis.
## **FEATURES**
- **Custom Session Visualization:** Automatically draws session boxes, capturing the evolving high, low, and midpoint throughout the defined intraday window.
- **Dynamic Midline Calculation:** A midpoint line is updated continuously during the session to visually anchor price within the session’s range.
- **Morning Session VWAP:** Displays a dedicated VWAP line for the morning window with adjustable source and configuration options.
- **Daily Pivot Lines:** Automatically plots pivot, BC/TC, R1–R2, and S1–S2 levels with customizable colors, widths, and line styles.
- **Trend-Responsive Pivot Display:** Optionally toggles visibility of R2 or S2 depending on the direction of the smoothed trend.
- **EMA + ATR Zones:** Renders a 20-EMA and ATR-based support/resistance zone using filled regions for enhanced visual clarity.
- **Full Customization:** Multiple color, transparency, line-style, and display options allow users to adapt the presentation to their charting preferences.
- **Overlay Compatible:** Designed to work directly on price charts without obstructing candles or other overlays.
## **HOW TO USE**
Users can interact with the indicator entirely through the settings panel:
- Adjust session timings to match preferred market hours or custom internal zones.
- Enable or disable the display of pivot levels, VWAP, or the ATR/EMA zone.
- Customize colors and line styles to improve visibility according to the chart background or personal preference.
- Observe how price behaves relative to the session box, midpoint, VWAP, and pivot levels for contextual understanding.
- Utilize the smoothed trend condition to see when the indicator chooses to display certain pivot extensions.
These elements help users interpret chart structure, volatility, and intraday behavior in a visually organized manner.
## **CONCLUSION**
The ** Session Dynamics & Pivot Overlay (Arjo) ** indicator offers a consolidated view of session structure, pivot levels, VWAP, and smoothed trend conditions. Its purpose is to improve visual clarity and assist users in understanding market context without issuing directives or trade suggestions. It functions as an educational tool that enhances chart interpretation and supports structured analysis.
---
## **DISCLAIMER**
This indicator is for educational and visual analysis purposes only. It does not provide trading signals, financial advice, or guaranteed outcomes. Users should conduct their own research and consult a licensed financial professional when necessary. All trading decisions are solely the responsibility of the user.
Happy Trading (Arjo)

Fabio-Style Order Flow SystemFabio-Style Order Flow System — LVN • Delta • Big Trades • FVG • Order Blocks • Liquidity • Volume Profile
This indicator brings together all major components of Fabio Valentino’s order-flow strategy in one unified tool. It visualizes where smart money is active, where inefficiencies form, and where price is likely to react next.
🔍 FEATURES
1. Order Flow & Delta
Smoothed delta to show true market imbalance
Background color shifts to bullish/bearish delta dominance
Alerts for delta spikes & order-flow flips
2. Big Trade Detection
Highlights Big Buy and Big Sell prints (relative to average volume)
Helps identify institutional aggression on both sides
3. Low Volume Nodes (LVNs)
Automatically detects low-volume zones
Flags retests of LVNs for high-probability reactions
Uses dynamic volume thresholds for accuracy
4. Volume Profile (Lightweight)
Bucket-based intrabar profile across user-defined lookback
Highlights volume distribution without heavy TradingView CPU load
Auto-scales bucket density & transparency
5. Fair Value Gaps (FVGs)
Detects both bullish & bearish three-bar imbalances
Marks gaps visually using colored boxes
Updates dynamically with a user-set lookback
6. Order Blocks (OBs)
Identifies valid displacement bars and their origin OB
Plots clean, minimalist rectangles around key OB zones
Uses ATR-based impulse filtering
7. Liquidity Grabs
Detects wick-based liquidity sweeps
Highlights both equal high/low and stop-run type wicks
Useful for spotting reversals & trap setups
8. Strategy Dashboard
Shows real-time order flow state
Displays delta strength, big trades, LVNs, and last directional impulse
Auto-positions in all corners
🎯 PERFECT FOR
Traders who use:
Order Flow
Smart Money Concepts (SMC)
ICT / FVG / Liquidity models
Market Structure + Volume
Fabio Valentino-style analysis
⚙️ PERFORMANCE
All elements optimized
Uses automatic box-clearing to avoid array overload
Works on all timeframes & markets (crypto, FX, indices, stocks)

CRR - Gaps + FVG PROUses ATR
Calculates ATR and, with minAtrR, defines the minimum size for a GAP or FVG to be considered valid.
Detects and draws GAPs between candles
Bullish GAP: low > high (upward gap).
Bearish GAP: high < low (downward gap).
Draws a box between the previous and current candle.
The box can be extended to the right.
If the price fills the gap (touches it), and autoDelGap is active, the box is deleted (mitigated).
Only saves and manages the last bullish GAP and the last bearish GAP.
Detects and draws FVG (3-candle imbalance)
Bullish FVG: high < low → liquidity gap below.
Bearish FVG: low > high → liquidity gap above.
Draws a box for the gap between candle 2 and the current candle.
The box can be extended to the right.
When the price completely enters the zone (fills it), if autoDelFVG is active, the box is deleted (mitigated).
Only monitors the last bullish FVG and the last bearish FVG.
🧠 In simple terms:
It marks GAPs and FVG imbalance zones on the chart, extends them to the right, and automatically deletes them when the price mitigates/fills those zones.

ADX with Customisable LevelsADX with Customisable Levels.
25 for strong trend
50 for Very strong trend
75 for unsustainable strong trend.

VectorCoresAI SMA + Bollinger Fusion v1VectorCoresAI — SMA + Bollinger Fusion (Free)
A clean, modern visual tool combining four key SMAs with an adaptive Bollinger structure.
This script merges two of the most widely used charting concepts into one simple, readable view:
Included
✔ SMA 21
✔ SMA 50
✔ SMA 100
✔ SMA 200
✔ Bollinger Bands with adjustable length + multiplier
✔ Adaptive “Fusion Squeeze” shading to highlight compression phases
✔ Optional visibility toggles for each SMA
✔ Lightweight, non-intrusive overlay
What this indicator is designed for
This tool helps traders quickly understand:
Trend alignment using the 21/50/100/200 SMAs
Volatility conditions around the Bollinger midline
Price compression and expansion
Early awareness of breakout environments
Clean visual structure without clutter
Everything is intentionally simple and transparent.
No predictions, no signals, no trading advice — just clean chart structure.
Why this version is unique
Instead of using standard Bollinger visuals, this Fusion edition uses subtle adaptive shading to show when the bands contract.
This makes compression zones instantly visible without overwhelming the chart.
The SMAs are fixed to widely-used trend levels, giving consistent readings across all markets and timeframes.
Who this is for
Newer traders who want a clear introduction to SMAs + Bollinger Bands
Experienced traders who want a lightweight visual tool
Anyone building structure-based strategies
Users of the VectorCoresAI suite who want a simple companion tool
Notes
This indicator is part of the VectorCoresAI Free Tools collection.
All logic is open-source and educational only.
More tools coming soon.
Volume Percentile Breakoutv2Indicates when the volume passes the desired percentile over a 3 day period of selected timeframe.


Buy Sell ProfileThis indicator attempts to count the up down movement for each price interval and color the interval by the imbalance. Works best on lower timeframes, 30 seconds or less. Set the row size to 500 and if it runs out of rows (too many price points) and breaks you can increase the row size and aggregate it.
