AVGO Advanced Day Trading Strategy📈 Overview
The AVGO Advanced Day Trading Strategy is a comprehensive, multi-timeframe trading system designed for active day traders seeking consistent performance with robust risk management. Originally optimized for AVGO (Broadcom), this strategy adapts well to other liquid stocks and can be customized for various trading styles.
🎯 Key Features
Multiple Entry Methods
EMA Crossover: Classic trend-following signals using fast (9) and medium (16) EMAs
MACD + RSI Confluence: Momentum-based entries combining MACD crossovers with RSI positioning
Price Momentum: Consecutive price action patterns with EMA and RSI confirmation
Hybrid System: Advanced multi-trigger approach combining all methodologies
Advanced Technical Arsenal
When enabled, the strategy analyzes 8+ additional indicators for confluence:
Volume Price Trend (VPT): Measures volume-weighted price momentum
On-Balance Volume (OBV): Tracks cumulative volume flow
Accumulation/Distribution Line: Identifies institutional money flow
Williams %R: Momentum oscillator for entry timing
Rate of Change Suite: Multi-timeframe momentum analysis (5, 14, 18 periods)
Commodity Channel Index (CCI): Cyclical turning points
Average Directional Index (ADX): Trend strength measurement
Parabolic SAR: Dynamic support/resistance levels
🛡️ Risk Management System
Position Sizing
Risk-based position sizing (default 1% per trade)
Maximum position limits (default 25% of equity)
Daily loss limits with automatic position closure
Multiple Profit Targets
Target 1: 1.5% gain (50% position exit)
Target 2: 2.5% gain (30% position exit)
Target 3: 3.6% gain (20% position exit)
Configurable exit percentages and target levels
Stop Loss Protection
ATR-based or percentage-based stop losses
Optional trailing stops
Dynamic stop adjustment based on market volatility
📊 Technical Specifications
Primary Indicators
EMAs: 9 (Fast), 16 (Medium), 50 (Long)
VWAP: Volume-weighted average price filter
RSI: 6-period momentum oscillator
MACD: 8/13/5 configuration for faster signals
Volume Confirmation
Volume filter requiring 1.6x average volume
19-period volume moving average baseline
Optional volume confirmation bypass
Market Structure Analysis
Bollinger Bands (20-period, 2.0 multiplier)
Squeeze detection for breakout opportunities
Fractal and pivot point analysis
⏰ Trading Hours & Filters
Time Management
Configurable trading hours (default: 9:30 AM - 3:30 PM EST)
Weekend and holiday filtering
Session-based trade management
Market Condition Filters
Trend alignment requirements
VWAP positioning filters
Volatility-based entry conditions
📱 Visual Features
Information Dashboard
Real-time display of:
Current entry method and signals
Bullish/bearish signal counts
RSI and MACD status
Trend direction and strength
Position status and P&L
Volume and time filter status
Chart Visualization
EMA plots with customizable colors
Entry signal markers
Target and stop level lines
Background color coding for trends
Optional Bollinger Bands and SAR display
🔔 Alert System
Entry Alerts
Customizable alerts for long and short entries
Method-specific alert messages
Signal confluence notifications
Advanced Alerts
Strong confluence threshold alerts
Custom alert messages with signal counts
Risk management alerts
⚙️ Customization Options
Strategy Parameters
Enable/disable long or short trades
Adjustable risk parameters
Multiple entry method selection
Advanced indicator on/off toggle
Visual Customization
Color schemes for all indicators
Dashboard position and size options
Show/hide various chart elements
Background color preferences
📋 Default Settings
Initial Capital: $100,000
Commission: 0.1%
Default Position Size: 10% of equity
Risk Per Trade: 1.0%
RSI Length: 6 periods
MACD: 8/13/5 configuration
Stop Loss: 1.1% or ATR-based
🎯 Best Use Cases
Day Trading: Designed for intraday opportunities
Swing Trading: Adaptable for longer-term positions
Momentum Trading: Excellent for trending markets
Risk-Conscious Trading: Built-in risk management protocols
⚠️ Important Notes
Paper Trading Recommended: Test thoroughly before live trading
Market Conditions: Performance varies with market volatility
Customization: Adjust parameters based on your risk tolerance
Educational Purpose: Use as a learning tool and customize for your needs
🏆 Performance Features
Detailed performance metrics
Trade-by-trade analysis capability
Customizable risk/reward ratios
Comprehensive backtesting support
This strategy is for educational purposes. Past performance does not guarantee future results. Always practice proper risk management and consider your financial situation before trading.
Volume

Low Volume Breakouts [Engr. Havery]Manipulation Happens in high volume candles, so when a Low Volume Breakout happens with the high volume candles. so we enter after the manipulation, breakout then retest

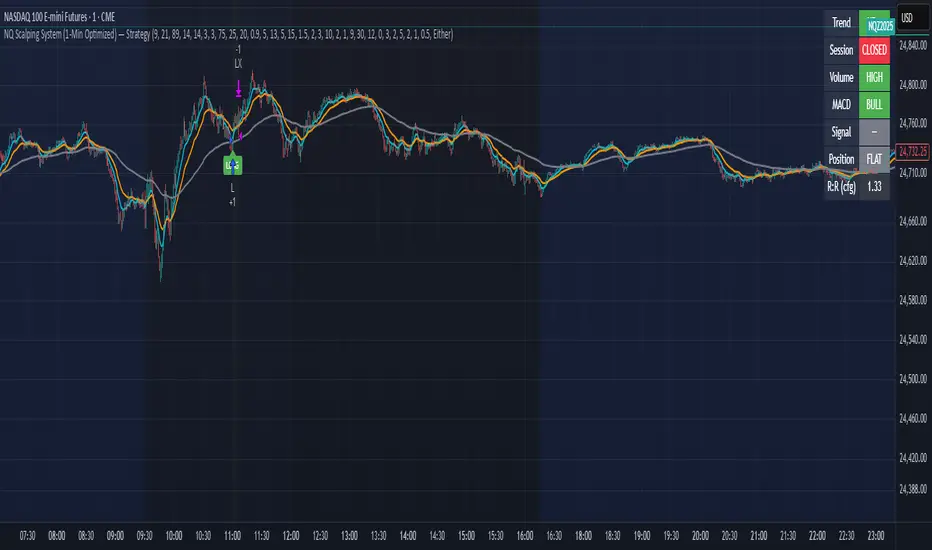
NQ Scalping System (1-Min Optimized) — StrategyNQ Scalping System — What this does (in plain English)
You’re buying pullbacks in an uptrend and selling pullbacks in a downtrend.
Trend = EMA89. Entries lean on EMA8/EMA21 touches + a StochRSI reset & cross so you’re not chasing candles. Optional Volume and MACD filters keep you out of weak moves. A time window avoids dead markets and the first noisy minute.
Long setup
Price above EMA89 (trend up)
Price pulls back to EMA8 (or EMA21 if fallback is on) by at least your Min Pullback (NQ points)
StochRSI resets to oversold and %K crosses up %D
(Optional) Volume thrust and MACD momentum confirm
Within your session window
Short = mirror image.
Exits you control
Stop/Target: ATR-based (adaptive) or fixed scalp points
Trailing stop: only arms after price moves your way by X points, then trails by your offset
Early exit options: StochRSI fade, EMA break, trend break, or opposite divergence
Quick scalp: grab a few points or bail after X bars if nothing happens
Reality check
This is a rules → orders system. It will not match eyeballed indicator labels. Fills, gaps, and trail behavior are real. That’s the point.
How I’d run it (defaults that won’t waste your time)
Use ATR stops/targets by default
EMA21 fallback = ON (you’ll miss fewer good pullbacks)
MACD filter = ON when choppy; OFF when trends are clean
Volume multiplier: start modest, bump it up if you get chopped
Session: keep RTH (e.g., 09:30–15:45 ET) and skip the first minute
Quick presets for higher timeframes
Use these as starting points and then nudge to taste.
5-Minute (intraday swings)
OB/OS: 80 / 20
Volume Multiplier: 1.3
MACD: 8 / 21 / 5
ATR Stop× / Target×: 1.8–2.2 / 2.5–3.0
Min Pullback: 1.0–1.5 pts
Quick Scalp: 6–10 pts, Bars: 12–20
Trailing: Activation 6–8 pts, Offset 3–4 pts
Divergence: Hidden ON, MTF OFF
15-Minute (session legs)
OB/OS: 85 / 15
Volume Multiplier: 1.4
MACD: 8 / 21 / 5
ATR Stop× / Target×: 2.0–2.5 / 3.0–4.0
Min Pullback: 1.5–2.5 pts
Quick Scalp: 12–18 pts, Bars: 16–30
Trailing: Activation 10–14 pts, Offset 5–6 pts
Divergence: Hidden ON, MTF ON (LTF = 5m)
30-Minute (bigger intraday trends)
OB/OS: 88 / 12
Volume Multiplier: 1.5
MACD: 12 / 26 / 9 (or 8 / 21 / 5 if you want faster)
ATR Stop× / Target×: 2.2–2.8 / 3.5–5.0
Min Pullback: 2.5–4.0 pts
Quick Scalp: 18–28 pts, Bars: 20–40
Trailing: Activation 16–24 pts, Offset 6–8 pts
Divergence: Hidden ON, MTF ON (LTF = 5m or 15m)
1-Hour (multi-hour swings)
OB/OS: 90 / 10
Volume Multiplier: 1.6–1.8
MACD: 12 / 26 / 9
ATR Stop× / Target×: 2.5–3.5 / 4.0–6.0
Min Pullback: 4–7 pts
Quick Scalp: 30–50 pts, Bars: 24–60
Trailing: Activation 28–40 pts, Offset 10–15 pts
Divergence: Hidden ON, MTF ON (LTF = 15m)
Tuning tips (read this)
Getting chopped? Raise Min Pullback, raise Volume Multiplier, leave MACD ON, and narrow your session.
Missing moves? Turn EMA21 fallback ON, lower Volume Multiplier, relax OB/OS (e.g., 75/25 on 5m).
Flat days? Use Quick Scalp and a tighter Trail Activation to lock gains.
VWAP + Multi-Timeframe RSI StrategyThis strategy combines VWAP trend direction with confirmation from RSI on a higher timeframe. The idea is to only take trades when both intraday momentum and higher-timeframe trend are aligned, increasing accuracy.
LONG Entry:
Price above VWAP (bullish environment).
RSI on the current timeframe is below overbought (room to rise).
RSI on the higher timeframe (default H1) is above 50 (bullish confirmation).
SHORT Entry:
Price below VWAP (bearish environment).
RSI on the current timeframe is above oversold (room to fall).
RSI on the higher timeframe is below 50 (bearish confirmation).
Exit Rule:
Stop-loss near VWAP.
Take-profit at ~2x risk or when major levels are reached.
Best Timeframes:
Use 15m or 30m chart with H1 RSI for intraday trading.
Use 1H chart with Daily RSI for swing trading.
⚡ The higher-timeframe RSI filter reduces false signals and aligns trades with institutional flow.

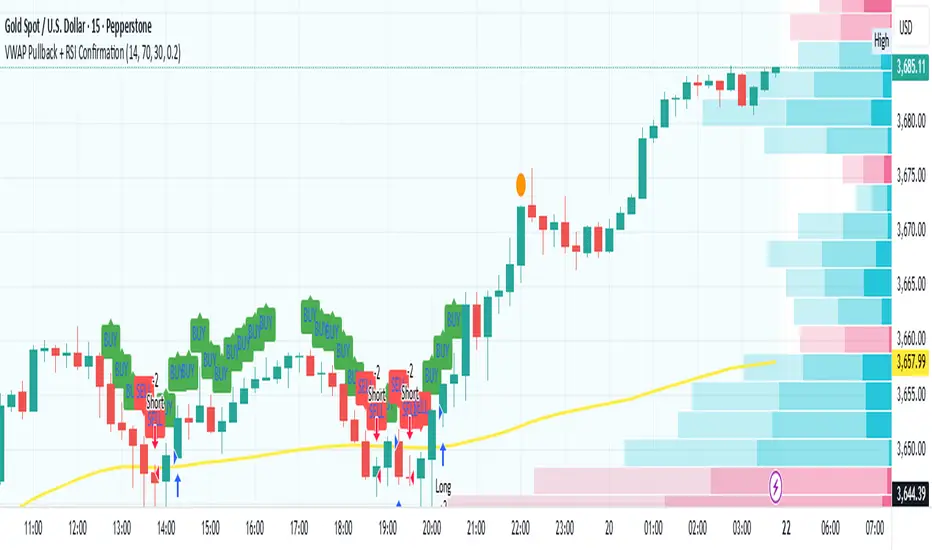
VWAP Pullback + RSI ConfirmationThis strategy focuses on trend continuation entries. Instead of betting on reversions, it looks for opportunities when price pulls back to VWAP but the dominant trend remains intact.
Trend Bias:
Price above VWAP = bullish environment → look for BUY pullbacks.
Price below VWAP = bearish environment → look for SELL pullbacks.
Entry Logic:
BUY: Price pulls back near VWAP, RSI stays above oversold (momentum intact).
SELL: Price pulls back near VWAP, RSI stays below overbought (momentum intact).
Exit Rule:
Stop-loss just below/above VWAP.
Take-profit at 1.5–2x risk (default script uses ~2%).
Best Timeframes:
15m–1H → good for intraday trend-following setups.
Daily → captures stronger, longer trends.
⚡ This strategy is powerful in trending markets because VWAP acts as a "magnet" for pullbacks, while RSI prevents overbought/oversold traps.
Nirvana True Duel전략 이름
열반의 진검승부 (영문: Nirvana True Duel)
컨셉과 철학
“열반의 진검승부”는 시장 소음은 무시하고, 확실할 때만 진입하는 전략입니다.
EMA 리본으로 추세 방향을 확인하고, 볼린저 밴드 수축/확장으로 변동성 돌파를 포착하며, OBV로 거래량 확인을 통해 가짜 돌파를 필터링합니다.
전략 로직
매수 조건 (롱)
20EMA > 50EMA (상승 추세)
밴드폭 수축 후 확장 시작
종가가 상단 밴드 돌파
OBV 상승 흐름 유지
매도 조건 (숏)
20EMA < 50EMA (하락 추세)
밴드폭 수축 후 확장 시작
종가가 하단 밴드 이탈
OBV 하락 흐름 유지
진입·청산
손절: ATR × 1.5 배수
익절: 손절폭의 1.5~2배에서 부분 청산
시간 청산: 설정한 최대 보유 봉수 초과 시 강제 청산
장점
✅ 추세·변동성·거래량 3중 필터 → 노이즈 최소화
✅ 백테스트·알람 지원 → 기계적 매매 가능
✅ 5분/15분 차트에 적합 → 단타/스윙 트레이딩 활용 가능
주의점
⚠ 횡보장에서는 신호가 적거나 실패 가능
⚠ 수수료·슬리피지 고려 필요
📜 Nirvana True Duel — Strategy Description (English)
Name:
Nirvana True Duel (a.k.a. Nirvana Cross)
Concept & Philosophy
The “Nirvana True Duel” strategy focuses on trading only meaningful breakouts and avoiding unnecessary noise.
Nirvana: A calm, patient state — waiting for the right opportunity without emotional trading.
True Duel: When the signal appears, enter decisively and let the market reveal the outcome.
In short: “Ignore market noise, trade only high-probability breakouts.”
🧩 Strategy Components
Trend Filter (EMA Ribbon): Stay aligned with the main market trend.
Volatility Squeeze (Bollinger Band): Detect volatility contraction & expansion to catch explosive moves early.
Volume Confirmation (OBV): Filter out false breakouts by confirming with volume flow.
⚔️ Entry & Exit Conditions
Long Setup:
20 EMA > 50 EMA (uptrend)
BB width breaks out from recent squeeze
Close > Upper Bollinger Band
OBV shows positive flow
Short Setup:
20 EMA < 50 EMA (downtrend)
BB width breaks out from recent squeeze
Close < Lower Bollinger Band
OBV shows negative flow
Risk Management:
Stop Loss: ATR × 1.5 below/above entry
Take Profit: 1.5–2× stop distance, partial take-profit allowed
Time Stop: Automatically closes after max bars held (e.g. 8h on 5m chart)
✅ Strengths
Triple Filtering: Trend + Volatility + Volume → fewer false signals
Mechanical & Backtestable: Ideal for objective trading & performance validation
Adaptable: Works well on Bitcoin, Nasdaq futures, and other high-volatility markets (5m/15m)
⚠️ Things to Note
Low signal frequency or higher failure rate in sideways/range markets
Commission & slippage should be factored in, especially on lower timeframes
ATR multiplier and R:R ratio should be optimized per asset

Inakis-BB-Stoch-ATR-ADX StrategyStrategy Description
This advanced trading strategy combines multiple technical indicators to identify high-probability breakout opportunities in trending markets. The system uses a multi-layered filtering approach to ensure only the strongest signals trigger trades.
Key Components:
Primary Signals:
Bollinger Bands Breakout: Identifies price extremes when price breaks below the lower band (buy) or above the upper band (sell)
Stochastic Oscillator: Confirms oversold (<30) and overbought (>70) conditions
ADX Filter: Ensures sufficient trend strength is present (ADX > 20)
ATR Volatility Filter: Trades only during periods of adequate volatility
Advanced Features:
DMI Higher Timeframe Analysis: Incorporates directional movement from higher timeframes (default 1H) to align trades with the dominant trend
Volume Confirmation: Requires above-average volume for signal validation
Cooldown Period: Prevents overtrading by enforcing minimum bars between signals
Visual Feedback: Color-coded background based on higher timeframe trend direction
Risk Management:
Fixed position sizing with customizable contract size
Predefined Stop Loss (default 500 points) and Take Profit (default 1000 points) levels
Clear risk-reward ratio of 1:2
Trading Logic:
Long Entry: Price breaks below BB lower band + Stochastic < 30 + Higher TF bullish trend
Short Entry: Price breaks above BB upper band + Stochastic > 70 + Higher TF bearish trend
All entries require confirmation from ADX, ATR, and volume filters
Customization:
All parameters are fully adjustable through the input panel, allowing traders to optimize the strategy for different markets and timeframes. Each filter can be individually enabled/disabled for testing and optimization purposes.
This strategy is designed for trending markets and performs best on liquid instruments with clear directional moves.


Structure Strategycreated to spot key area needed to take valid trades in most market conditions. use beside RSI MACD

Continuous Accumulation Strategy [DCA] v9🇬🇧 English: Continuous Accumulation Strategy v9.4
This script is a full-featured strategy designed to backtest the "Buy the Dip" or "Dollar Cost Averaging" (DCA) philosophy. Its core feature is the Dynamic Peak Detection logic, which solves the "lock-in" problem of previous versions. Instead of getting stuck on an old high, the strategy constantly adapts to the market by referencing the most recent peak.
Key Features
* Dynamic Peak Detection: You define the "Peak Lookback Period." For example, on a Daily chart, setting it to `5` references the peak of the last business week.
* Stable Order Management: The strategy consistently uses a fixed cash amount (e.g., $100) for each entry, which prevents any runtime errors related to negative equity.
* Publishing-Ready: To meet TradingView's requirement for a backtest report, this strategy executes a symbolic, one-time "dummy trade" (one buy and one sell) at the very beginning of the test period. This first trade should be ignored when analyzing performance , as its only purpose is to enable publication.
How It Works
The main logic follows an adaptive cycle: Find Dynamic Peak -> Wait for a Drop -> Buy on Crossover -> Repeat.
1. Finds the Dynamic Peak: On every bar, it identifies the highest price within your defined lookback period.
2. Calculates the Drop: It constantly calculates the percentage drop from this moving peak.
3. Executes an Entry: The moment the price crosses below a target drop percentage, it executes a buy order.
4. Continuously Adapts: As the price moves, the dynamic peak is constantly updated, meaning the strategy never gets locked and is always ready for the next opportunity.
How to Use This Strategy
* Focus on the Strategy Tester: After adding it to the chart, analyze the Equity Curve, Net Profit, and Max Drawdown to see how this accumulation philosophy would have performed on your favorite asset.
* Optimize Parameters: Adjust the "Peak Lookback Period" and "Drop Percentages" to fit the volatility of the asset you are testing.
This is a tool for testing and analyzing a "buy and accumulate" philosophy. Its main logic does not generate sell signals.

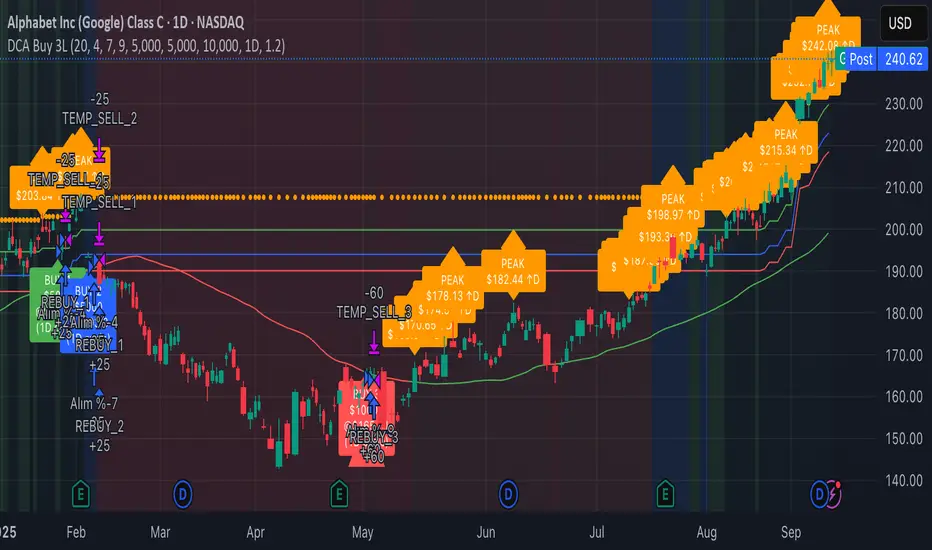
3-Level DCA Buy Strategy🎯 3-Level DCA Buy Strategy - Smart Dollar Cost Averaging
Professional DCA strategy that systematically accumulates positions during market dips. Enhanced with daily trend analysis for intelligent accumulation.
🚀 Key Features
- 3-Level Buying System: Automatic purchases at 5%, 10%, 15% drops from cycle highs
- Daily Trend Analysis: 1-day timeframe trend confirmation
- Smart Peak Detection: 100-period lookback for meaningful peaks
- Volume Filter: Optional volume confirmation system
- USD-Based Positions: Fixed dollar amounts per level
- Never Sells: Pure accumulation philosophy (buy-only)
📊 How It Works
1. Peak Identification: Detects highest price in last 100 periods
2. Daily Trend Check: Confirms price above 50 SMA on 1D timeframe
3. Drop Tracking: Calculates percentage drops from cycle high
4. Systematic Buying: Executes predetermined amounts at each level
5. Cycle Reset: Renews buy permissions when new peaks form
⚙️ Default Settings
- Buy Levels: 5%, 10%, 15% drops
- Position Sizes: $100, $150, $200
- Peak Period: 100 bars
- Higher Timeframe: 1 Day (1D)
- Pyramiding: 500 order capacity
🎨 Visual Elements
- Orange Circles: Mark cycle highs
- Colored Lines: Green/Blue/Red buy levels
- Triangle Signals: Buy point indicators
- Live Panel: Real-time statistics
- Background Colors: Trend and drop level indicators
🔔 Alert System
- Instant notifications for each buy level
- New peak detection alerts
- Major drop warnings (>20%)
- Daily trend change notifications
💡 Ideal Use Cases
- Crypto Accumulation: Bitcoin, Ethereum and major altcoins
- Stock DCA: Long-term portfolio building
- Volatile Markets: Capitalizing on price fluctuations
- Emotional Trading Prevention: Automated and disciplined buying
📈 Strategy Logic
This strategy follows the "buy the dip" philosophy. It waits during market rises and systematically builds positions during declines. Only buys when daily trend is bullish, providing protection during major bear markets.
⚠️ Important Notes
- Buy-only strategy - never sells positions
- Requires sufficient capital for multiple entries
- Most effective in trending and volatile markets
- Always backtest before live trading
- Risk management is your responsibility
🛠️ Customization Options
All parameters are fully customizable: drop percentages, position amounts, timeframes, visual elements and more. Suitable for both beginner and experienced investors.
🎯 Publishing Feature
Note: Strategy includes temporary 1-day sell cycle for TradingView publishing requirements. This feature can be disabled for normal DCA mode operation.
⭐ If you find this strategy helpful, please like and follow! Visit the profile for more trading tools.
Dynamic Swing Anchored VWAP STRAT (Zeiierman/PineIndicators)Dynamic Swing Anchored VWAP STRATEGY — Zeiierman × PineIndicators (Pine Script v6)
A pivot-to-pivot Anchored VWAP strategy that adapts to volatility, enters long on bullish structure, and closes on bearish structure. Built for TradingView in Pine Script v6.
Full credits to zeiierman.
Repainting notice: The original indicator logic is repainting. Swing labels (HH/HL/LH/LL) are finalized after enough bars have printed, so labels do not occur in real time. It is not possible to execute at historical label points. Treat results as educational and validate with Bar Replay and paper trading before considering any discretionary use.
Concept
The script identifies swing highs/lows over a user-defined lookback ( Swing Period ). When structure flips (most recent swing low is newer than the most recent swing high, or vice versa), a new regime begins.
At each confirmed pivot, a fresh Anchored VWAP segment is started and updated bar-by-bar using an EWMA-style decay on price×volume and volume.
Responsiveness is controlled by Adaptive Price Tracking (APT) . Optionally, APT auto-adjusts with an ATR ratio so that high volatility accelerates responsiveness and low volatility smooths it.
Longs are opened/held in bullish regimes and closed when the regime turns bearish. No short positions are taken by design.
How it works (under the hood)
Swing detection: Uses ta.highestbars / ta.lowestbars over prd to update swing highs (ph) and lows (pl), plus their bar indices (phL, plL).
Regime logic: If phL > plL → bullish regime; else → bearish regime. A change in this condition triggers a re-anchor of the VWAP at the newest pivot.
Adaptive VWAP math: APT is converted to an exponential decay factor ( alphaFromAPT ), then applied to running sums of price×volume and volume, producing the current VWAP estimate.
Rendering: Each pivot-anchored VWAP segment is drawn as a polyline and color-coded by regime. Optional structure labels (HH/HL/LH/LL) annotate the swing character.
Orders: On bullish flips, strategy.entry("L") opens/maintains a long; on bearish flips, strategy.close("L") exits.
Inputs & controls
Swing Period (prd) — Higher values identify larger, slower swings; lower values catch more frequent pivots but add noise.
Adaptive Price Tracking (APT) — Governs the VWAP’s “half-life.” Smaller APT → faster/closer to price; larger APT → smoother/stabler.
Adapt APT by ATR ratio — When enabled, APT scales with volatility so the VWAP speeds up in turbulent markets and slows down in quiet markets.
Volatility Bias — Tunes the strength of APT’s response to volatility (above 1 = stronger effect; below 1 = milder).
Style settings — Colors for swing labels and VWAP segments, plus line width for visibility.
Trade logic summary
Entry: Long when the swing structure turns bullish (latest swing low is more recent than the last swing high).
Exit: Close the long when structure turns bearish.
Position size: qty = strategy.equity / close × 5 (dynamic sizing; scales with account equity and instrument price). Consider reducing the multiplier for a more conservative profile.
Recommended workflow
Apply to instruments with reliable volume (equities, futures, crypto; FX tick volume can work but varies by broker).
Start on your preferred timeframe. Intraday often benefits from smaller APT (more reactive); higher timeframes may prefer larger APT (smoother).
Begin with defaults ( prd=50, APT=20 ); then toggle “Adapt by ATR” and vary Volatility Bias to observe how segments tighten/loosen.
Use Bar Replay to watch how pivots confirm and how the strategy re-anchors VWAP at those confirmations.
Layer your own risk rules (stops/targets, max position cap, session filters) before any discretionary use.
Practical tips
Context filter: Consider combining with a higher-timeframe bias (e.g., daily trend) and using this strategy as an entry timing layer.
First pivot preference: Some traders prefer only the first bullish pivot after a bearish regime (and vice versa) to reduce whipsaw in choppy ranges.
Deviations: You can add VWAP deviation bands to pre-plan partial exits or re-entries on mean-reversion pulls.
Sessions: Session-based filters (RTH vs. ETH) can materially change behavior on futures and equities.
Extending the script (ideas)
Add stops/targets (e.g., ATR stop below last swing low; partial profits at k×VWAP deviation).
Introduce mirrored short logic for two-sided testing.
Include alert conditions for regime flips or for price-VWAP interactions.
Incorporate HTF confirmation (e.g., only long when daily VWAP slope ≥ 0).
Throttle entries (e.g., once per regime flip) to avoid over-trading in ranges.
Known limitations
Repainting: Swing labels and pivot confirmations depend on future bars; historical labels can look “perfect.” Treat them as annotations, not executable signals.
Execution realism: Strategy includes commission and slippage fields, yet actual fills differ by venue/liquidity.
No guarantees: Past behavior does not imply future results. This publication is for research/education only and not financial advice.
Defaults (backtest environment)
Initial capital: 10,000
Commission value: 0.01
Slippage: 1
Overlay: true
Max bars back: 5000; Max labels/polylines set for deep swing histories
Quick checklist
Add to chart and verify that the instrument has volume.
Use defaults, then tune APT and Volatility Bias with/without ATR adaptation.
Observe how each pivot re-anchors VWAP and how regime flips drive entries/exits.
Paper trade across several symbols/timeframes before any discretionary decisions.
Attribution & license
Original indicator concept and logic: Zeiierman — please credit the author.
Strategy wrapper and publication: PineIndicators .
License: CC BY-NC-SA 4.0 (Attribution-NonCommercial-ShareAlike). Respect the license when forking or publishing derivatives.

VWAP Trend Strategy (Intraday) [KedarArc Quant]Description:
An intraday strategy that anchors to VWAP and only trades when a local EMA trend gate and a volume participation gate are both open. It offers two entry templates—Cross and Cross-and-Retest—with an optional Momentum Exception for impulsive moves. Exits combine a TrendBreak (structure flips) with an ATR emergency stop (risk cap).
Updates will be published under this script.
Why this merits a new script
This is not a simple “VWAP + EMA + ATR” overlay. The components are sequenced as gates and branches that *change the trade set* in ways a visual mashup cannot:
1. Trend Gate first (EMA fast vs. slow on the entry timeframe)
Counter-trend VWAP crosses are suppressed. Many VWAP scripts fire on every cross; here, no entry logic even evaluates unless the trend gate is open.
2. Participation Gate second (Volume SMA × multiplier)
This gate filters thin liquidity moves around VWAP. Without it, the same visuals would produce materially more false triggers.
3. Branching entries with structure awareness
* Cross: Immediate VWAP cross in the trend direction.
* Cross-and-Retest: Requires a revisit to VWAP vicinity within a lookback window (recent low near VWAP for longs; recent high for shorts). This explicitly removes first-touch fakeouts that a plain cross takes.
* Momentum Exception (optional): A quantified body% + volume condition can bypass the retest when flow is impulsive—intentional risk-timing, not “just another indicator.”
4. Dual exits that reference both anchor and structure
* TrendBreak: Close only when price loses VWAP and EMA alignment flips.
* ATR stop: Placed at entry to cap tail risk.
These exits complement the entry structure rather than being generic stop/target add-ons.
What it does
* Trades the session’s fair value anchor (VWAP), but only with local-trend agreement (EMA fast vs. slow) and sufficient participation (volume filter).
* Lets you pick Cross or Cross-and-Retest entries; optionally allow a fast Momentum Exception when candles expand with volume.
* Manages positions with a structure exit (TrendBreak) and an emergency ATR stop from entry.
How it works (concepts & calculations)
* VWAP (session anchor):
Standard VWAP of the active session; entries reference the cross and the retest proximity to VWAP.
* Trend gate:
Long context only if `EMA(fast) > EMA(slow)`; short only if `EMA(fast) < EMA(slow)`.
A *gate*, not a trigger—entries aren’t considered unless this is true.
* Participation (volume) gate:
Require `volume > SMA(volume, volLen) × volMult`.
Screens out low-participation wiggles around VWAP.
Entries:
* Cross: Price crosses VWAP in the trend direction while volume gate is open.
* Cross-and-Retest: After crossing, price revisits VWAP vicinity within `lookback` (recent *low near VWAP* for longs; recent *high near VWAP* for shorts).
* Momentum Exception (optional): If body% (|close−open| / range) and volume exceed thresholds, enter without waiting for the retest.
Exits:
* TrendBreak (structure):
* Longs close when `price < VWAP` and `EMA(fast) < EMA(slow)` (mirror for shorts).
* ATR stop (risk):
* From entry: `stop = entry ± ATR(atrLen) × atrMult`.
How to use it ?
1. Select market & timeframe: Intraday on liquid symbols (equities, futures, crypto).
2. Pick entry mode:
* Start with Cross-and-Retest for fewer, more selective signals.
* Enable Momentum Exception if strong moves leave without retesting.
3. Tune guards:
* Raise `volMult` to ignore thin periods; lower it for more activity.
* Adjust `lookback` if retests come late/early on your symbol.
4. Risk:
* `atrLen` and `atrMult` set the emergency stop distance.
5. Read results per session: Optional panel (if enabled) summarizes Net-R, Win%, and PF for today’s session to evaluate
behavior regime by regime.
⚠️ Disclaimer
This script is provided for educational purposes only.
Past performance does not guarantee future results.
Trading involves risk, and users should exercise caution and use proper risk management when applying this strategy.

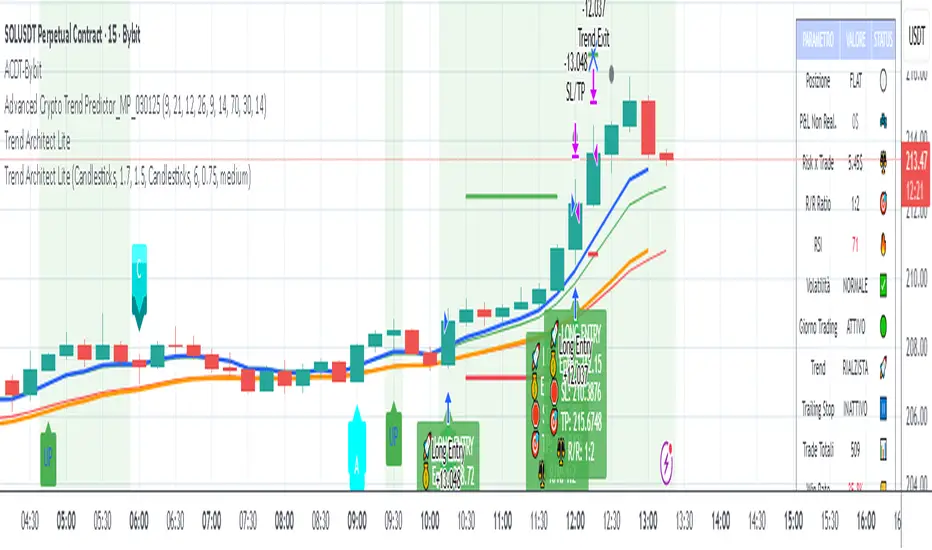
Advanced Crypto Day Trading - Bybit Optimized mapercivEMA RSI ATR MACD trading script strategy with filters for weekdays
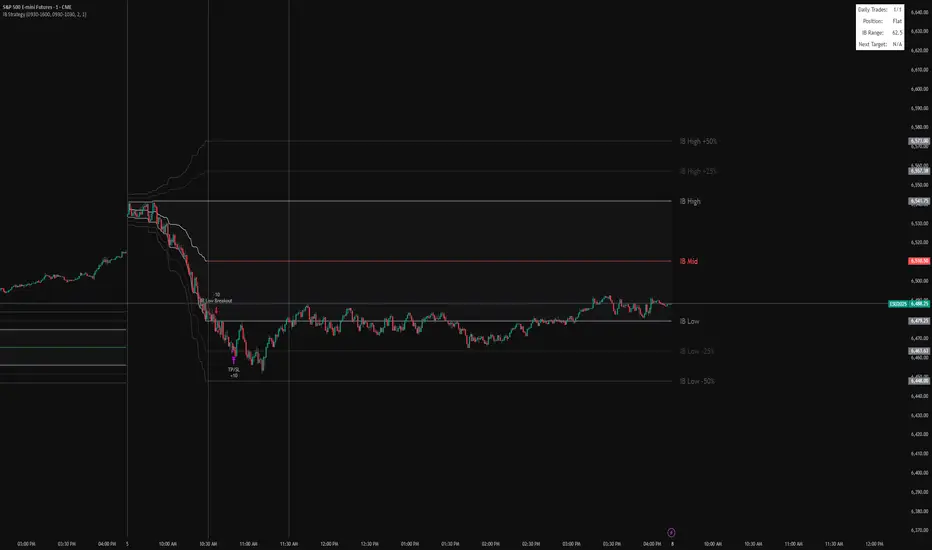
IB BreakoutIt marks the IB range (high, low, midpoint) from a chosen session window (default 9:30–10:30).
It plots the IB lines, midpoint (colored based on close), and extension levels (+/–25% and 50%).
After the IB session ends, it looks for breakouts:
Long if price closes above IB high.
Short if price closes below IB low.
Each trade targets the 25% extension in the breakout direction, with an optional stop at the opposite IB level.
It limits the number of trades per day and displays info (trades, position, IB range, next target) in a table.
AlphaFlow — Direcional Pro [Strategy] — Risk % & Dynamic EquityAlphaFlow is a directional strategy designed to capture trend shifts using a dual moving average system, enhanced with RSI and ATR regime filters, and a long-term EMA filter for confirmation.
Key Features
Dynamic Position Sizing: Risk per trade is based on a fixed % of account equity, with optional dynamic equity growth.
Stop-Loss Options: Choose between ATR-based stop or swing-point stop.
Trade Management:
TP1 is placed at a user-defined risk multiple (R).
Once TP1 is hit, an optional ATR trailing stop activates until TP2 is reached or the stop is triggered.
Visual Tools: Fast/slow EMAs, long EMA, ATR channels, and optional divergence markers for context (do not affect entries).
Backtest Ready: Includes configurable commission, capital, and position sizing.
Use Case
This strategy is built for traders who want systematic trend-following entries with structured risk management. Its modular inputs allow adaptation across assets and timeframes.
⚠️ Disclaimer: Past performance does not guarantee future results. Always validate parameters before live use.

AI Volume-KNN SuperTrend - by Trading Pine Lab🇬🇧 English
The AI Volume-KNN SuperTrend is an advanced trading strategy that combines the robustness of the SuperTrend indicator with a machine-learning inspired KNN (K-Nearest Neighbors) model. The baseline is built from a volume-weighted moving average with ATR-based bands, while the KNN classifier validates trend direction in real time. This dual-layer approach reduces false signals and improves trend confirmation.
Entries are triggered when the SuperTrend flips direction and the KNN classifier confirms the move as bullish or bearish. Exits are managed with a dynamic trailing stop, automatically adjusting to SuperTrend ± ATR × factor. The strategy includes visual markers for AI start/continuation signals, as well as customizable coloring for bullish, bearish, and neutral phases.
All parameters are fully configurable:
-Trading direction filter: Long / Short / Both.
-KNN settings: number of neighbors (K), dataset size (N).
-Label smoothing: price and SuperTrend smoothing lengths (WMAs).
-SuperTrend settings: length, ATR factor, and moving average source.
-Visualization: trend markers and per-trend coloring.

EMA inFusion Pro - Multiple SourcesEMA Fusion Pro: Dynamic Trend & Momentum Strategy with Three Exit Modes
EMA Fusion Pro is a highly customizable, multi-exit trend-following strategy designed for traders who value both precision and flexibility. By leveraging exponential moving averages (EMA), average directional index (ADX), and volume analysis, this strategy aims to capture trending market moves while offering three distinct exit modes for optimal risk management across varying market conditions.
Strategy Overview
This strategy systematically identifies potential entry points using a moving average crossover with highly configurable data sources (including price, volume, rate of change, or their Heikin Ashi versions) and filters signal quality with ADX trend strength and volume spikes. Each trade is managed with one of three advanced exit methodologies—reverse signal, ATR-based stop/take profit, or fixed percentage—giving you the control to adapt your risk profile to different market regimes.
Key Features
Customizable EMA Source: Calculate the core trend-filtering EMA from price (default), volume, rate of change, or their Heikin Ashi counterparts for unique market perspectives.
Trend Filter with ADX: Confirm entries only when the trend is strong, as measured by the user-adjustable ADX threshold.
Volume Spike Confirmation: Optional filter to only take trades with above-average volume activity, reducing false signals.
Three Exit Modes:
Reverse Signal: Exit trades when a new, opposite entry signal occurs.
ATR-Based Stop/Take Profit: Dynamic risk management using multiples of the average true range (ATR) for both take profit and stop loss.
Percent-Based Stop/Take Profit: Fixed-percentage risk management with user-defined thresholds.
Visual Annotations: Signal markers, EMA line color-coded by source, trend background coloring, and optional ATR/percent-based TP/SL levels.
Info Panel: Real-time display of all core indicators, current trading mode, exit parameters, and position status for quick oversight.
How It Works
Entry Logic: A crossover signal (above/below the EMA) triggers a new entry, but only if both ADX trend strength and (optionally) volume spike conditions are met.
Exit Logic: Three selectable modes allow you to exit trades on reverse signals, at a dynamic ATR-based profit or loss, or at a fixed percentage gain/loss.
Flexible Data Analysis: The EMA source can be chosen from six options—standard price, volume, rate of change, or their Heikin Ashi variants—allowing experimentation with different market dimensions.
Risk Management: All exits are precisely controlled, either by the next opposing signal, by volatility-adjusted levels, or by fixed risk/reward ratios.
Backtest & Optimization: The strategy is fully backtestable within TradingView’s Strategy Tester, with adjustable parameters for optimization.
Customization & Usage
Indicator Source: Select your preferred data type for EMA calculation, opening the door to creative strategy variations (e.g., volume momentum, pure price trend, rate of change divergence).
Filter Toggles: Enable/disable ADX and volume filters as desired—useful for different market environments.
Exit Mode Selection: Switch between reverse, ATR, or percent-based exits with a single parameter—ideal for adapting to ranging vs. trending markets.
Visual Clarity: The EMA line color reflects its underlying source, and the info panel summarizes all critical values for easy monitoring.
Who Should Use This Strategy?
Trend Followers seeking to ride strong moves with multiple exit options.
Experienced Traders who want to experiment with different data types (volume, momentum, Heikin Ashi) for trend analysis.
Algorithmic Traders looking for a robust, flexible base to build upon with their own ideas.
Getting Started
Apply the script to your chart and review default settings.
Customize parameters—EMA length, ADX threshold, volume settings, exit type—as desired.
Backtest on multiple instruments and timeframes to evaluate performance.
Optimize filters, exit rules, and risk parameters for your preferred trading style.
Monitor with the real-time info panel and trade alerts.
Disclaimer
This script is for educational and entertainment purposes only. It is not financial advice. Past performance is not indicative of future results. Always conduct thorough testing and consider your risk tolerance before trading real capital.
— Happy Trading —
Feel free to adapt, share, and contribute to this open-source strategy!

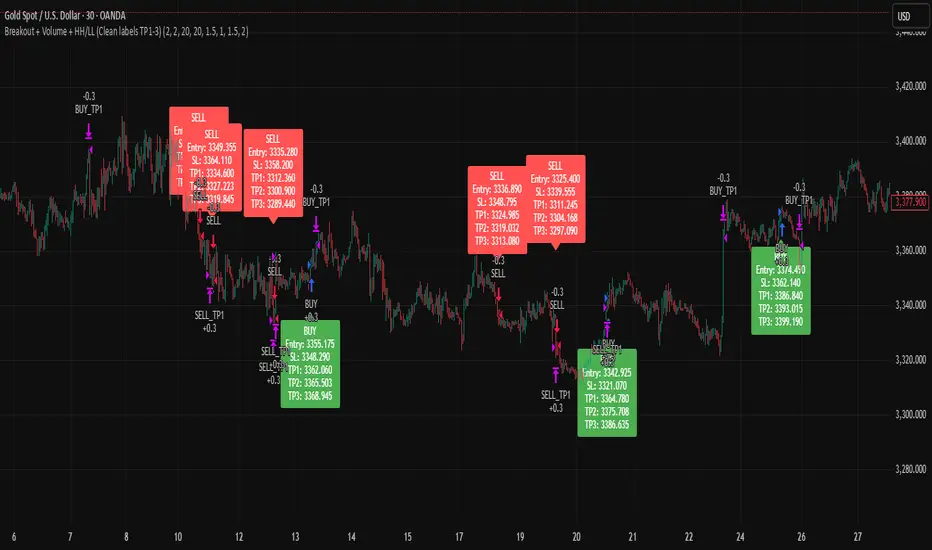
Breakout + Volume + HH/LL (Clean labels TP1-3)Breakout + Volume + HH/LL Strategy (Clean Labels)
This strategy combines breakout confirmation, volume strength, and market structure (Higher Highs / Lower Lows) to identify high-probability trade setups.
Breakout Filter: Uses a Donchian channel to detect price breakouts above resistance or below support.
Volume Confirmation: Requires volume to exceed the moving average of volume by a chosen multiplier, filtering out weak or false breakouts.
Market Structure: Long trades are only allowed if a Higher High (HH) has formed, and short trades only if a Lower Low (LL) has formed.
Trade Execution Rules:
For BUY trades: Entry at breakout, stop loss (SL) below the last pivot low, and three take profits (TP1–TP3) based on configurable risk-reward ratios.
For SELL trades: Entry at breakout, stop loss above the last pivot high, with TP1–TP3 levels set symmetrically below the entry.
Labels on Chart:
Each signal is marked with a clean label showing only:
Trade direction (BUY or SELL)
Entry price
Stop Loss
TP1, TP2, TP3
This makes the chart uncluttered while still providing all key trade information for execution or backtesting.
EMA and BB Analysis for US100 V250829This TradingView strategy generates buy and sell signals based on exponential moving average (EMA) crossovers, limited by other factors such as Bollinger Bands, volume, and EMA distance.
It uses EMAs of 16, 24, 32, and 64 periods, as well as the angles of each of these EMAs.
Entry Conditions:
EMA Crossover Entry:
When EMA16 crosses EMA64 and the following conditions are met:
EMA16, EMA24, EMA32 are aligned — for a buy signal:
EMA16 > EMA24
EMA24 > EMA32
EMA32 > EMA48
(and the opposite for a sell signal)
EMA Angles:
The angles of the EMAs must also follow the same alignment.
Divergence Entry:
When the distance between EMAs 16, 24, 32, and 48 increases.
Entry Limitations:
Once an entry is detected, it is filtered by several conditions:
When the distance between the entry candle and EMA96 is more than two candles of the maximum size over three periods.
The stop loss is set as two candles of the maximum size over three periods. If this stop loss exceeds 6,000 points (adjustable parameter), the entry is invalid.
When the price is at the edge of the Bollinger Band with a 1200-period setting (equivalent to a 1-hour Bollinger Band).
When the Bollinger Band's middle line is descending and a buy signal is triggered (and vice versa).
When volume drops below a certain threshold.
When a sideways market movement is detected.
All these entry limitations are configurable parameters and can be enabled or disabled.

Golden Cross + Support/Resistance + SL/TP + SignalsGolden Cross + Support/Resistance + SL/TP + Signals
Golden Cross + Support/Resistance + SL/TP + Signals

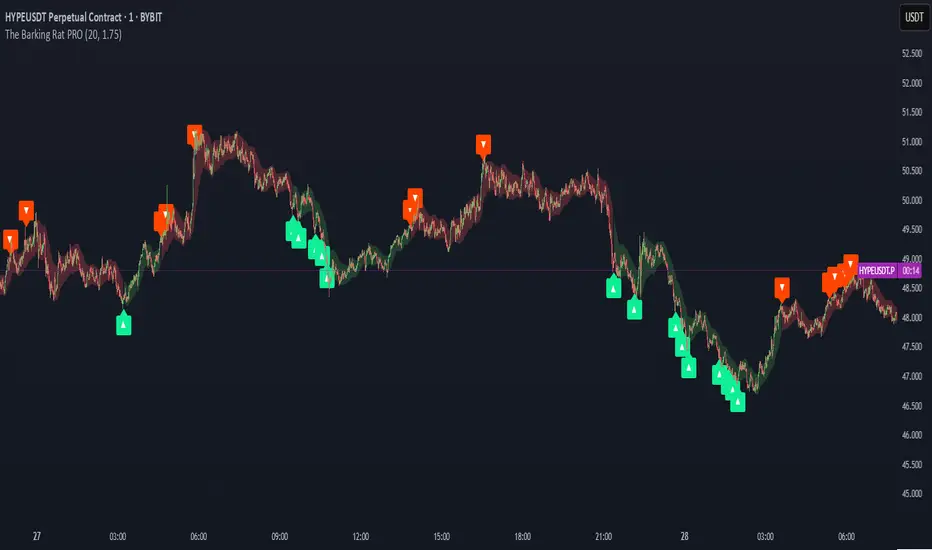
The Barking Rat PROThe Barking Rat PRO is designed around high/low pivot structure to capture meaningful market reversals. It intelligently identifies turning points by combining higher high/lower low (HH/LL) pivot detection, Fair Value Gap (FVG) confirmation, volatility-aware filters, and momentum checks. Unique features, such as a one-bar flip handler and a contextual ribbon overlay, provide traders with both clarity and precision. These tools help isolate high-probability setups while filtering out low-conviction signals, making trade opportunities easier to spot and act upon.
🧠 Core Logic: Structure-First, Filtered Reversals
The strategy takes a methodical, disciplined approach, prioritizing structural pivots over random signals. By layering multiple validation checks—structural pivots, gap confirmation, volatility filters, and momentum alignment—it highlights trades with high conviction while reducing exposure to noisy market conditions. The result is a clear, repeatable framework for reversal trading that can be applied across timeframes.
HH/LL Pivot Framework
Trades are triggered based on simple structural pivots: higher highs (HH) and lower lows (LL). When a structure flip occurs, the strategy either opens a new position or executes a one-bar delayed flip if an opposing position already exists. This ensures smooth transitions and avoids premature entries on minor market swings, keeping trading decisions focused on meaningful trend shifts.
Volatility & Distance Filters
To avoid low-quality trades, entries are validated against relative volatility, ensuring that pivots represent significant market movement. Trades must also be sufficiently spaced from previous entries and separated by a minimum number of bars, which prevents overtrading and clustered signals that can dilute performance.
Momentum Filter (RSI)
The strategy optionally aligns entries with momentum conditions using RSI. Long trades are favored when RSI is relatively low, suggesting potential exhaustion on the downside, while short trades are favored when RSI is relatively high, indicating potential overextension on the upside. This additional layer improves timing, helping traders avoid entering against strong, ongoing momentum.
Background Ribbon (Contextual Visuals)
A translucent ribbon overlays the chart to provide visual context of active trades. The ribbon displays volatility envelopes and position direction: green for long trades, red for short trades. It enhances clarity by giving traders a quick visual reference of the market environment without cluttering the chart.
Why These Parameters Were Chosen
The strategy focuses only on structurally meaningful pivots to ensure high-conviction trades.
Volatility filters confirm that trade signals are significant relative to recent price action, while FVG confirmation captures institutional-style imbalances.
Momentum and spacing rules prevent low-quality entries and overtrading, while the one-bar flip handler ensures seamless transitions when the structure reverses.
Ribbon overlays provide intuitive, real-time visualization of active trades and market context.
📈 Chart Visuals: Clear & Intuitive
- Green “▲” below a candle: Long entry triggered on LL → HH structure flip
- Red “▼” above a candle: Short entry triggered on HH → LL structure flip
- Translucent Ribbon: Green when long, Red when short
🔔 Alerts: Stay Notified Without Watching
The strategy supports real-time alerts on candle close, ensuring that only fully confirmed signals trigger notifications.
You must manually configure alerts within your TradingView account. Once set up, a single alert per instrument covers all relevant entries and exits, making hands-free monitoring simple and efficient.
⚙️ Strategy Report Properties
Position size: 25% of equity per trade
Initial capital: 10,000.00 USDT
Pyramiding: 25 entries per direction
Slippage: 2 ticks
Commission: 0.055% per side
Backtest timeframe: 1-minute
Backtest instrument: HYPEUSDT
Backtesting range: Aug 11, 2025 — Aug 28, 2025
💡Why 25% Equity Per Trade?
While it's always best to size positions based on personal risk tolerance, we defaulted to 25% equity per trade in the backtesting data — and here’s why:
Backtests using this sizing show manageable drawdowns even under volatile periods
The strategy generates a sizeable number of trades, reducing reliance on a single outcome
Combined with conservative filters, the 25% setting offers a balance between aggression and control
Users are strongly encouraged to customize this to suit their risk profile.
🔍 What Makes This Strategy Unique?
HH/LL Pivot Focus: Trades pivot structure flips instead of relying on generic indicators.
Fair Value Gap Confirmation: Only pivots supported by FVGs are acted upon, reducing noise.
One-Bar Flip Handler: Ensures clean transitions when the structure reverses, avoiding same-bar conflicts.
Volatility & Spacing Filters: Trades require sufficient movement from prior entries and minimum bar spacing to maintain quality.
Momentum-Aware Entries: RSI alignment favors entries near potential exhaustion points, improving signal reliability.
Contextual Ribbon Overlay: Visualizes volatility and active positions clearly, without cluttering the chart.
Signalgo Strategy ISignalgo Strategy I: Technical Overview
Signalgo Strategy I is a systematically engineered TradingView strategy script designed to automate, test, and manage trend-following trades using multi-timeframe price/volume logic, volatility-based targets, and multi-layered exit management. This summary covers its operational structure, user inputs, entry and exit methodology, unique technical features, and practical application.
Core Logic and Workflow
Multi-Timeframe Data Synthesis
User-Defined Timeframe: The user chooses a timeframe (e.g., 1H, 4H, 1D, etc.), on which all strategy signals are based.
Cross-Timeframe Inputs: The strategy imports closing price, volume, and Average True Range (ATR) for the selected interval, independently from the chart’s native timeframe, enabling robust multi-timeframe analysis.
Price Change & Volume Ratio: It calculates the percent change of price per bar and computes a volume ratio by comparing current volume to its 20-bar moving average—enabling detection of true “event” moves vs. normal market noise.
Hype Filtering
Anti-Hype Mechanism: An entry is automatically filtered out if abnormal high volume occurs without corresponding price movement, commonly observed during manipulation or announcement periods. This helps isolate genuine market-driven momentum.
User Inputs
Select Timeframe: Choose which interval drives signal generation.
Backtest Start Date: Specify from which date historical signals are included in the strategy (for precise backtests).
Take-Profit/Stop-Loss Configuration: Internally, risk levels are set as multiples of ATR and allow for three discrete profit targets.
Entry Logic
Trade Signal Criteria:
Price change magnitude in the current bar must exceed a fixed sensitivity threshold.
Volume for the bar must be significantly elevated compared to average, indicating meaningful participation.
Anti-hype check must not be triggered.
Bullish/Bearish Determination: If all conditions are met and price change direction is positive, a long signal triggers. If negative, a short signal triggers.
Signal Debouncing: Ensures a signal triggers only when a new condition emerges, avoiding duplicate entries on flat or choppy bars.
State Management: The script tracks whether an active long or short is open to avoid overlapping entries and to facilitate clean reversals.
Exit Strategy
Take-Profits: Three distinct profit targets (TP1, TP2, TP3) are calculated as fixed multiples of the ATR-based stop loss, adapting dynamically to volatility.
Reversals: If a buy signal appears while a short is open (or vice versa), the existing trade is closed and reversed in a single step.
Time-Based Exit: If, 49 bars after entry, the trade is in-profit but hasn’t reached TP1, it exits to avoid stagnation risk.
Adverse Move Exit: The position is force-closed if it suffers a 10% reversal from entry, acting as a catastrophic stop.
Visual Feedback: Each TP/SL/exit is plotted as a clear, color-coded line on the chart; no hidden logic is used.
Alerts: Built-in TradingView alert conditions allow automated notification for both entries and strategic exits.
Distinguishing Features vs. Traditional MA Strategies
Event-Based, Not Just Slope-Based: While classic moving average strategies enter trades on MA crossovers or slope changes, Signalgo Strategy I demands high-magnitude price and volume confirmation on the chosen timeframe.
Volume Filtering: Very few MA strategies independently filter for meaningful volume spikes.
Real Market Event Focus: The anti-hype filter differentiates organic market trends from manipulated “high-volume, no-move” sessions.
Three-Layer Exit Logic: Instead of a single trailing stop or fixed RR, this script manages three profit targets, time-based closures, and hard adverse thresholds.
Multi-Timeframe, Not Chart-Dependent: The “main” analytical interval can be set independently from the current chart, allowing for in-depth cross-timeframe backtests and system runs.
Reversal Handling: Automatic handling of signal reversals closes and flips positions precisely, reducing slippage and manual error.
Persistent State Tracking: Maintains variables tracking entry price, trade status, and target/stop levels independently of chart context.
Trading Application
Strategy Sandbox: Designed for robust backtesting, allowing users to simulate performance across historical data for any major asset or interval.
Active Risk Management: Trades are consistently managed for both fixed interval “stall” and significant loss, not just via trailing stops or fixed-day closes.
Alert Driven: Can power algorithmic trading bots or notify discretionary traders the moment a qualifying market event occurs.
