Session Dynamics & Pivot Overlay (Arjo)## **OVERVIEW**
The **Session Dynamics & Pivot Overlay (Arjo)** is a visual analysis tool that displays session-based price ranges, anchored volume-weighted averages, daily pivot levels, and smoothed trend conditions on the chart. It highlights how price interacts with custom sessions, midpoint levels, and dynamic ranges, providing a structured visual layout that helps users observe market behavior over time without implying any form of prediction or trading signal.
## **CONCEPTS**
This indicator incorporates several widely used analytical concepts:
- **Session Ranges:** Identifies user-defined time windows and visually displays their high, low, and midpoint behavior throughout the session.
- **VWAP (Morning Session):** Shows volume-weighted average price calculations for a defined morning period, assisting with visual comparison between price and weighted averages.
- **Daily Pivot Levels:** Displays R1–R2, S1–S2, central pivot, and associated levels derived from prior daily price data.
- **Trend Smoothing:** Uses SuperSmoother filtering and an additional EMA to highlight whether the smoothed trend is rising or falling.
- **EMA + ATR Bands:** Plots a 20-period EMA with upper and lower ATR-derived bands to help visualize short-term price displacement relative to average true range.
All of these elements are presented solely for structural and comparative chart analysis.
## **FEATURES**
- **Custom Session Visualization:** Automatically draws session boxes, capturing the evolving high, low, and midpoint throughout the defined intraday window.
- **Dynamic Midline Calculation:** A midpoint line is updated continuously during the session to visually anchor price within the session’s range.
- **Morning Session VWAP:** Displays a dedicated VWAP line for the morning window with adjustable source and configuration options.
- **Daily Pivot Lines:** Automatically plots pivot, BC/TC, R1–R2, and S1–S2 levels with customizable colors, widths, and line styles.
- **Trend-Responsive Pivot Display:** Optionally toggles visibility of R2 or S2 depending on the direction of the smoothed trend.
- **EMA + ATR Zones:** Renders a 20-EMA and ATR-based support/resistance zone using filled regions for enhanced visual clarity.
- **Full Customization:** Multiple color, transparency, line-style, and display options allow users to adapt the presentation to their charting preferences.
- **Overlay Compatible:** Designed to work directly on price charts without obstructing candles or other overlays.
## **HOW TO USE**
Users can interact with the indicator entirely through the settings panel:
- Adjust session timings to match preferred market hours or custom internal zones.
- Enable or disable the display of pivot levels, VWAP, or the ATR/EMA zone.
- Customize colors and line styles to improve visibility according to the chart background or personal preference.
- Observe how price behaves relative to the session box, midpoint, VWAP, and pivot levels for contextual understanding.
- Utilize the smoothed trend condition to see when the indicator chooses to display certain pivot extensions.
These elements help users interpret chart structure, volatility, and intraday behavior in a visually organized manner.
## **CONCLUSION**
The ** Session Dynamics & Pivot Overlay (Arjo) ** indicator offers a consolidated view of session structure, pivot levels, VWAP, and smoothed trend conditions. Its purpose is to improve visual clarity and assist users in understanding market context without issuing directives or trade suggestions. It functions as an educational tool that enhances chart interpretation and supports structured analysis.
---
## **DISCLAIMER**
This indicator is for educational and visual analysis purposes only. It does not provide trading signals, financial advice, or guaranteed outcomes. Users should conduct their own research and consult a licensed financial professional when necessary. All trading decisions are solely the responsibility of the user.
Happy Trading (Arjo)
Volume Weighted Average Price (VWAP)

Pro Trader SystemPro Trader System is a comprehensive trading indicator that combines multiple technical analysis tools into one powerful system. It provides clear BUY/SELL signals with a proprietary scoring system (0-100) to help traders make informed decisions across all timeframes and markets.

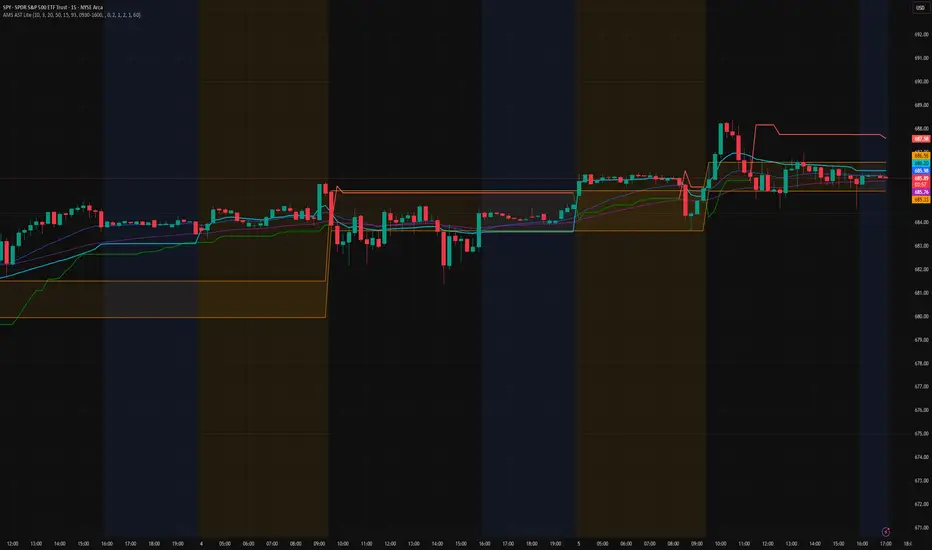
AMS Adaptive Supertrend Lite – ORB + VWAP 1.0AMS Adaptive Supertrend Lite – ORB + VWAP
This indicator focuses on providing a clean read of trend, structure, and opening range context without unnecessary complexity. It’s designed for traders who prefer straightforward visual tools that support their own decision-making process.
Consider this a small multi-tool for your basic ORB needs.
Included:
-Supertrend
A simple ATR-based Supertrend for directional context.
You can edit colors, line width, ATR settings, etc.
No signals or automation, just a clear trend reference.
-EMAs
Optional fast and slow EMAs for structural context.
Useful for gauging short-term momentum and slope.
-VWAP
A standard session VWAP.
You can style it however you like (solid, dashed, colored) in the Style tab.
-Opening Range (ORB)
Configurable ORB band including:
ORB duration (in minutes)
Optional RTH-only logic
Adjustable session window
Choice of timeframe used to build the ORB
Automatic hiding on higher timeframes (optional)
The ORB high/low are built on the selected lower timeframe and then displayed on the active chart.
-HTF Bias Shading (Optional)
A simple background tint based on EMA structure on a higher timeframe.
Meant to give gentle context, not trading signals.
Alerts
Two alerts are included:
Supertrend flipping bullish
Supertrend flipping bearish
These are notifications, not calls to action.
Intended Use
This is a visual tool for traders who want clear structure and context on their chart.
It does not provide entries, exits, strategies, or automated logic.
Disclaimer
This script is for educational and informational purposes only.
It is not financial advice, and no performance is guaranteed.
Always test tools for yourself and use proper risk management.
Aydan ScalperBy when EMA 8 cross EMA 21 from Below to Abouve and SELL when EMA 21 cross EMA 8 from Abouve to Belove

QuantumFlowTrader V1QuantumFlowTrader V1 — Adaptive Institutional Flow Framework
Overview
QuantumFlowTrader V1 is a precision-built visual tool that fuses institutional structure, dynamic volatility, and balance zones into one unified system.
It is designed to help traders align with the market’s internal flow without relying on lagging indicators or fixed settings.
Core Components
1. Adaptive EMA Clouds — Structural Flow
Layered exponential moving averages adapt to current conditions, clearly showing when market structure is aligned or in transition. Cloud color and intensity adjust automatically to reflect real-time directional bias.
2. Dynamic VWAP + Deviation Zones
Includes a self-adjusting VWAP with optional deviation bands (VWAP Deviation Zones) that reflect institutional fair-value areas — places where price often reacts, pauses, or mean-reverts.
The VWAP line shifts color based on price positioning.
3. Quantum ATR Engine — Multi-Layer Volatility Sync
A proprietary multi-ATR engine detects when volatility signals align in one direction across multiple sensitivities.
Arrows appear only on full directional agreement, signaling high-conviction flow moments.
4. Session Visualization + Arrow Filtering
Background shading highlights key trading sessions (Asia, London, USA).
You can optionally disable arrow signals during specific sessions for a cleaner view.
Features & Alerts
- Toggle EMA Clouds, VWAP, Deviation Zones, and ATR Arrows independently.
- Customize all colors, transparencies, and visual styles.
- Built-in alerts for bullish and bearish arrow signals.
Compatibility
Works on all assets: Forex, Crypto, Stocks, Indices, Futures.
Fully adaptive across all timeframes — intraday to swing.
No optimization needed — smart parameters adjust automatically.
Strategy Alignment Tip
QuantumFlowTrader V1 adapts to any trading strategy and acts as a directional compass for market flow.
It becomes especially powerful when combining multiple timeframes — for example, using the 1H and 15M charts to define trend alignment, and then executing entries on lower timeframes in the direction of that flow.
Note: Entry setups are defined by each trader’s individual system.
This indicator does not provide entry points — it highlights multi-timeframe alignment and directional bias.
To request access, contact via TradingView profile.

VWAP 1SD 2SD yasurferThis custom intraday indicator is designed to provide a detailed understanding of market equilibrium, volatility expansion, and trend structure by combining Session VWAP, Standard Deviation bands, and multi-timeframe EMAs. The script calculates cumulative volume-weighted price data throughout the trading day and automatically resets at the start of each new session. This ensures that the Session VWAP reflects only current-day trading activity, making it highly relevant for scalpers, day traders, and intraday swing setups.
The ±2 Standard Deviation bands illustrate where price is statistically stretched. These zones often act as areas of exhaustion, liquidity grabs, or potential momentum continuation points. By tracking variance around VWAP, the indicator helps traders quickly identify whether price is trading within a normal distribution or pushing into extreme territory.
A dynamic label displays the real-time percentage distance from VWAP, allowing traders to assess how far price has deviated from fair value. This is particularly useful for identifying overextended moves, mean-reversion opportunities, or breakout conditions.
The addition of EMA 50, EMA 200, and EMA 325 provides structural trend context—helping traders evaluate higher-timeframe alignment and potential confluence with VWAP levels. Overall, this indicator enhances clarity, timing, and decision-making by blending statistical tools with traditional trend analysis.

Institutional VWAP Suite (Lite Compatible)The **Institutional VWAP Suite (Lite Compatible)** brings true institutional volume-weighted price analysis to every trader — even on TradingView Lite/Free accounts where standard VWAP tools are restricted.
This script recreates the most important VWAP models used by banks, funds, and high-frequency desks, including:
• **Daily VWAP** (exchange-accurate)
• **Weekly VWAP** (manually accumulated)
• **Monthly VWAP** (manually accumulated)
• **Rolling Window VWAP** (array-based, fully Lite-compatible)
All calculations avoid blocked functions like `ta.sum` or session-restricted VWAP calls. Everything is built manually from volume and price to ensure accuracy across all accounts and all markets.
### Features
• Multi-timeframe VWAPs (Daily/Weekly/Monthly)
• Manual Rolling VWAP with adjustable length
• Optional VWAP bands (Lite-safe)
• Clean visuals with color-coded levels
• Optimized arrays for fast, stable performance
• Free-tier compatible — no premium functions required
This tool is designed for traders who want institutional structure, premium-level VWAP calculations, and consistent execution regardless of plan level. Perfect for scalpers, day traders, futures traders, and anyone who uses intraday volume profiles.
### Recommended Use
• Map directional bias using Daily vs Weekly VWAP
• Use Monthly VWAP for macro trend context
• Track intraday mean reversion with Rolling VWAP
• Use VWAP bands as dynamic support/resistance zones
A simple, powerful, no-restrictions VWAP engine — built for everyone.

Hybrid -WinCAlgo/// 🇬🇧
Hybrid - WinCAlgo is a weighted composite oscillator designed to provide a more robust and reliable signal than the standard Relative Strength Index (RSI). It integrates four different momentum and volume metrics—RSI, Money Flow Index (MFI), Scaled CCI, and VWAP-RSI—into a single 0-100 oscillator.
This powerful tool aims to filter market noise and enhance the detection of trend reversals by confirming momentum with trading volume and volume-weighted average price action.
⚪ What is this Indicator?
The Hybrid Oscillator combines:
* RSI (40% Weight): Measures fundamental price momentum.
* VWAP-RSI (40% Weight): Measures the momentum of the Volume Weighted Average Price (VWAP), providing strong volume confirmation for trend strength.
* MFI (10% Weight): Measures money flow volume, confirming momentum with liquidity.
* Scaled CCI (10% Weight): Tracks market extremes and potential trend shifts, scaled to fit the 0-100 range.
⚪ Key Features
* Composite Strength: Blends four different market factors for a multi-dimensional view of momentum.
* Volume Integration: High weights on VWAP-RSI and MFI ensure that momentum signals are backed by trading volume.
* Advanced Divergence: The robust formula significantly enhances the detection of Bullish and Bearish Divergences, often providing an earlier signal than traditional oscillators.
* Customizable: Adjustable Lookback Length (N) and Individual Component Weights allow users to fine-tune the oscillator for specific assets or timeframes.
* Visual Clarity: Uses 40/60 bands for earlier Overbought/Oversold indications, with a gradient-styled background for intuitive visual interpretation.
⚪ Usage
Use Hybrid – WinCAlgo as your primary momentum confirmation tool:
* Divergence Signals: Trust the indicator when it fails to confirm new price highs/lows; this signals imminent trend exhaustion and reversal.
* Accumulation/Distribution: Look for the oscillator to rise/fall while the price is ranging at a bottom/top; this confirms hidden buying or selling (accumulation).
* Overbought/Oversold: Use the 60 band as the trigger for potential selling/shorting signals, and the 40 band for potential buying/longing signals.
* Noise Filter: Combine with a higher timeframe chart (e.g., 4H or Daily) to filter out gürültü (noise) and focus only on significant momentum shifts.
---

FAIRPRICE_VWAP_RDFAIRPRICE_VWAP_RD
This script plots an **anchored VWAP (Volume Weighted Average Price)** that resets
based on the user-selected anchor period. It acts as a dynamic “fair value” line
that reflects where the market has actually transacted during the chosen period.
FEATURES
- Multiple anchor options: Session, Week, Month, Quarter, Year, Decade, Century,
Earnings, Dividends, or Splits.
- Intelligent handling of the “Session” anchor so it works correctly on both 1m
(resets each new day) and 1D (continuous, non-resetting VWAP).
- Manual VWAP calculation using cumulative(price * volume) and cumulative(volume),
ensuring the line is stable and works on all timeframes.
- Optional hiding of VWAP on daily or higher charts.
- Offset input for horizontal shifting if desired.
- VWAP provides a true “fair price” reference for trend, mean-reversion,
and institutional-level analysis.
PURPOSE
This indicator solves the common problem of VWAP behaving incorrectly on higher
timeframes, on synthetic data, or with unusual anchors. By implementing VWAP
manually and allowing flexible reset conditions, it functions reliably as
an institutional-style fair value benchmark across any timeframe.

Custom MTF VWAP 5x This is a combination of all VWAPs I use to find high probability trade setups and targets by only taking trades when different VWAPs align

WMA SupertrendVWMA Supertrend for identifying good entry points
Divides the slow VWMA and fast VWMA and multiplies by the close price to give a mountain-style price showing possible entries.

ZynIQ Market Structure Master v2 - (Pro Pack)Overview
ZynIQ Market Structure Master v2 (Pro) maps structural shifts in price action using automated BOS/CHOCH detection, swing analysis and directional flow. It provides a clear view of when the market transitions between expansion, pullback and reversal phases.
Key Features
• Automated BOS (Break of Structure) and CHOCH detection
• Swing high/low mapping with optional filtering
• Directional flow logic for identifying trend vs reversal phases
• Optional EQ levels and mitigation markers
• Configurable structure sensitivity for different timeframes
• Clean labels and minimal clutter for fast interpretation
• Suitable for intraday and swing structure analysis
Use Cases
• Identifying key structural shifts in trend
• Spotting early reversal signals via CHOCH
• Assessing trend continuation vs distribution/accumulation
• Combining structure with liquidity, FVG or breakout tools
Notes
This tool provides structural context using break-of-structure and swing logic. It is not a trading system by itself. Use alongside your own confirmation and risk management.

MTProChart XAUUSD⭐ MTProChart XAUUSD — Quick Professional Description
MTProChart XAUUSD is a professional trading indicator designed specifically for Gold (XAUUSD).
It combines trend detection, market structure analysis, and dynamic price zones to deliver clear, reliable trading signals with minimal noise.
✔ Accurate Trend Detection
Identifies the true market direction (uptrend or downtrend) using a refined trend-filtering algorithm.
✔ Dynamic Support & Resistance Zone
Displays a real-time adaptive zone (green band) that acts as:
• Dynamic support in uptrends
• Dynamic resistance in downtrends
This helps traders avoid false breakouts and stay aligned with market structure.
✔ Clear Buy & Sell Signals
The indicator highlights strategic entry and exit points using:
• Trend flips
• Retests
• Momentum confirmations
This gives traders a structured approach instead of guessing.
✔ Optimized for 1M Scalping & Intraday Trading
Perfect for fast-paced XAUUSD conditions with low lag and high accuracy.
⸻
💡 In short:
MTProChart XAUUSD simplifies gold trading by showing:
• Where the trend is
• Where price should bounce
• When to enter
• When to exit
with clean, visually clear signals suitable for both beginners and professional day traders.

Volume Weighted Average Price - 6 band by buckstrdrstandard VWAP improved to allow 6 bands as standard

Moving VWAP-KAMA CloudMoving VWAP-KAMA Cloud
Overview
The Moving VWAP-KAMA Cloud is a high-conviction trend filter designed to solve a major problem with standard indicators: Noise. By combining a smoothed Volume Weighted Average Price (MVWAP) with Kaufman’s Adaptive Moving Average (KAMA), this indicator creates a "Value Zone" that identifies the true structural trend while ignoring choppy price action.
Unlike brittle lines that break constantly, this cloud is "slow" by design—making it exceptionally powerful for spotting genuine trend reversals and filtering out fakeouts.
How It Works
This script uses a unique "Double Smoothing" architecture:
The Anchor (MVWAP): We take the standard VWAP and smooth it with a 30-period EMA. This represents the "Fair Value" baseline where volume has supported price over time.
The Filter (KAMA): We apply Kaufman's Adaptive Moving Average to the already smoothed MVWAP. KAMA is unique because it flattens out during low-volatility (choppy) periods and speeds up during high-momentum trends.
The Cloud:
Green/Teal Cloud: Bullish Structure (MVWAP > KAMA)
Purple Cloud: Bearish Structure (MVWAP < KAMA)
🔥 The "Reversal Slingshot" Strategy
Backtests reveal a powerful behavior during major trend changes, particularly after long bear markets:
The Resistance Phase: During a long-term downtrend, price will repeatedly rally into the Purple Cloud and get rejected. The flattened KAMA line acts as a "concrete ceiling," keeping the bearish trend intact.
The Breakout & Flip: When price finally breaks above the cloud with conviction, and the cloud flips Green, it signals a structural regime change.
The "Slingshot" Retest: Often, immediately after this flip, price will drop back into the top of the cloud. This is the "Slingshot" moment. The old resistance becomes new, hardened support.
The Rally: From this support bounce, stocks often launch into a sustained, multi-month bull run. This setup has been observed repeatedly at the bottom of major corrections.
How to Use This Indicator
1. Dynamic Support & Resistance
The KAMA Wall: When price retraces into the cloud, the KAMA line often flattens out, acting as a hard "floor" or "wall." A break of this wall usually signals a genuine trend change, not just a stop hunt.
2. Trend Confirmation (Regime Filter)
Bullish Regime: If price is holding above the cloud, only look for Long setups.
Bearish Regime: If price is holding below the cloud, only look for Short setups.
No-Trade Zone: If price is stuck inside the cloud, the market is traversing fair value. Stand aside until a clear winner emerges.
3. Multi-Timeframe Versatility
While designed for trend confirmation on higher timeframes (4H, Daily), this indicator adapts beautifully to lower timeframes (5m, 15m) for intraday scalping.
On Lower Timeframes: The cloud reacts much faster, acting as a dynamic "VWAP Band" that helps intraday traders stay on the right side of momentum during the session.
Settings
Moving VWAP Period (30): The lookback period for the base VWAP smoothing.
KAMA Settings (10, 10, 30): Controls the sensitivity of the adaptive filter.
Cloud Transparency: Adjust to keep your chart clean.
Alerts Included
Price Cross Over/Under MVWAP
Price Cross Over/Under KAMA
Cloud Flip (Bullish/Bearish Trend Change)
Tip for Traders
This is not a signal entry indicator. It is a Trend Conviction tool. Use it to filter your entries from faster indicators (like RSI or MACD). If your fast indicator signals "Buy" but the cloud is Purple, the probability is low. Wait for the Cloud Flip

VWAP Bands ProDisclaimer: This script is for educational purposes only and is not financial advice. Trading involves risk, and users are responsible for their own decisions.
VWAP Bands Pro is a professional volatility tool that anchors the Volume Weighted Average Price to a chosen timeframe and projects standard deviation bands to reveal stretched price zones.
Key Features
Anchored Precision : Calculates VWAP from a fixed anchor period (default: Daily) for a clean institutional reference point.
Standard Deviation Bands : Plots 1s, 2s, and 3s bands to show volatility. Moves into the outer bands often point to exhaustion or possible reversal areas.
Glowing Gradient Design : Uses a premium multi step gradient that fades outward, making extreme zones easy to spot.
Clean Visuals : Prioritizes smooth gradient fills instead of crowding the chart with heavy lines.
How to Use
Anchor Period : Select the timeframe you want the tool to follow. Daily works well for intraday setups, while Weekly or Monthly suits swing trades.
Strategy : Watch for mean reversion setups when price moves into the 2s to 3s outer zones and starts to reject, aiming for a return toward the central VWAP.

Dynamic Fair-Value Ribbon Pro @darshakssc1. What This Indicator Is (In Simple Terms)
The Dynamic Fair-Value Ribbon Pro is a visual tool that helps you see how price behaves around a statistically derived “fair-value zone”:
A colored ribbon/cloud marks a central “fair” area.
Areas above the ribbon are labeled as “Unfair High Zone”.
Areas below the ribbon are labeled as “Unfair Low Zone”.
A small state panel tells you where price currently sits relative to this ribbon.
All calculations are based only on historical price, volume, and volatility.
It does not predict future price, does not give buy/sell signals, and is not financial advice.
2. Adding the Indicator
Open a chart on TradingView.
Click on Indicators .
Search for “Dynamic Fair-Value Ribbon Pro” .
Click to add it to your chart.
You will see:
A cloud/ribbon around price.
Colored bars when price is outside the ribbon.
A panel in the top right describing the current state.
3. Core Concept: Fair vs Unfair Zones (Analytical Only)
The indicator tries to answer a descriptive question:
“Where is price trading relative to a historically derived central area?”
It does this by:
Calculating a central value (“fair mid”).
Building a band around that mid.
Coloring the chart depending on whether price is inside or outside that band.
It is not claiming that:
Price “must” return to the band.
Price is “overvalued” or “undervalued”.
Any state is good or bad.
It is simply a visual classification tool .
4. Engine Modes — How the Ribbon Is Calculated
Under “Fair-Value Engine” you can choose:
4.1 Mode 1: Range
Looks back over a chosen number of bars (default: 100).
Finds the highest high and lowest low in that window.
Defines a central “slice” of that range as the fair-value ribbon :
Range Mode: Lower Percent → bottom boundary of the slice (e.g., 30%).
Range Mode: Upper Percent → top boundary of the slice (e.g., 70%).
Effect:
The ribbon represents a middle portion of the historical range .
Above the ribbon = “Unfair High Zone” (analytical label only).
Below the ribbon = “Unfair Low Zone”.
This is purely statistical — it does not mean price is wrong or will revert.
4.2 Mode 2: VWAP + Stdev
In this mode, the central value is based on VWAP :
VWAP (Volume-Weighted Average Price) is used as the midline.
A standard deviation envelope is built around VWAP:
VWAP Mode: Stdev Multiplier controls how wide that envelope is.
Effect:
The ribbon shows where price is trading relative to a volume-weighted average .
Again, areas above and below are just described as “unfair” zones in a visual, analytical sense , not a predictive one.
5. ATR Adaptive Width — Making the Ribbon React to Volatility
Under “ATR Adaptive Width” :
Use ATR Adaptive Width:
On: the band width scales with volatility.
Off: band width stays fixed based on Range or VWAP settings.
ATR Length: how many bars to use for ATR.
Reference ATR (% of price): a reference level for normal volatility.
Min Width Scale / Max Width Scale: clamps the scaling so that the band doesn’t get too narrow or too wide.
What this does (analytically):
When volatility (ATR) is higher than the reference, the band can become wider .
When volatility is lower , the band can become narrower .
This is a mathematical rescaling only and does not imply any optimal levels or performance.
6. Visual Elements — What You See on the Chart
6.1 Fair-Value Ribbon (Cloud)
The cloud between Fair Ribbon Low and Fair Ribbon High is the fair zone .
Color can be changed via “Fair Ribbon Color” .
6.2 Midline
If “Show Center Line” is enabled:
A line runs through the middle of the ribbon.
In Range mode, this is the average of the upper and lower band.
In VWAP mode, it’s essentially the VWAP-based mid.
This line is for visual reference only and makes no claims about support, resistance, or reversion.
6.3 Bar Colors
Unfair High Zone: bars are colored with Unfair High Bar Color.
Unfair Low Zone: bars are colored with Unfair Low Bar Color.
Inside the ribbon:
If “Fade Bars Inside Fair Zone” is ON, bars may be more faded/neutral.
These colors are simply classification highlights ; they do not tell you what to do.
6.4 State Panel (Top Right)
If “Show State Panel” is enabled, you’ll see a small box that displays:
Current engine:
Range or VWAP+Stdev.
Current price state:
Inside Ribbon (Fair Zone)
Above Ribbon (Unfair High Zone)
Below Ribbon (Unfair Low Zone)
This is a quick summary of where price sits relative to the computed ribbon.
7. Typical Ways to Use It (Informational Only)
The indicator can help you visually:
See when price is spending time inside a historically defined central zone.
Notice when price is frequently trading outside that zone.
Compare different timeframes (e.g., 5m vs 1h vs 4h) to see how the fair zone shifts.
Experiment with:
Range length (shorter vs longer lookback).
VWAP vs Range mode.
ATR adaptation on/off.
Important:
Any interpretation of these visuals is entirely up to the user.
The script does not tell you to buy, sell, hold, or do anything specific.
8. Limitations and Important Notes
All calculations use past data only (price, volume, volatility).
The ribbon does not guarantee:
that price will revert,
that zones will hold,
or that any outcome will occur.
There are no built-in signals such as “long/short” or automatic entries/exits.
The script is best used as a supporting, visual layer alongside other tools or methods you choose.
9. Disclaimer
This indicator is:
Strictly informational and educational.
Not a trading system or strategy.
Not financial advice or a recommendation.
Not guaranteed to be accurate, complete, or suitable for any specific purpose.
Users should always perform their own research and due diligence.
Past behavior of any visual pattern or zone does not guarantee future behavior.

Volume Weighted Average Price AdvancedVWAP (Advanced) with Multi‑Venue Aggregation and Historical Value Areas
Core: Anchored VWAP with configurable anchor (session/week/month/quarter/year/decade/century or corporate events), offset, and up to three standard-deviation bands.
Multi‑Venue Aggregation: Optionally pull price/volume from up to 5 additional exchanges/symbols (pair-matched by default). VWAP/σ are computed on the aggregated price*volume.
Value Area Blocks: Each completed anchor draws a block from the chosen basis (±1σ or ±2σ) or an optional percentile-based range (default 20–80%). Blocks project to the exact next anchor boundary, or you can extend them to the latest bar. Prior-period VWAP lines are shown inside the blocks.
Volume Gate: Optionally skip drawing prior blocks when the anchor’s aggregated volume is below a median/mean baseline times a multiplier.
HTF Context: Optional higher-timeframe VWAP overlay; can filter the current VWAP/bands so they only show when aligned with the HTF VWAP.
Venue Health: Label shows how many extra venues were included (non‑na) and median venue volume; flags divergence when primary volume is below venue median × threshold.
Alerts: Price in current value area (VWAP ±1σ) and price crossing the most recent prior VWAP.
Styling: Bands and fills are minimal; HTF VWAP is a distinct line; value-area blocks are shaded with prior VWAP lines inside.
Configure via the grouped inputs: VWAP Settings, Additional Exchange Sources, Historical Value Areas, HTF Context, and Bands Settings.

Daily & Average Dollar VolumeCalculates the daily and average (20D) $ volume.
Fully customizable appearence and can be placed in any corner.

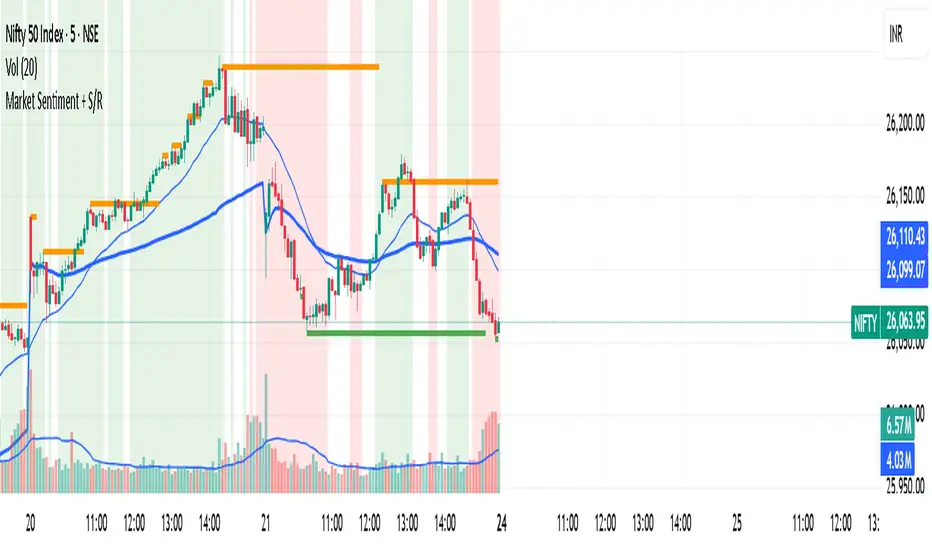
Market Sentiment + S/R KPRThis script is having VWAP and moving average cross overs. and also support and resistence.
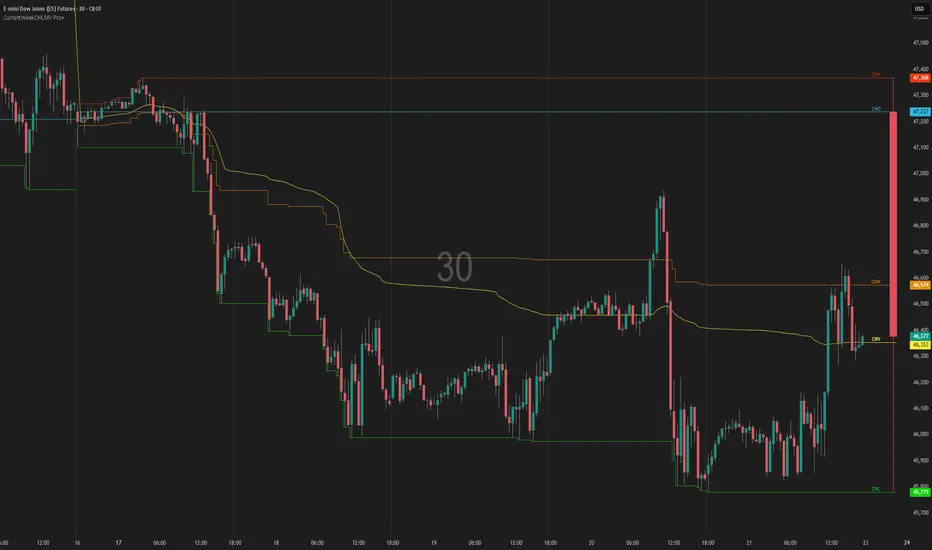
Current Year OHLMV Pro+Current Year OHLV + Anchored VWAP – Professional Edition
OVERVIEW
Real-time display of the current calendar year’s developing Open, High, Low, Close (live), and anchored VWAP with a full-size current-year candle in the right margin.
IMPLEMENTATION & VALUE ADDED
• Live anchored VWAP as a major yearly fair-value line
• Full current-year candle rendered in the right margin
• All levels as exportable plots
• Comprehensive alerts on every level and VWAP interaction
HOW TO USE
Apply to weekly or daily charts. The live VWAP and right-margin candle provide macro-level bias and yearly anchor points.
CREDIT & TRANSPARENCY
Core methodology: public domain (Current Year OHLC + Anchored VWAP).
Independent implementation with original live candle display and features.
DISCLAIMER
For educational and informational purposes only. Not financial advice. Test thoroughly.

Current Month OHLMV Pro+Current Month OHLV + Anchored VWAP – Professional Edition
OVERVIEW
Real-time display of the current calendar month’s developing Open, High, Low, Close (live), and anchored VWAP with a full-size current-month candle in the right margin.
IMPLEMENTATION & VALUE ADDED
• Live anchored VWAP as a powerful monthly fair-value reference
• Full current-month candle in the right margin
• All levels as exportable plots
• Comprehensive alerts on every level and VWAP touch/break
HOW TO USE
Apply to daily or lower timeframes. Use the live VWAP and right-margin candle for monthly trend bias and high-probability reversal zones.
CREDIT & TRANSPARENCY
Core methodology: public domain (Current Month OHLC + Anchored VWAP).
Independent implementation with original presentation and features.
DISCLAIMER
For educational and informational purposes only. Not financial advice. Test thoroughly.

Current Week OHLM + VWAPCurrent Week OHLV + Anchored VWAP – Professional Edition
OVERVIEW
Real-time display of the current trading week’s developing Open, High, Low, Close (live), and anchored VWAP with a full-size current-week candle in the right margin.
IMPLEMENTATION & VALUE ADDED
• Live anchored VWAP updated throughout the week as a dynamic anchor
• Full current-week candle rendered in the right margin
• All levels as exportable plots
• Comprehensive alerts on every level and VWAP interaction
HOW TO USE
Apply to daily or intraday charts. The live VWAP serves as the week’s volume-weighted fair value; the right-margin candle gives instant bias and range context.
CREDIT & TRANSPARENCY
Core methodology: public domain (Current Week OHLC + Anchored VWAP).
Independent implementation with original live candle display, exportable plots, and alerting.
DISCLAIMER
For educational and informational purposes only. Not financial advice. Test thoroughly.