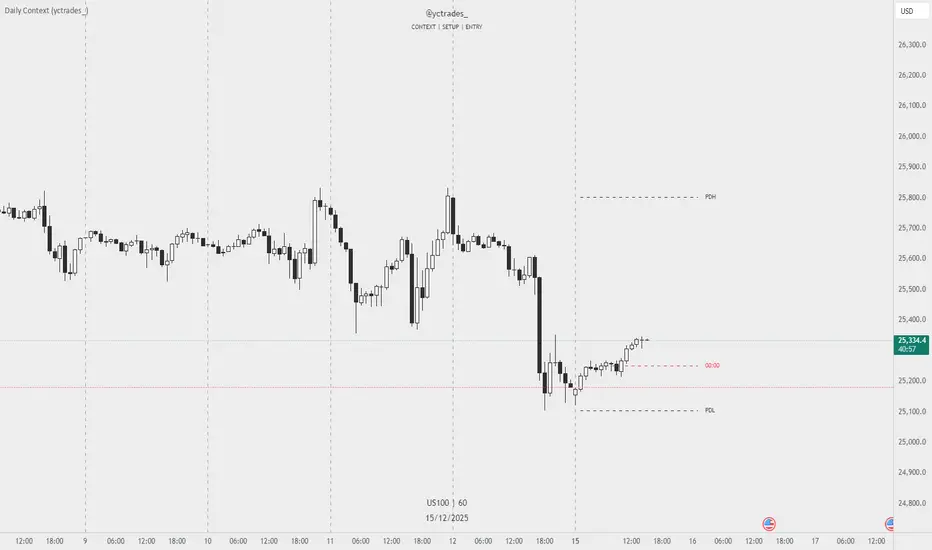
Daily Context (yctrades_)This indicator automatically marks the Previous Day’s High and Low, as well as the market’s midnight opening price.
These levels are updated at the start of each new trading day and remain visible throughout the entire session.
By providing key daily reference points, the indicator helps establish a clear market context and allows traders to immediately understand where price is positioned relative to the previous day’s range and the daily open.
The New York midnight line (00:00 NY) now appears only at the actual NY midnight.
Any previous day’s NY midnight line is automatically deleted when the day changes.
Between the previous NY midnight and the current one, no line is displayed, avoiding clutter or outdated lines.
The line’s color can now be individually customized via NY 00:00 Line + Text Color input, applying to both the line and its label.
Displays a vertical line between each trading day.
Fully customizable in the settings:
Color of the line
Width of the line
Style (solid, dashed, dotted)
This makes it easy to visually separate trading sessions directly on the chart.
PDH / PDL are calculated using UTC 00:00–23:59 to ensure identical levels for all traders worldwide, regardless of market or timezone.
Watermark
Watermark | Bar Time | Average Daily RangeMulti Info Panel & Watermark
Multi Info Panel & Watermark is a utility indicator that displays several pieces of chart information in a single, customizable panel. It is designed to support intraday and swing analysis by making key data—such as symbol details, date, and average daily range—easy to see at a glance, as well as providing simple tools for notes and backtesting.
Features
Watermark / Custom Note
Optional text overlay that can be used as a watermark or personal note.
Can display a strategy name, reminder, or any other user-defined label on the chart.
Ticker Info
Shows information about the currently active symbol on the chart (for example, symbol name and other basic details depending on the inputs).
Helps keep track of which market or pair is being analyzed, especially when using multiple charts.
Current Date
Displays the current date directly on the chart.
Useful for screenshots, journaling, and documenting analysis.
Average Daily Range (ADR)
Calculates the average daily range of the active symbol over a user-defined number of recent days.
Helps visualize how much price typically moves in a day, which can support position sizing, target setting, or volatility awareness within your own trading approach.
Open Bar Time Marker
Marks the open time of a selected bar (for example, a session open or a specific reference bar).
Primarily intended as a visual aid for manual backtesting and reviewing historical price action.
Usage
Use the watermark and ticker info to keep your charts labeled and organized.
Refer to the ADR readout to understand typical daily volatility of the instrument you are studying.
Use the date and open bar time marker when creating screenshots, trade journals, or when replaying historical sessions for review.
This script does not generate trading signals and does not guarantee any performance or results. It is provided solely as an informational and visualization tool. Always combine it with your own analysis, risk management, and decision-making. Nothing in this indicator or description should be considered financial advice.

One for AllOne for All (OFA) - Complete ICT Analysis Suite
Version 3.3.0 by theCodeman
📊 Overview
One for All (OFA) is a comprehensive TradingView indicator designed for traders who follow Inner Circle Trader (ICT) concepts. This all-in-one tool combines essential ICT analysis features—sessions, kill zones, previous period levels, and higher timeframe candles with Fair Value Gaps (FVGs) and Volume Imbalances (VIs)—into a single, highly customizable indicator. Whether you're a beginner learning ICT concepts or an experienced trader refining your edge, OFA provides the visual structure needed for precise market analysis and execution.
✨ Key Features
- 🏷️ Customizable Watermark**: Display your trading identity with customizable titles, subtitles, symbol info, and full style control
- 🌍 Trading Sessions**: Visualize Asian, London, and New York sessions with high/low lines, range boxes, and open/close markers
- 🎯 Kill Zones**: Highlight 5 critical ICT kill zones with precise timing and visual boxes
- 📈 Previous Period H/L**: Track Daily, Weekly, and Monthly highs/lows with customizable styles and lookback periods
- 🕐 Higher Timeframe Candles**: Display up to 5 HTF timeframes with OHLC trace lines, timers, and interval labels
- 🔍 FVG & VI Detection**: Automatically detect and visualize Fair Value Gaps and Volume Imbalances on HTF candles
- ⚙️ Universal Timezone Support**: Works globally with GMT-12 to GMT+14 timezone selection
- 🎨 Full Customization**: Control colors, styles, visibility, and layout for every feature
🚀 How to Use
Watermark Setup
The watermark overlay helps you identify your charts and maintain focus on your trading principles:
1. Enable/disable watermark via "Show Watermark" toggle
2. Customize the title (default: "Name") to display your trading name or account identifier
3. Set up to 3 subtitles (default: "Patience", "Confidence", "Execution") as trading reminders
4. Choose position (9 locations available), size, color, and transparency
5. Toggle symbol and timeframe display as needed
Use Case: Display your trading principles or account name for multi-monitor setups or content creation.
Trading Sessions Analysis
Sessions define market character and liquidity availability:
1. Enable "Show All Sessions" to visualize all three sessions
2. Adjust timezone to match your local market (default: UTC-5 for EST)
3. Customize session times if needed (defaults cover standard hours)
4. Enable session range boxes to see consolidation zones
5. Use session high/low lines to identify key levels for the current session
6. Enable open/close markers to track session transitions
Use Case: Identify which session you're trading in, track session highs/lows for liquidity, and anticipate session transition volatility.
Kill Zones Trading
Kill zones are ICT's high-probability trading windows:
1. Enable individual kill zones or use "Show All Kill Zones"
2. **Asian Kill Zone** (2000-0000 GMT): Early positioning and smart money accumulation
3. **London Kill Zone** (0300-0500 GMT): European market opening volatility
4. **NY AM Kill Zone** (0930-1100 EST): Post-NYSE open expansion
5. **NY Lunch Kill Zone** (1200-1300 EST): Midday consolidation or manipulation
6. **NY PM Kill Zone** (1330-1600 EST): Afternoon positioning and closes
7. Customize colors and times to match your trading style
8. Set max days display to control historical visibility (default: 30 days)
Use Case: Focus entries during high-probability windows. Watch for liquidity sweeps at kill zone openings and institutional positioning.
Previous Period High/Low Levels
Previous period levels act as magnetic price targets and support/resistance:
1. Enable Daily (PDH/PDL), Weekly (PWH/PWL), or Monthly (PMH/PML) levels individually
2. Set lookback period (how many previous periods to display)
3. Choose line style: Solid (current emphasis), Dashed (standard), or Dotted (subtle)
4. Customize colors per timeframe for visual hierarchy
5. Adjust line width (1-5) for visibility preference
6. Enable gradient effect to fade older periods
7. Position labels left or right based on chart layout
8. Customize label text for your preferred notation
Use Case: Identify key levels where price is likely to react. Daily levels work on intraday timeframes, Weekly on daily charts, Monthly for swing trading.
Higher Timeframe (HTF) Candles
HTF candles reveal the larger market context while trading lower timeframes:
1. Enable up to 5 HTF slots simultaneously (default: 5m, 15m, 1H, 4H, Daily)
2. Choose display mode: "Below Chart" (stacked rows) or "Right Side" (compact column)
3. Customize timeframe, colors (bull/bear), and titles for each slot
4. **OHLC Trace Lines**: Visual lines connecting HTF candle levels to chart bars
5. **HTF Timer**: Countdown showing time remaining until HTF candle close
6. **Interval Labels**: Display day of week (Daily+) or time (intraday) on each candle
7. For Daily candles: Choose open time (Midnight, 8:30, 9:30) to match your market structure preference
Use Case: Trade lower timeframes while respecting higher timeframe structure. Watch for HTF candle closes to confirm directional bias.
FVG & VI Detection
Fair Value Gaps and Volume Imbalances highlight inefficiencies that price often revisits:
1. **Fair Value Gaps (FVGs)**: Detected when HTF candle wicks don't overlap between 3 consecutive candles
- Bullish FVG: Gap between candle 1 high and candle 3 low (green box by default)
- Bearish FVG: Gap between candle 1 low and candle 3 high (red box by default)
2. **Volume Imbalances (VIs)**: Similar detection but focuses on body gaps
- Bullish VI: Gap between candle 1 close and candle 3 open
- Bearish VI: Gap between candle 1 open and candle 3 close
3. Enable FVG/VI detection per HTF slot individually
4. Customize colors and transparency for each imbalance type
5. Boxes appear on chart at formation and remain visible as retracement targets
**Use Case**: Identify high-probability retracement zones. Price often returns to fill FVGs and VIs before continuing the trend. Use as entry zones or profit targets.
🎨 Customization
OFA is built for flexibility. Every feature includes extensive customization options:
Visual Customization
- **Colors**: Independent color control for every element (sessions, kill zones, lines, labels, FVGs, VIs)
- **Transparency**: Adjust box and label transparency (0-100%) for clean charts
- **Line Styles**: Choose Solid, Dashed, or Dotted for previous period lines
- **Sizes**: Control text size, line width, and box borders
- **Positions**: Place watermark in 9 positions, labels left/right
Layout Control
- **HTF Display Mode**: "Below Chart" for detailed analysis, "Right Side" for space efficiency
- **Drawing Limits**: Set max days for sessions/kill zones to manage chart clutter
- **Lookback Periods**: Control how many previous periods to display (1-10)
- **Gradient Effects**: Enable fading for older previous period lines
Timing Adjustments
- **Timezone**: Universal GMT offset selector (-12 to +14) for global markets
- **Session Times**: Customize each session's start/end times
- **Kill Zone Times**: Adjust kill zone windows to match your market's characteristics
- **Daily Open**: Choose Midnight, 8:30, or 9:30 for Daily HTF candle open time
💡 Best Practices
1. Start Simple: Enable one feature at a time to learn how each element affects your analysis
2. Match Your Timeframe: Use Daily levels on intraday charts, Weekly on daily charts, HTF candles one or two levels above your trading timeframe
3. Kill Zone Focus: Concentrate your trading activity during kill zones for higher probability setups
4. HTF Confirmation: Wait for HTF candle closes before committing to directional bias
5. FVG/VI Entries: Look for price to return to unfilled FVGs/VIs for entry opportunities with favorable risk/reward
6. Customize Colors: Use a consistent color scheme that matches your chart theme and reduces visual fatigue
7. Reduce Clutter: Disable features you're not actively using in your current trading plan
8. Session Context: Understand which session controls the market—trade with session direction or anticipate reversals at session transitions
⚙️ Settings Guide
OFA organizes settings into logical groups for easy navigation:
- **═══ WATERMARK ═══**: Title, subtitles, position, style, symbol/timeframe display
- **═══ SESSIONS ═══**: Enable/disable sessions, times, colors, high/low lines, boxes, markers
- **═══ KILL ZONES ═══**: Individual kill zone toggles, times, colors, max days display
- **═══ PREVIOUS H/L - DAILY ═══**: Daily high/low lines, style, color, lookback, labels
- **═══ PREVIOUS H/L - WEEKLY ═══**: Weekly high/low lines, style, color, lookback, labels
- **═══ PREVIOUS H/L - MONTHLY ═══**: Monthly high/low lines, style, color, lookback, labels
- **═══ HTF CANDLES ═══**: Global display mode, layout settings
- **═══ HTF SLOT 1-5 ═══**: Individual HTF configuration (timeframe, colors, title, FVG/VI detection, trace lines, timer, interval labels)
Each setting includes tooltips explaining its function. Hover over any input for detailed guidance.
📝 Final Notes
One for All (OFA) represents a complete ICT analysis toolkit in a single indicator. By combining watermark customization, session visualization, kill zone highlighting, previous period levels, and higher timeframe candles with FVG/VI detection, OFA eliminates the need for multiple indicators cluttering your chart.
**Version**: 3.3.0
**Author**: theCodeman
**Pine Script**: v6
**License**: Mozilla Public License 2.0
Start with default settings to learn the indicator's structure, then customize extensively to match your personal trading style. Remember: tools provide information, but your edge comes from disciplined execution of a proven strategy.
Happy Trading! 📈


Title Watermark & Symbol InfoBased on the popular watermark script by @AGFXTRADING
I saw lots of comments requesting features like different date formats and multi-line sub/titles so I decided to give back to the community.
Added features:
Multi-line support for Title and Subtitle
MM/DD/YYYY, YYYY/MM/DD and DD/Month/YYYY date formats
Option to use lowercase "m" for minute intervals (instead of uppercase "M")
Option to use "H" for hour intervals (instead of 60M for 1H, 240M for 4H, etc.)
I am planning to update further if there are further requests. Enjoy :)

Rons Custom WatermarkRon's Custom Watermark (RCW)
This is a lightweight, all-in-one watermark indicator that displays essential fundamental and technical data directly on your chart. It's designed to give you a quick, at-a-glance overview of any asset without cluttering your screen.
Features
The watermark displays the following information in a clean table:
* Company Info: Full Name & Market Cap (e.g., "AST SpaceMobile, Inc. (18.85B)")
* Symbol & Timeframe: Ticker and current chart period (e.g., "ASTS, 1D")
* Sector & Industry: The asset's classification.
* Technical Status (MA): Shows if the price is Above or Below the SMA (with a 🟢/🔴 emoji).
* Technical Status (EMA): Shows if the price is Above or Below the EMA (with a 🟢/🔴 emoji).
* Earnings: A countdown showing "X days remaining" until the next earnings report.
* (Optional) Volatility: The 14-day ATR value and its percentage of the current price.

Watermark[Font] This watermark is designed for recording your chart.
It automatically converts to a cursive (italic) style and appears on the chart,
adding a more aesthetic touch to your visuals.
Enjoy your time!
You can freely turn the brand label on or off from the settings.
1.script
2.italic

Watermark with Session Boxes (by Rufi)Watermark & Session Boxes - Chart Branding Tool
What it does: Combines professional chart watermarking with automated trading session visualization for clean, branded analysis.
Key Features:
Smart Session Boxes: Auto-draws boxes around Asia (8PM-11:59PM), London (2AM-5AM), and NY (7AM-10AM) sessions using high/low detection
Custom Watermark: Professional text overlay with your brand/tagline
Full Customization: Adjustable colors, transparency (0-100%), and display limits (1-30 days)
How it works: Uses Pine Script's time() function to detect session periods, tracks price extremes during each session, then draws filled rectangles from session high to low. Perfect for identifying key support/resistance levels from major trading periods.
Best for: Intraday traders who want branded charts with clear session-based S/R levels. Ideal for forex, indices, and crypto on lower timeframes.

Watermark [TakingProphets] Watermark
A fully customizable watermark & chart info panel to keep your charts branded, organized, and informative — without clutter.
Special thanks to for inspiring the original concept that led to this expanded version.
📌 Overview
Perfect for:
Traders who stream, record, or share charts
Keeping essential info (symbol, TF, date, price) visible
Intraday traders who want day-of-week labels without messy vertical lines
✨ Key Features
1. Personal Watermark
Custom text, colors, size, opacity
Position anywhere: Top, Middle, Bottom × Left, Center, Right
Alignment options: left, center, right
Optional border with adjustable color or hide completely
2. Chart Info Panel
Show any combination of:
Custom text
Symbol
Timeframe (auto-formatted)
Date (MM-DD-YYYY)
Last price
Day of the week
Position independently from watermark
Adjustable background opacity
3. Day-of-Week Labels
Labels Sunday → Saturday at session start or midday
Works on intraday ≤ 15m timeframes
Option to hide weekends
Place labels Top or Bottom
⚙️ How to Use
Enable Watermark → Personal Watermark Settings → Toggle Show Watermark, enter your text, style it.
Set Up Info Panel → Chart Information Panel → Select details, choose position, adjust style.
Add Day Labels → Day of Week Labels Settings → Turn on for intraday charts.
💡 Tips
Lower background opacity for a subtle look.
Use bright colors for streaming so your brand stands out.
Hide unused features to keep charts clean & fast.
🙏 Acknowledgments
This script’s concept was inspired by toodegrees.
Developed by TakingProphets — tools for traders who value clarity, precision, and style.
⚠️ Disclaimer:
This script is for informational purposes only. It is not financial advice. Always trade responsibly and manage your risk.

Jumping watermark# Jumping watermark
## Function description
- Dynamic watermark: Mainly used to add dynamic watermarks to prevent theft and transfer when recording videos.
- Static watermark: Sharing opinions can easily include information such as trading pairs, cycles, current time, and individual signatures.
### Static watermark:
Display the watermark related to the current trading pair in the center of the chart.
- Configuration items:
- You can choose to configure the display content: current trading pair code and name, cycle, date, time, and individual signature content
### Dynamic watermark
Display the configured watermark content in a dynamic random position.
- Configuration items:
- Turn on or off the display of watermark jumping
- Modify the display text content and style by yourself
----- 中文简介-----
# 跳动水印
## 功能描述
- 动态水印: 主要可用于视频录制时添加动态水印防盗、防搬运。
- 静态水印:观点分享是可方便的带上交易对、周期、当前时间、个签等信息。
### 静态水印:
在图表中心位置显示当前交易对相关信息水印。
- 配置项:
- 可选择配置显示内容:当前交易对代码及名称、周期、日期、时间、个签内容
### 动态水印
动态随机位置显示配置水印内容。
- 配置项:
- 开启或关闭显示水印跳动
- 自行修改配置显示文字内容和样式
Live Price Watermark (Flashing Overlay)Displays the current price as a large, centered watermark directly on your chart. The text color updates dynamically:
- Green when price rises
- Red when price falls
- Translucent black when unchanged

Watermark Clarity V33🌟 Introducing Watermark Clarity V33 – Banner 🌟
Watermark Clarity V33 is a visual utility tool designed to enhance chart awareness, focus, and clean aesthetics without adding market noise. Unlike traditional indicators, this script does not generate buy/sell signals or perform technical analysis. Instead, it provides a customizable on-chart watermark banner that clearly communicates your current mindset, risk awareness, or trading bias directly on the chart — helping traders stay aligned with their pre-defined plans and reducing impulsive behavior.
Whether you’re a discretionary trader, scalper, or swing trader, Watermark Clarity V33 offers an adaptive display that blends clarity with minimalism, keeping your chart clean while remaining informative.
🛠 Customizable Parameters
• Dual Text Banners: Configure two independent headers to reflect trading goals, risk posture, or emotional cues.
• Smart Animation Toggle: Optionally animate between messages to help reinforce shifting market awareness or draw attention during high-alert periods.
• Size, Color & Positioning: Adjust the info box’s text size, banner dimensions, background color, transparency, and placement (top/middle/bottom – left/center/right).
• Transparent Mode: Switch to semi-transparent mode for cleaner overlays during live sessions or screen recording.
🚀 New Feature – Custom Alerts & Smart Animation Control
• Market-Aware Animation Logic:
When Enable Animation is turned on and both Heading 1 and Heading 2 are filled:
• 📈 During Market Hours → The banner alternates smoothly between both headings, helping maintain awareness and visual engagement.
• 💤 Outside Market Hours → The banner remains fixed on Heading 1. This acts as a subtle visual cue that markets are currently closed — giving you peace of mind and a cleaner screen.
✨ Visual Utility Use Cases
• Accountability Layer: Keep yourself accountable to your trading rules or session checklist.
• Mindset Anchor: Display motivational or tactical reminders that guide your trading behavior.
• Multi-Timeframe Syncing: Use different watermarks across charts to stay aligned across timeframes or instruments.
📘 How to Use
1. Add the Indicator: Apply “Watermark Clarity V33 – Banner” to your chart.
2. Configure Inputs: Adjust the banner texts, size, color scheme, and screen position to your liking.
4. Focus & Trade: Let the visual cue support your decision-making environment without interfering with price action.
❗ Important Notes
• This indicator does not analyze price data or generate signals. It is designed solely for visual clarity and trader discipline support.
• All display logic runs in real-time and responds to your settings only, no repainting or lookahead bias.

Top Right Watermark# TopRight Watermark
**Finally, a watermark that stays out of your way!**
Tired of TradingView's default watermark blocking your price action and technical analysis? This customizable watermark indicator gives you complete control over positioning and content display.
## 🎯 Key Features
**✅ Flexible Positioning** - Place anywhere: corners, sides, or edges
**✅ Multi-Slot Display** - Up to 3 customizable information slots
**✅ Individual Font Control** - Different sizes for each slot
**✅ Platform Compatibility** - TradingView OR MetaTrader timeframe formats
**✅ Clean & Professional** - Customizable colors and transparency
## 🔧 What You Can Display
- **Timeframe** - Current chart period
- **Ticker** - Symbol name (smart formatting for crypto/forex)
- **Exchange** - Broker/platform name
- **Custom Text** - Your own message
- **Empty** - Hide unused slots
## 🎨 Customization Options
- **Position**: 9 placement options (top/middle/bottom + left/center/right)
- **Colors**: Full color picker with transparency control
- **Font Sizes**: 5 sizes available per slot (tiny to huge)
- **Timeframe Style**: Choose TradingView (1m, 4H) or MetaTrader (M1, H4) format
## 🚀 Perfect For
- Traders who need clean chart visibility
- Multi-timeframe analysis
- Professional chart screenshots
- Platform migrants (MT4/MT5 to TradingView)
- Anyone wanting organized chart information
## 💡 Pro Tips
- Place in corners to avoid price action interference
- Combine Exchange + Ticker + Timeframe for complete context
- Use transparency to make it subtle but visible
**Stop letting watermarks interfere with your trading analysis. Take control of your chart display today!**
---
*Compatible with all TradingView chart types and timeframes. Easy setup with intuitive controls.*

Watermark by HAZEDEnhanced Watermark - Clean Chart Labeling
A professional watermark indicator for traders who want clean, customizable chart identification.
Features:
- Show/hide: Exchange prefix, timeframe, price change %, volume
- 9 positioning options - place anywhere on your chart
- Custom text styling - normal or spaced text modes
- Full color control - including transparency settings
- Size customization - independent sizing for each element
- Personal signature - add your trading brand
- Custom symbols - personalize arrows and indicators
Perfect for:
Content creators, educational posts, professional setups, and social media sharing.
Easy to use: Works immediately with smart defaults. Fully customizable to match your style.
Clean charts, professional presentation.

UNITED TRADING COMMUNITY WaterMarkWATER MARK indicator. Will allow you to improve the order of the entries you need on the chart.
1. Name and date for the traded instrument
2. Watermarks to protect your charts (in the center and around the perimeter of the chart)
3. The new "notes" option will allow you to keep focus on the factors that are important to you on the chart.
Very flexible settings for any notes, labels, watermarks on the chart that are important to you.
Индикатор WATER MARK . Даст возможность вам улучшить порядок нужных вам записей на графике.
1. Название и дата для торгуемого инструмента
2. Водные знаки для защиты ваших графиков ( в центре и по периметру графика)
3. Новая опция "заметки" позволит вам держать фокус на важных для вас факторах на графике.
Очень гибкая настройка , любых значимых для вас заметок , лейблов , вотермарк на графике.

EZ_Algo Copyright label
This script overlays a fully adjustable watermark on your chart, featuring:
A bold Main Title (e.g., your brand or name) and Subtitle (e.g., a tagline or ID).
Optional extras like a copyright notice, logo symbol, warning message, and chart info (symbol, timeframe, timestamp, or close price).
A subtle repeating overlay pattern to deter theft.
Flexible positioning, sizing, and color options to match your vib
e
It’s built for traders who want to protect their charts and make them stand out, all in a few clicks.
How to Use It
Add to Chart: Click "Add to Chart" and watch the default watermark appear (e.g., "EZ ALGO" at the top).
Customize It:
Main Title: Set your brand (e.g., "EZ ALGO") under "Main Title". Tweak color, size, and alignment.
Subtitle: Add a tagline (e.g., "Algo Trading") and trader ID (e.g., "@EZ_Algo
") with matching style options.
Text Opacity: Adjust "Text Opacity" in "Appearance" to control title and subtitle transparency (0 = solid, 100 = invisible).
Chart Info: Toggle "Show Chart Info" to display symbol and timestamp, or add "Show Close Price" for extra data.
Extras: Enable "Show Copyright" for a © notice, "Show Logo" for a symbol (e.g., ★), or "Show Warning" to shout "DO NOT COPY".
Overlay Pattern: Turn on "Show Overlay Pattern" to repeat a phrase (e.g., "EZ Algo") across the chart.
Positioning: Pick vertical/horizontal spots (top, middle, bottom; left, center, right) or try "Randomize Main Position" for a surprise placement.
Appearance: Set a "Background Color" and "Background Opacity" for the watermark’s backdrop.
Cell Size: Adjust "Cell Width (%)" and "Cell Height (%)" to resize the watermark (0 = auto-fit).
Apply & Share: Hit "OK" to save settings, then screenshot or share your branded chart with confidence!
Tips
Use a semi-transparent background (e.g., 50 opacity) to keep the chart readable.
Experiment with "Randomize Main Position" for a dynamic look.
Pair a bold logo with a faint overlay pattern for max branding power.
Credits
Inspired by @KristaKT
thanks for the great ideas!
Enjoy marking your charts with flair and protection! Questions? Drop a comment below.

BB Context PanelThe BB Context Panel indicator is designed to provide a customizable and informative overlay on your chart. It offers key contextual details to enhance your trading experience by combining essential market data, user-defined messages, and time-based insights in an easily accessible panel. Whether you use it for quick reference, sharing screenshots, or maintaining focus with motivational reminders, this tool adapts to your unique trading needs.
Key Features
1. Futures Contract Tracking:
• Automatically displays the current or nearest futures contract (e.g., MNQH5), including support for continuous contracts.
• Adjusts dynamically based on the quarterly roll schedule (March, June, September, December).
2. Time and Date Display:
• Choose to display either:
• Bar Time: Reflects the timestamp of the most recent bar.
• Current Time: Updates in real time based on your selected timezone.
• Formats the timestamp as hh:mm Day mm-dd-yy for easy readability.
3. Custom User Messages:
• Add personalized messages, motivational reminders, or trading affirmations (e.g., “Patience | Discipline | Confidence”).
• Supports multiline messages for greater customization.
4. Customizable Placement:
• Select from multiple placement options (e.g., Top Right, Bottom Left, etc.) to integrate seamlessly with your chart layout.
5. Time Zone Support:
• Supports a wide range of global time zones, ensuring accurate time synchronization based on your location or trading session preferences.
6. Clean and Minimalist Design:
• Aesthetic panel with customizable text and background colors for better integration with your chart theme.
• Bolded key information like contract symbols and timeframes for quick recognition.
How to Use
1. Enable the Context Panel:
• Select a location for the panel using the Show Chart Context Panel? setting (e.g., Top Right).
2. Choose Time Display:
• Decide whether to show Bar Time, Current Time, or disable the time display entirely (None).
3. Add Custom Messages:
• Use the Panel Message input to add motivational reminders, strategy notes, or any text you’d like to see during your trading sessions.
4. Set Your Time Zone:
• Configure the time zone using the Select Timezone dropdown to ensure time data aligns with your trading hours.
Example Use Cases
1. Screenshot-Friendly Context:
• Capture annotated screenshots with clear context, including contract symbol, timeframe, timestamp, and reminders.
2. Quick Market Overview:
• Use the panel to stay informed about the current futures contract and trading session details without cluttering your chart.
3. Trading Psychology Support:
• Display affirmations like “Patience | Discipline | Confidence” to help maintain focus and emotional discipline while trading.

Watermark with dynamic variables [BM]█ OVERVIEW
This indicator allows users to add highly customizable watermark messages to their charts. Perfect for branding, annotation, or displaying dynamic chart information, this script offers advanced customization options including dynamic variables, text formatting, and flexible positioning.
█ CONCEPTS
Watermarks are overlay messages on charts. This script introduces placeholders — special keywords wrapped in % signs — that dynamically replace themselves with chart-related data. These watermarks can enhance charts with context, timestamps, or branding.
█ FEATURES
Dynamic Variables : Replace placeholders with real-time data such as bar index, timestamps, and more.
Advanced Customization : Modify text size, color, background, and alignment.
Multiple Messages : Add up to four independent messages per group, with two groups supported (A and B).
Positioning Options : Place watermarks anywhere on the chart using predefined locations.
Timezone Support : Display timestamps in a preferred timezone with customizable formats.
█ INPUTS
The script offers comprehensive input options for customization. Each Watermark (A and B) contains identical inputs for configuration.
Watermark settings are divided into two levels:
Watermark-Level Settings
These settings apply to the entire watermark group (A/B):
Show Watermark: Toggle the visibility of the watermark group on the chart.
Position: Choose where the watermark group is displayed on the chart.
Reverse Line Order: Enable to reverse the order of the lines displayed in Watermark A.
Message-Level Settings
Each watermark contains up to four configurable messages. These messages can be independently customized with the following options:
Message Content: Enter the custom text to be displayed. You can include placeholders for dynamic data.
Text Size: Select from predefined sizes (Tiny, Small, Normal, Large, Huge) or specify a custom size.
Text Alignment and Colors:
- Adjust the alignment of the text (Left, Center, Right).
- Set text and background colors for better visibility.
Format Time: Enable time formatting for this watermark message and configure the format and timezone. The settings for each message include message content, text size, alignment, and more. Please refer to Formatting dates and times for more details on valid formatting tokens.
█ PLACEHOLDERS
Placeholders are special keywords surrounded by % signs, which the script dynamically replaces with specific chart-related data. These placeholders allow users to insert dynamic content, such as bar information or timestamps, into watermark messages.
Below is the complete list of currently available placeholders:
bar_index , barstate.isconfirmed , barstate.isfirst , barstate.ishistory , barstate.islast , barstate.islastconfirmedhistory , barstate.isnew , barstate.isrealtime , chart.is_heikinashi , chart.is_kagi , chart.is_linebreak , chart.is_pnf , chart.is_range , chart.is_renko , chart.is_standard , chart.left_visible_bar_time , chart.right_visible_bar_time , close , dayofmonth , dayofweek , dividends.future_amount , dividends.future_ex_date , dividends.future_pay_date , earnings.future_eps , earnings.future_period_end_time , earnings.future_revenue , earnings.future_time , high , hl2 , hlc3 , hlcc4 , hour , last_bar_index , last_bar_time , low , minute , month , ohlc4 , open , second , session.isfirstbar , session.isfirstbar_regular , session.islastbar , session.islastbar_regular , session.ismarket , session.ispostmarket , session.ispremarket , syminfo.basecurrency , syminfo.country , syminfo.currency , syminfo.description , syminfo.employees , syminfo.expiration_date , syminfo.industry , syminfo.main_tickerid , syminfo.mincontract , syminfo.minmove , syminfo.mintick , syminfo.pointvalue , syminfo.prefix , syminfo.pricescale , syminfo.recommendations_buy , syminfo.recommendations_buy_strong , syminfo.recommendations_date , syminfo.recommendations_hold , syminfo.recommendations_sell , syminfo.recommendations_sell_strong , syminfo.recommendations_total , syminfo.root , syminfo.sector , syminfo.session , syminfo.shareholders , syminfo.shares_outstanding_float , syminfo.shares_outstanding_total , syminfo.target_price_average , syminfo.target_price_date , syminfo.target_price_estimates , syminfo.target_price_high , syminfo.target_price_low , syminfo.target_price_median , syminfo.ticker , syminfo.tickerid , syminfo.timezone , syminfo.type , syminfo.volumetype , ta.accdist , ta.iii , ta.nvi , ta.obv , ta.pvi , ta.pvt , ta.tr , ta.vwap , ta.wad , ta.wvad , time , time_close , time_tradingday , timeframe.isdaily , timeframe.isdwm , timeframe.isintraday , timeframe.isminutes , timeframe.ismonthly , timeframe.isseconds , timeframe.isticks , timeframe.isweekly , timeframe.main_period , timeframe.multiplier , timeframe.period , timenow , volume , weekofyear , year
█ HOW TO USE
1 — Add the Script:
Apply "Watermark with dynamic variables " to your chart from the TradingView platform.
2 — Configure Inputs:
Open the script settings by clicking the gear icon next to the script's name.
Customize visibility, message content, and appearance for Watermark A and Watermark B.
3 — Utilize Placeholders:
Add placeholders like %bar_index% or %timenow% in the "Watermark - Message" fields to display dynamic data.
Empty lines in the message box are reflected on the chart, allowing you to shift text up or down.
Using in the message box translates to a new line on the chart.
4 — Preview Changes:
Adjust settings and view updates in real-time on your chart.
█ EXAMPLES
Branding
DodgyDD's charts
Debugging
█ LIMITATIONS
Only supports variables defined within the script.
Limited to four messages per watermark.
Visual alignment may vary across different chart resolutions or zoom levels.
Placeholder parsing relies on correct input formatting.
█ NOTES
This script is designed for users seeking enhanced chart annotation capabilities. It provides tools for dynamic, customizable watermarks but is not a replacement for chart objects like text labels or drawings. Please ensure placeholders are properly formatted for correct parsing.
Additionally, this script can be a valuable tool for Pine Script developers during debugging . By utilizing dynamic placeholders, developers can display real-time values of variables and chart data directly on their charts, enabling easier troubleshooting and code validation.
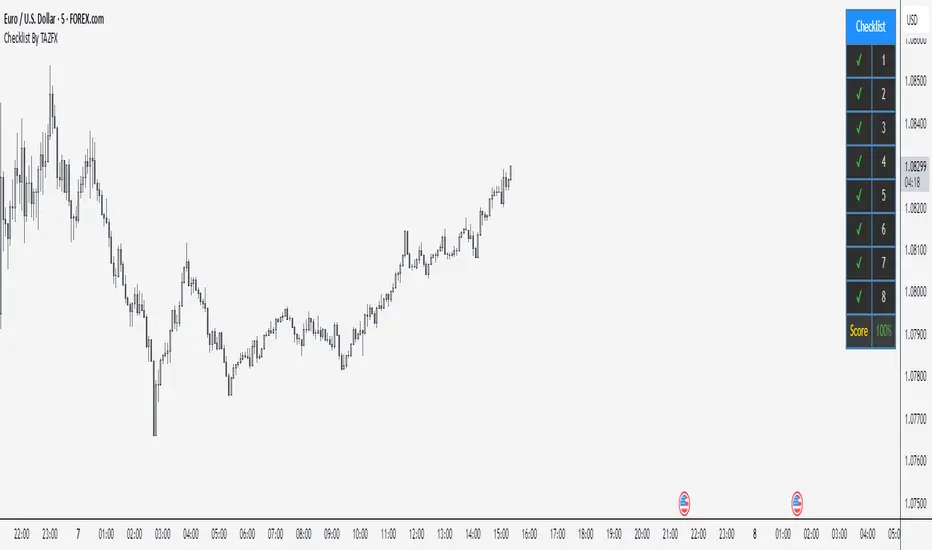
Checklist By TAZFX with Trade ScoreTrading Checklist is a customizable indicator designed for traders who want to stay disciplined and stick to their trading rules. Using this indicator, you can easily create and display your own personalized checklist of trading rules directly on your TradingView chart.
1. Customizable Settings:
• Positioning : Place the table in one of nine positions on the chart (e.g., bottom left, top right).
• Header : Modify the banner text, size, and color.
• Row Content : Define text for each row and control visibility.
• Appearance : Adjust text and background colors.
2. Checklist Table:
•Displays up to 8 rows with checkboxes (✅/❌) and custom labels for trade evaluation.
•Useful for tracking whether specific trade conditions or rules are met.
3. Trade Score Calculation:
•The Trade Score is a percentage that shows how many of your checklist items are checked compared to the total visible items.
WatermarkOverview
The "Watermark" indicator by PineWave is designed to display customizable text as a watermark on your TradingView charts. This can include the chart symbol, timeframe, current time, date, and day of the week. You can personalize the appearance and placement of the watermark to suit your preferences.
This script is an improved version of the original "Watermark" script by TradingView, enhanced with additional customization options and features. However, it is important to note that this indicator does not directly improve your trading performance; it is purely a visual enhancement tool for your charts.

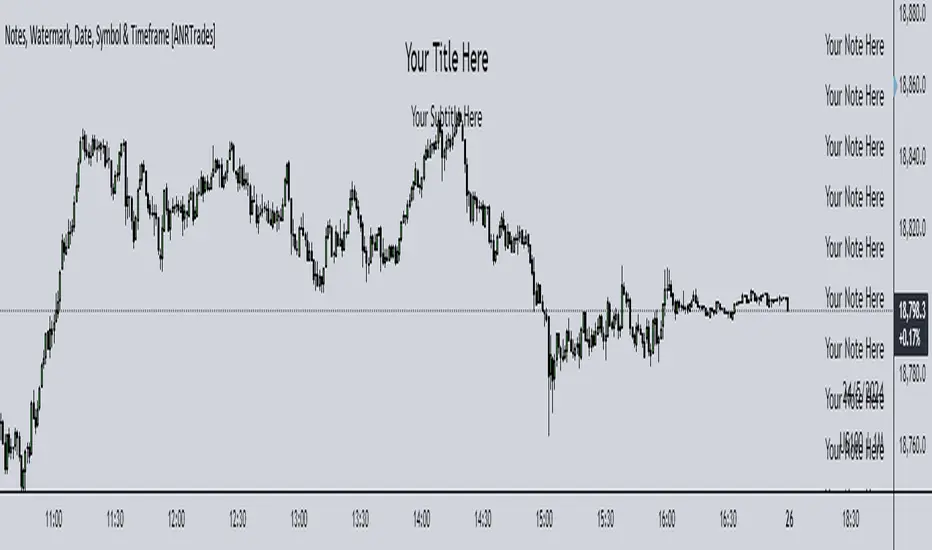
Watermark, Date, Symbol & Timeframe [ANR Trades]" Watermark, Date, Symbol & Timeframe " is a simple yet powerful TradingView indicator designed to provide essential information directly on your trading charts.
Key Features:
- Add a watermark with a title and subtitle to your charts. Customize the position, colour, and size to suit your preferences.
- View the current date, symbol, and timeframe directly on your chart.
This indicator is essential for traders who frequently save or share their chart images publicly who would want to watermark their chart as well as make it easier to know when it was, what symbol and what timeframe it was on.
date & symbolHey y'all
If you are like me and you keep a record of your performance, adding date and symbol information will surely help you.
You can choose English or Spanish, and also choose between full or abbreviated date. If you want to see the day and if you want to see the symbol.
You can customize position, text size, text color, background.
itradesize /\ Remaining Time - Candle close countdown A simple tool that displays the remaining time of M15, H1, H4, and D candles until they close.
Moreover, It works on all timeframes with all the exact data of the desired timeframe.
It can be such a useful tool when you using OHLC, AMD, and other theories. As you do not need to scrub back and forth through different timeframes to look for a bar close.
Notes:
• The Remaining Time Table only works in real time. It will show a “-“ sign, when you are in a replay mode.
This indicator has a Watermark section too where you can add your name/title/etc.. additionally, it shows the symbol, current timeframe, current date and you are able to customise them.
