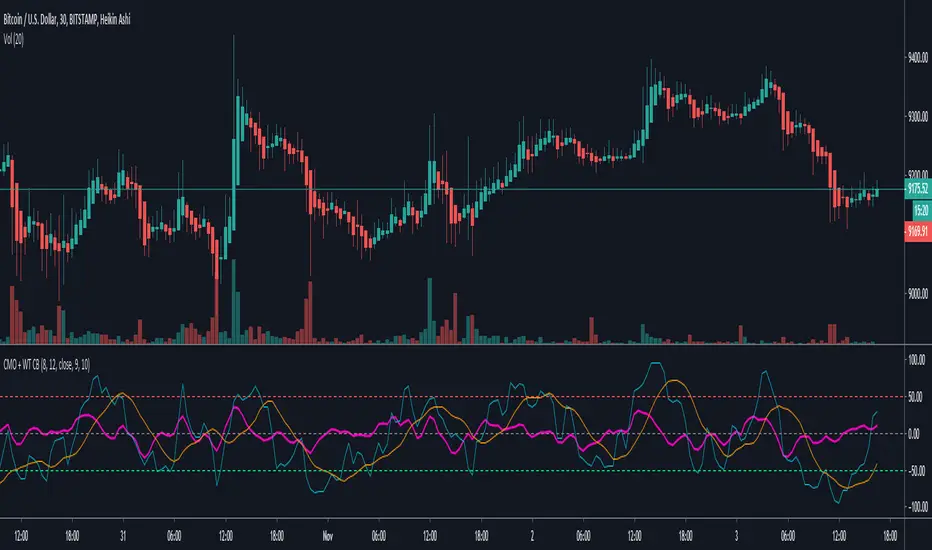
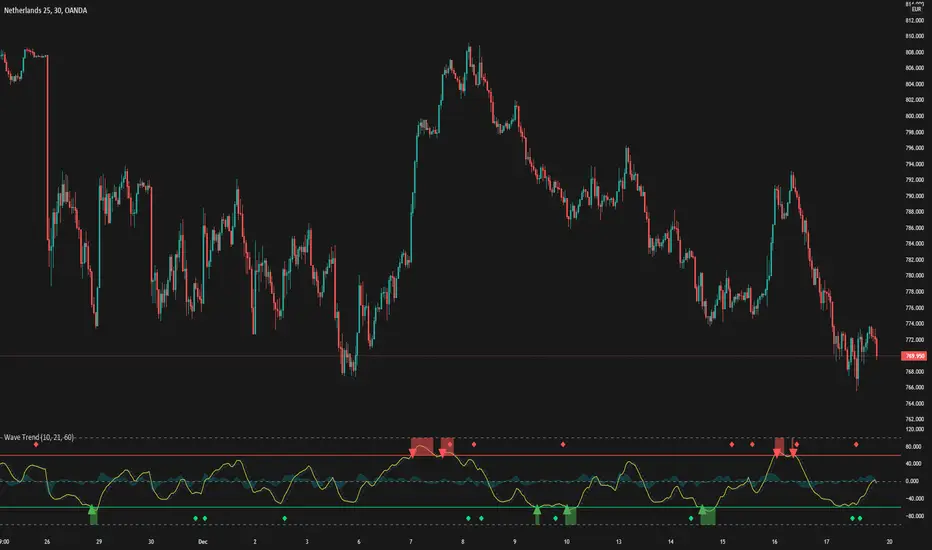
Chande Momentum Oscillator + WaveTrend Oscillator [ChuckBanger]This is a combination of Lazybears WaveTrend Oscillator (purple line) and Chande Momentum Oscillator (blue line with the orange line as a signal line). Use WaveTrend as a confirmation tool. It is consider as a selling point when CMO is over the red horizontal dotted line. The opposite applies if CMO line is under the red horizontal dotted line.
You can also use this with WaveTrand to confirm the sell or buy point. When WT line is over center line and CMO has crossed over it's signal line. It is a buy point. The opposite applies if WT line is under the center line and CMO is under its signal line.
Wavetrend
Liens Wavetrend.V2 - DivergenceWavetrend.V2
1. showing Regular Bearish and bullish divergence.
2. showing Hidden Bearish and bullish divergence.
3. Alerts for buy and sell signals.
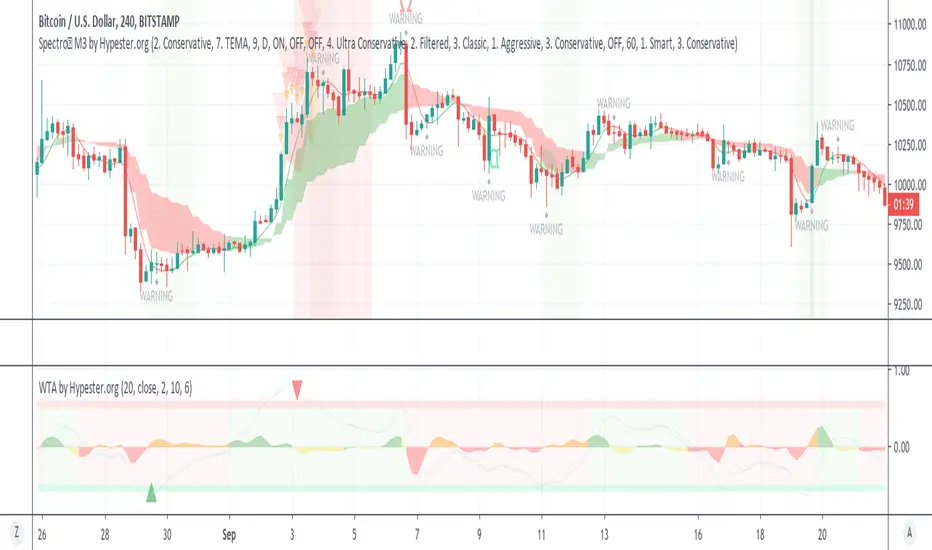
WaveTrend Anomaly by HypesterAs requested by the Alpha community, here's our release.
This is a different type of Wavetrend indicator; here, we have a statistical approach to the waves. We normalize the trends as a reference to measure how much every move differs from the average.
If the move is too far out, it tends to go back to the average as a rule. This indicator yields a %. As you can see, most of the moves tend to stay within 0.5 and -0.5. Remember the fact that 0.5 means 50%, the negative factor here only determines direction.
Funny the fact that most crossings happen within the 0.5 and -0.5, which means they occur before the odds are against them all the time. That highlights the chaotic nature of the markets.
However, the outliers, the moves that extrapolate the 50%, tend to go back to the average quickly, and the big triangles highlight this crossing.
You can also display every single crossing and its direction in the options panel.
There're more customization capabilities in the panel, too, like length, source, and so on.
Now to the background color options, when it's green, we have a confirmed bull movement, and red is a confirmed bear.
The area oscillator is the slope between the fast and slow oscillator lines. Here you can see when the trend is reversing or losing its strength. The orange slope color happens when you have a bearish trend, for instance. The yellow slope happens with a bull trend but a negative momentum. By mixing the colors, you can evaluate if it's strong enough for a full reversal and so on.
This same approach could be handy to spot bottoms and tops.
Multi momentum indicatorScript contains couple momentum oscillators all in one pane
List of indicators:
RSI
Stochastic RSI
MACD
CCI
WaveTrend by LazyBear
MFI
Default active indicators are RSI and Stochastic RSI
Other indicators are disabled by default
RSI, StochRSI and MFI are modified to be bounded to range from 100 to -100. That's why overbought is 40 and 60 instead 70 and 80 while oversold -40 and -60 instead 30 and 20.
MACD and CCI as they are not bounded to 100 or 200 range, they are limited to 100 - -100 by default when activated (extras are simply hidden) but there is an option to show full indicator.
In settings there are couple more options like show crosses or show only histogram.
Default source for all indicators is close (except WaveTrend and MFI which use hlc3) and it could be changed but for all indicators.
There is an option for 2nd RSI which can be set for any timeframe and background calculated by Fibonacci levels.

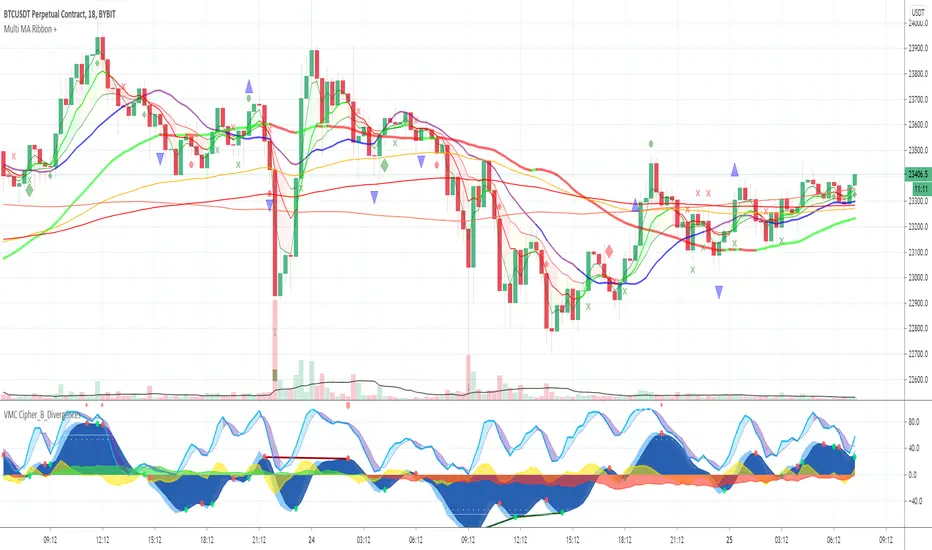
Multi MA Ribbon +Draws an MA Ribbon that highlights major MA's and for easier visibility separates them into different groups including Custom MA's, Baseline MA's, T Line MA's, Short Term MA's and Long Term MA's.
Choose between 11 different types of MA's thanks to JustUncleL and John F. Ehlers super smoother.
The + is for various signals and alerts derived from Market Cipher / Wave Trend indicators and TCG etc.
Happy Trading and remember just follow the flow of the river!
[AU] Waves+ Waves+ v0R7b
Plus version of Waves with components from both Waves Advanced and Mnemosyne. Essentially, Waves+ is highly configurable hybrid wavetrend oscillator and Fibonacci oscillator.
Slow wavetrend component replaced by Follower/Base from Mnemosyne indicator
TTM Squeeze Loose/Strict + Explosion Zones now enabled by default
Extreme Caution Fast Wavetrend Line, Fast wavetrend and Extreme Caution Fast WT cross signal now available
Disabled/removed to speed up script performance and load time: Divergence component, stoch k crossovers, T1 signals. Draw objects reduced from 89 to 64 to conform to Pinescript v4 requirements.
Large inactive code blocks stripped/removed to speed up performance and load time

WaveTrend with Crosses [LazyBear]Optical Change
Source from LazyBear
With big Hugs for this Indicator

WaveTrend - Market Cipher BHey guys,
Just releasing a quick copy of LazyBear's wavetrend indicator slightly modified to be more reactive and contains a few other extras for people who don't have pro like a stochastic and RSI indicator above the wave to find more confluence.
The indicator will show crosses but shows them below the indicator as well if they are stronger removing some noise.


BreakingDawn [JackTz] V4 (study)Another take on extending LazyBear's WaveTrend indicator. This one eliminates lots of the lost trades on the sudden drop of the price.
Have a look at it and let me know your thoughts.
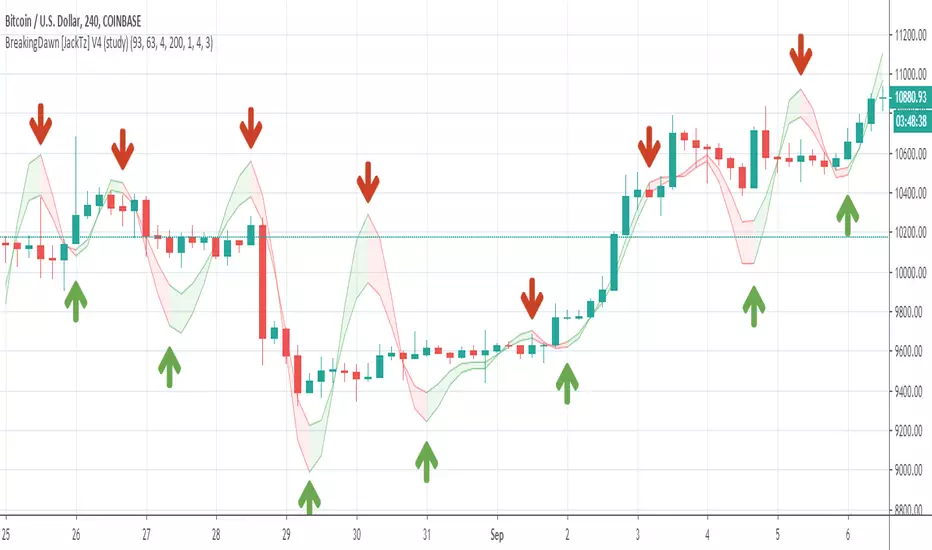
BreakingDawn [JackTz]Designed for 4 hour charts - No repaint.
BreakingDawn tries to anticipate the trend change before the actual break from one trend to another. This is an extenstion to WaveTrend from LazyBear.
Cudos to LazyBear for his awesome WaveTrend script!
//Jack


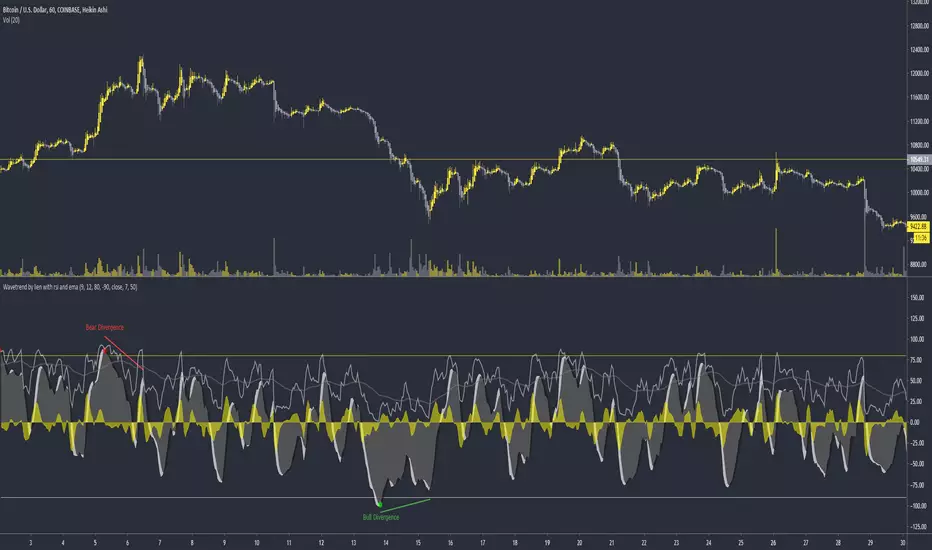
Liens wavetrend with rsi and emaWavetrend with rsi and ema. I would use the rsi and ema on high timeframes like the 4 hour to exit trades when it crosses.
Rsi and ema crosses can also be used to enter without divergence.
Test it out, try it on different TF. Enjoy :-)
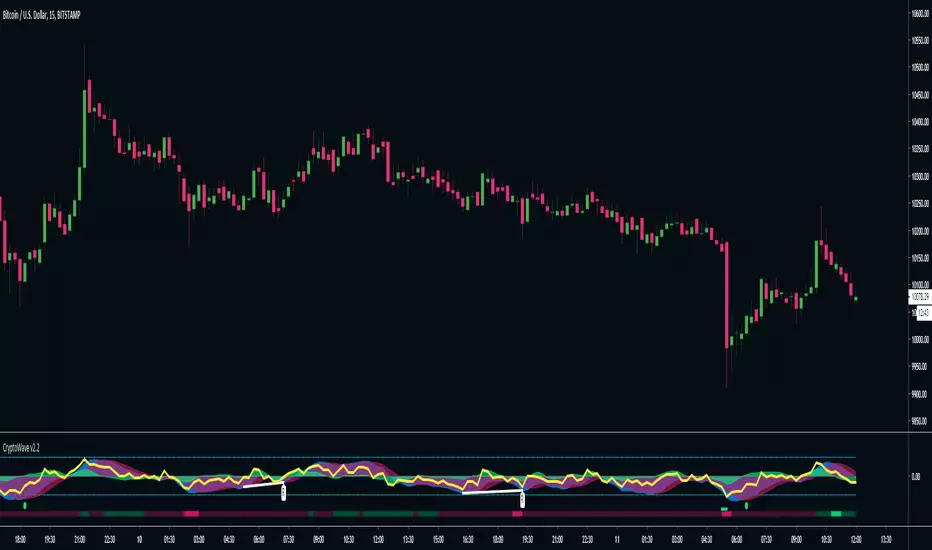
CryptoWave Pro v2CryptoWave Pro v2 delivers the same great wave algorithm as the previous version, but offers more customisation options to allow power users to fine tune every last piece of the puzzle.
In addition to the wave you'll now see the following :
Yellow line = RSI
Red and Green lines (above and below the waves dots) = RSI OB and OS
White lines + labels = Wave Divergence indicator - Showing Regular and Hidden divergences
Coloured Bar at bottom = Money Flow - Bright Red = OS, Bright Green = OB
Super clean and easy to read at a glance, CryptoWave Pro v2 is the upgrade you've been waiting for!
WaveTrendThis is a trend Analysis indicator request by Taleeto
To fully use this script, you will need a security key from him.
It alerts you when to buy or sell based on the market conditions
WaveTrend Oscillator V2Version 2 of the Wave Trend Indicator now includes a test strategy feature.
Same Entry and Exit Conditions as before. These values can be adjusted to pick up higher bottoms if needed. This strategy appears to work well with Cannabis stocks and has been tested out with TSX:ACB , TSX:HEXO , TSX:CRON , TSXV:OGI just to name a few.
Entry and Exits:
Entry when Wave cross occurs below or within the bottom band
Exit when Wave cross occurs above or within the top band
Alert Settings:
"Buy" is less than "Over Sold Top"
"Sell" is greater than "Over Bought Bottom"
As always, trade at your own risk. Recommended to confirm entry and exits with other oscillators such as Stochastic, RSI or MACD.

WaveTrend OscillatorSimilar to other Wave Trend Oscillators out there but I added "Buy" & "Sell" signals and alerts can set as well.
Entry and Exits:
Entry when Wave cross occurs below or within the bottom band
Exit when Wave cross occurs above or within the top band
Alert Settings:
"Buy" is less than "Over Sold Top"
"Sell" is greater than "Over Bought Bottom"

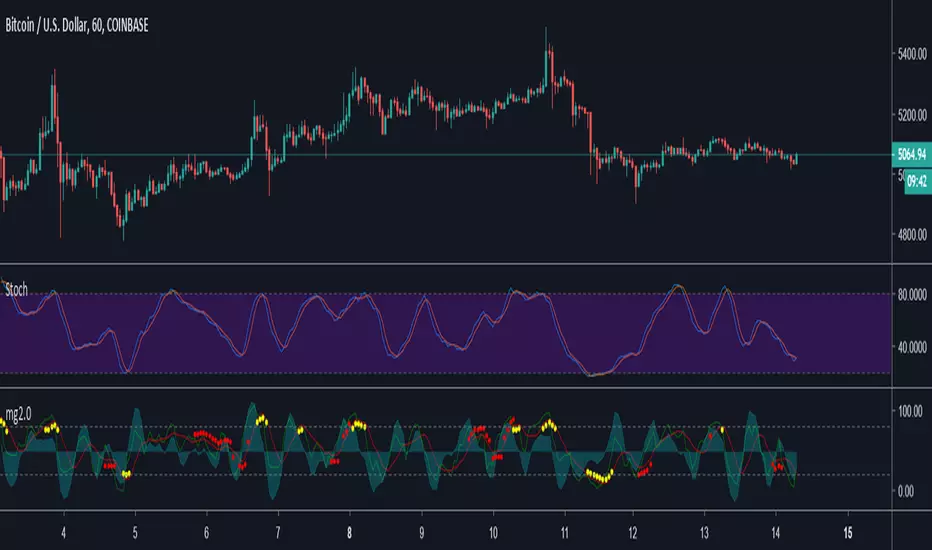
Minimal Godmode 2.0Second iteration of Minimal Godmode with in-line TTM Squeeze linked to godmode channel length, TTSI from godmode 4.0.0, and new LRSI + CBCI calculations for godmode engine.
Note: Like the original godmode, this indicator is designed specifically for use in trading BTC/XBT pairs.
APEX - WaveTrend [v1]WaveTrend is a smoothed oscillator which enables it to detect true reversals in an extremely accurate manner. The beauty of this indicator is that does not generate signals during choppy sideways markets.
The basic settings are 10 / 3 / 4 these are very aggressive settings, that will generate a lot of signals in all even not so volatile markets. If you need high-quality signals you settings close to 10 / 3 /21. The strongest buy/sell signals are given when the cross occurs above or below the threshold. In the 10 / 3 / 4 you threshold for buy should be around -90 values. If you use the very smoothed variant the threshold will be around -45 to -50 values.
This indicator will be first available in APEX v1 currently being beta tested.

Waddah Attar Explosion and WaveTrend Oscillator combinedWaddah Attar Explosion by LazyBear and WaveTrend Oscillator by Krypt.
All credits goes to LazyBear and Krypt, i have only done some combining with the two indicators, barcolors and BG colors to clarify entrys and exits.
Combine with CM_Williams Vix_Fix, Super Guppy R1.0 by JustUncleL and you have a powerful tool.
Barcolors to look for
Aggressive Buy 1 = Lime
Agressive Buy 2 = Aqua
Buy = Green
Sell 1 = Orange
Sell 2 = Red
This is my first try, so be nice to me :-)

LazyBear's Wave Trend Strategy by SDMFHello.
This is a strategy using the Lazy Bears Wave Trend indicator which he was so nice to release for free.
I heavily modified it and added a huge amount of options for the indicator as well as for the strategy.
Unfortunately it's locked with a passcode for now so my friends can use it
The results above are nit picked for oil 15 minute chart.
using 40% of our equity per trade on 50x leverage.
these are not 100% realistic altho shouldn't be too far from the truth.
Have not tried it on crypto.
Script is in Beta version and will get upgraded plenty in the near future.

