BBands + Overbought/Oversold MarkersAdvanced Bollinger Bands indicator with overbought/oversold signals, automatic squeeze detection, and multi-timeframe (MTF) capabilities.
Retains all functions of the original Bollinger Bands indicator from TradingView with a few added features:
Overbought/Oversold Markers: Visual signals when price opens and closes outside the bands
🔴 Red Highlight & Arrow → Price opens & closes above the upper BB (potential overbought/excess momentum).
🟢 Green Highlight & Arrow → Price opens & closes below the lower BB (potential oversold/reversal).
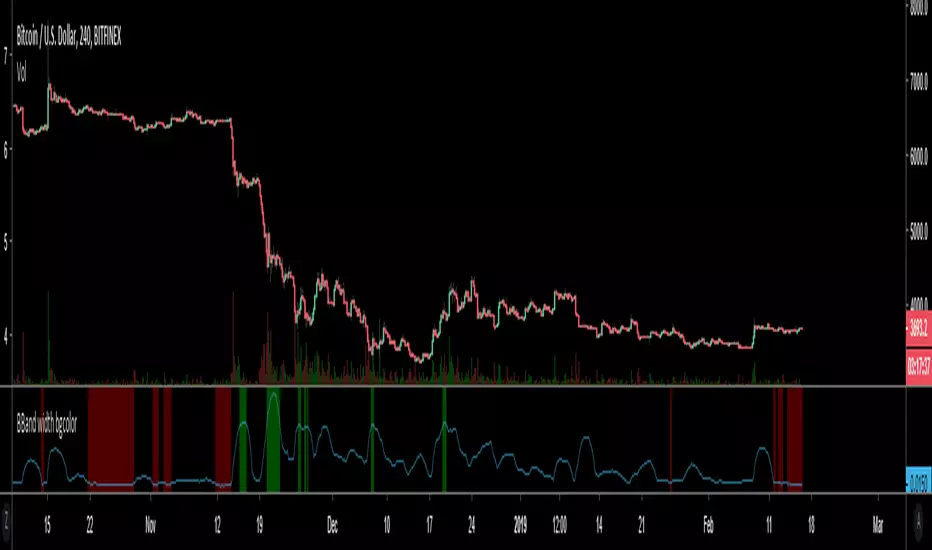
Squeeze Detection: Automatically highlights when bandwidth reaches its lowest point (narrowest BB width) in the lookback period, signalling potential breakout zones
Multi-Timeframe Bands: Display Bollinger Bands from any timeframe on your current chart (e.g., weekly bands on a daily chart), including markers and squeeze zones
Dual Rendering MTF Modes: Choose between traditional plots (unlimited history) or smooth line drawing (~125-165 MTF bars of history)
Built-in Alerts: Set alerts for overbought conditions, oversold conditions, squeeze detection, or any combination
Fully Customizable: Adjust MA type (SMA/EMA/RMA/WMA/VWMA), standard deviation multiplier, colors, and marker styles
Perfect for: Swing traders, MTF analysis, volatility-based entries, and identifying consolidation/expansion cycles.
Pine Script® indicator