Bollinger Adaptive Trend Navigator [QuantAlgo]🟢 Overview
The Bollinger Adaptive Trend Navigator synthesizes volatility channel analysis with variable smoothing mechanics to generate trend identification signals. It uses price positioning within Bollinger Band structures to modify moving average responsiveness, while incorporating ATR calculations to establish trend line boundaries that constrain movement during volatile periods. The adaptive nature makes this indicator particularly valuable for traders and investors working across various asset classes including stocks, forex, commodities, and cryptocurrencies, with effectiveness spanning multiple timeframes from intraday scalping to longer-term position analysis.
🟢 How It Works
The core mechanism calculates price position within Bollinger Bands and uses this positioning to create an adaptive smoothing factor:
bbPosition = bbUpper != bbLower ? (source - bbLower) / (bbUpper - bbLower) : 0.5
adaptiveFactor = (bbPosition - 0.5) * 2 * adaptiveMultiplier * bandWidthRatio
alpha = math.max(0.01, math.min(0.5, 2.0 / (bbPeriod + 1) * (1 + math.abs(adaptiveFactor))))
This adaptive coefficient drives an exponential moving average that responds more aggressively when price approaches Bollinger Band extremes:
var float adaptiveTrend = source
adaptiveTrend := alpha * source + (1 - alpha) * nz(adaptiveTrend , source)
finalTrend = 0.7 * adaptiveTrend + 0.3 * smoothedCenter
ATR-based volatility boundaries constrain the final trend line to prevent excessive movement during volatile periods:
volatility = ta.atr(volatilityPeriod)
upperBound = bollingerTrendValue + (volatility * volatilityMultiplier)
lowerBound = bollingerTrendValue - (volatility * volatilityMultiplier)
The trend line direction determines bullish or bearish states through simple slope comparison, with the final output displaying color-coded signals based on the synthesis of Bollinger positioning, adaptive smoothing, and volatility constraints (green = long/buy, red = short/sell).
🟢 Signal Interpretation
Rising Trend Line (Green): Indicates upward direction based on Bollinger positioning and adaptive smoothing = Potential long/buy opportunity
Falling Trend Line (Red): Indicates downward direction based on Bollinger positioning and adaptive smoothing = Potential short/sell opportunity
Built-in Alert System: Automated notifications trigger when bullish or bearish states change, allowing you to act on significant development without constantly monitoring the charts
Candle Coloring: Optional feature applies trend colors to price bars for visual consistency
Configuration Presets: Three parameter sets available - Default (standard settings), Scalping (faster response), and Swing Trading (slower response)
XAUUSD

RSI Trend Navigator [QuantAlgo]🟢 Overview
The RSI Trend Navigator integrates RSI momentum calculations with adaptive exponential moving averages and ATR-based volatility bands to generate trend-following signals. The indicator applies variable smoothing coefficients based on RSI readings and incorporates normalized momentum adjustments to position a trend line that responds to both price action and underlying momentum conditions.
🟢 How It Works
The indicator begins by calculating and smoothing the RSI to reduce short-term fluctuations while preserving momentum information:
rsiValue = ta.rsi(source, rsiPeriod)
smoothedRSI = ta.ema(rsiValue, rsiSmoothing)
normalizedRSI = (smoothedRSI - 50) / 50
It then creates an adaptive smoothing coefficient that varies based on RSI positioning relative to the midpoint:
adaptiveAlpha = smoothedRSI > 50 ? 2.0 / (trendPeriod * 0.5 + 1) : 2.0 / (trendPeriod * 1.5 + 1)
This coefficient drives an adaptive trend calculation that responds more quickly when RSI indicates bullish momentum and more slowly during bearish conditions:
var float adaptiveTrend = source
adaptiveTrend := adaptiveAlpha * source + (1 - adaptiveAlpha) * nz(adaptiveTrend , source)
The normalized RSI values are converted into price-based adjustments using ATR for volatility scaling:
rsiAdjustment = normalizedRSI * ta.atr(14) * sensitivity
rsiTrendValue = adaptiveTrend + rsiAdjustment
ATR-based bands are constructed around this RSI-adjusted trend value to create dynamic boundaries that constrain trend line positioning:
atr = ta.atr(atrPeriod)
deviation = atr * atrMultiplier
upperBound = rsiTrendValue + deviation
lowerBound = rsiTrendValue - deviation
The trend line positioning uses these band constraints to determine its final value:
if upperBound < trendLine
trendLine := upperBound
if lowerBound > trendLine
trendLine := lowerBound
Signal generation occurs through directional comparison of the trend line against its previous value to establish bullish and bearish states:
trendUp = trendLine > trendLine
trendDown = trendLine < trendLine
if trendUp
isBullish := true
isBearish := false
else if trendDown
isBullish := false
isBearish := true
The final output colors the trend line green during bullish states and red during bearish states, creating visual buy/long and sell/short opportunity signals based on the combined RSI momentum and volatility-adjusted trend positioning.
🟢 Signal Interpretation
Rising Trend Line (Green): Indicates upward momentum where RSI influence and adaptive smoothing favor continued price advancement = Potential buy/long positions
Declining Trend Line (Red): Indicates downward momentum where RSI influence and adaptive smoothing favor continued price decline = Potential sell/short positions
Flattening Trend Lines: Occur when momentum weakens and the trend line slope approaches neutral, suggesting potential consolidation before the next move
Built-in Alert System: Automated notifications trigger when bullish or bearish states change, sending "RSI Trend Bullish Signal" or "RSI Trend Bearish Signal" messages for timely entry/exit
Color Bar Candles Option: Optional candle coloring feature that applies the same green/red trend colors to price bars, providing additional visual confirmation of the current trend direction

Sequential Pattern Strength [QuantAlgo]🟢 Overview
The Sequential Pattern Strength indicator measures the power and sustainability of consecutive price movements by tracking unbroken sequences of up or down closes. It incorporates sequence quality assessment, price extension analysis, and automatic exhaustion detection to help traders identify when strong trends are losing momentum and approaching potential reversal or continuation points.
🟢 How It Works
The indicator's key insight lies in its sequential pattern tracking system, where pattern strength is measured by analyzing consecutive price movements and their sustainability:
if close > close
upSequence := upSequence + 1
downSequence := 0
else if close < close
downSequence := downSequence + 1
upSequence := 0
The system calculates sequence quality by measuring how "perfect" the consecutive moves are:
perfectMoves = math.max(upSequence, downSequence)
totalMoves = math.abs(bar_index - ta.valuewhen(upSequence == 1 or downSequence == 1, bar_index, 0))
sequenceQuality = totalMoves > 0 ? perfectMoves / totalMoves : 1.0
First, it tracks price extension from the sequence starting point:
priceExtension = (close - sequenceStartPrice) / sequenceStartPrice * 100
Then, pattern exhaustion is identified when sequences become overextended:
isExhausted = math.abs(currentSequence) >= maxSequence or
math.abs(priceExtension) > resetThreshold * math.abs(currentSequence)
Finally, the pattern strength combines sequence length, quality, and price movement with momentum enhancement:
patternStrength = currentSequence * sequenceQuality * (1 + math.abs(priceExtension) / 10)
enhancedSignal = patternStrength + momentum * 10
signal = ta.ema(enhancedSignal, smooth)
This creates a sequence-based momentum indicator that combines consecutive movement analysis with pattern sustainability assessment, providing traders with both directional signals and exhaustion insights for entry/exit timing.
🟢 Signal Interpretation
Positive Values (Above Zero): Sequential pattern strength indicating bullish momentum with consecutive upward price movements and sustained buying pressure = Long/Buy opportunities
Negative Values (Below Zero): Sequential pattern strength indicating bearish momentum with consecutive downward price movements and sustained selling pressure = Short/Sell opportunities
Zero Line Crosses: Pattern transitions between bullish and bearish regimes, indicating potential trend changes or momentum shifts when sequences break
Upper Threshold Zone: Area above maximum sequence threshold (2x maxSequence) indicating extremely strong bullish patterns approaching exhaustion levels
Lower Threshold Zone: Area below negative threshold (-2x maxSequence) indicating extremely strong bearish patterns approaching exhaustion levels

Moving Average Adaptive RSI [BackQuant]Moving Average Adaptive RSI
What this is
A momentum oscillator that reshapes classic RSI into a zero-centered column plot and makes it adaptive. It builds RSI from two parts:
• A sensitivity window that scans several recent bars to capture the strongest up and down impulses.
• A selectable moving average that smooths those impulses before computing RSI.
The output ranges roughly from −100 to +100 with 0 as the midline, with optional extra smoothing and built-in divergence detection.
How it works
Impulse extraction
• For each bar the script inspects the last rsi_sen bars and collects upward and downward price changes versus the current price.
• It keeps the maximum upward change and maximum downward change from that window, emphasizing true bursts over single-bar noise.
MA-based averaging
• The up and down impulse series are averaged with your chosen MA over rsi_len bars.
• Supported MA types: SMA, EMA, DEMA, WMA, HMA, SMMA (RMA), TEMA.
Zero-centered RSI transform
• RS = UpMA ÷ DownMA, then mapped to a symmetric scale: 100 − 200 ÷ (1 + RS) .
• Above 0 implies positive momentum bias. Below 0 implies negative momentum bias.
Optional extra smoothing
• A second smoothing pass can be applied to the final oscillator using smoothing_len and smooth_type . Toggle with “Use Extra Smoothing”.
Visual encoding
• The oscillator is drawn as columns around the zero line with a gradient that intensifies toward extremes.
• Static bands mark 80 to 100 and −80 to −100 for extreme conditions.
Key inputs and what they change
• Price Source : input series for momentum.
• Calculation Period (rsi_len) : primary averaging window on up and down components. Higher = smoother, slower.
• Sensitivity (rsi_sen) : how many recent bars are scanned to find max impulses. Higher = more responsive to bursts.
• Calculation Type (ma_type) : MA family that shapes the core behavior. HMA or DEMA is faster, SMA or SMMA is slower.
• Smoothing Type and Length : optional second pass to calm noise on the final output.
• UI toggles : show or hide the oscillator, candle painting, and extreme bands.
Reading the oscillator
• Midline cross up (0) : momentum bias turning positive.
• Midline cross down (0) : momentum bias turning negative.
• Positive territory :
– 0 to 40: constructive but not stretched.
– 40 to 80: strong momentum, continuation more likely.
– Above 80: extreme risk of mean reversion grows.
• Negative territory : mirror the same levels for the downside.
Divergence detection
The script plots four divergence types using pivot highs and lows on both price and the oscillator. Lookbacks are set by lbL and lbR .
• Regular bullish : price lower low, oscillator higher low. Possible downside exhaustion.
• Hidden bullish : price higher low, oscillator lower low. Bias to trend continuation up.
• Regular bearish : price higher high, oscillator lower high. Possible upside exhaustion.
• Hidden bearish : price lower high, oscillator higher high. Bias to trend continuation down.
Labels: ℝ for regular, ℍ for hidden. Green for bullish, red for bearish.
Candle coloring
• Optional bar painting: green when the oscillator is above 0, red when below 0. This is for visual scanning only.
Strengths
• Adaptive sensitivity via a rolling impulse window that responds to genuine bursts.
• Configurable MA core so you can match responsiveness to the instrument.
• Zero-centered scale for simple regime reads with 0 as a clear bias line.
• Built-in regular and hidden divergence mapping.
• Flexible across symbols and timeframes once tuned.
Limitations and cautions
• Trends can remain extended. Treat extremes as context rather than automatic reversal signals.
• Divergence quality depends on pivot lookbacks. Short lookbacks give more signals with more noise. Long lookbacks reduce noise but add lag.
• Double smoothing can delay zero-line transitions. Balance smoothness and timeliness.
Practical usage ideas
• Regime filter : only take long setups from your separate method when the oscillator is above 0, shorts when below 0.
• Pullback confirmation : in uptrends, look for dips that hold above 0 or turn up from 0 to 40. Reverse for downtrends.
• Divergence as a heads-up : wait for a zero-line cross or a price trigger before acting on divergence.
• Sensitivity tuning : start with rsi_sen 2 to 5 on faster timeframes, increase slightly on slower charts.
Alerts
• MA-A RSI Long : oscillator crosses above 0.
• MA-A RSI Short : oscillator crosses below 0.
Use these as bias or timing aids, not standalone trade commands.
Settings quick reference
• Calculation : Price Source, Calculation Type, Calculation Period, Sensitivity.
• Smoothing : Smoothing Type, Smoothing Length, Use Extra Smoothing.
• UI : Show Oscillator, Paint Candles, Show Static High and Low Levels.
• Divergences : Pivot Lookback Left and Right, Div Signal Length, Show Detected Divergences.
Final thoughts
This tool reframes RSI by extracting strong short-term impulses and averaging them with a moving-average model of your choice, then presenting a zero-centered output for clear regime reads. Pair it with your structure, risk and execution process, and tune sensitivity and smoothing to the market you trade.

Machine Learning BBPct [BackQuant]Machine Learning BBPct
What this is (in one line)
A Bollinger Band %B oscillator enhanced with a simplified K-Nearest Neighbors (KNN) pattern matcher. The model compares today’s context (volatility, momentum, volume, and position inside the bands) to similar situations in recent history and blends that historical consensus back into the raw %B to reduce noise and improve context awareness. It is informational and diagnostic—designed to describe market state, not to sell a trading system.
Background: %B in plain terms
Bollinger %B measures where price sits inside its dynamic envelope: 0 at the lower band, 1 at the upper band, ~ 0.5 near the basis (the moving average). Readings toward 1 indicate pressure near the envelope’s upper edge (often strength or stretch), while readings toward 0 indicate pressure near the lower edge (often weakness or stretch). Because bands adapt to volatility, %B is naturally comparable across regimes.
Why add (simplified) KNN?
Classic %B is reactive and can be whippy in fast regimes. The simplified KNN layer builds a “nearest-neighbor memory” of recent market states and asks: “When the market looked like this before, where did %B tend to be next bar?” It then blends that estimate with the current %B. Key ideas:
• Feature vector . Each bar is summarized by up to five normalized features:
– %B itself (normalized)
– Band width (volatility proxy)
– Price momentum (ROC)
– Volume momentum (ROC of volume)
– Price position within the bands
• Distance metric . Euclidean distance ranks the most similar recent bars.
• Prediction . Average the neighbors’ prior %B (lagged to avoid lookahead), inverse-weighted by distance.
• Blend . Linearly combine raw %B and KNN-predicted %B with a configurable weight; optional filtering then adapts to confidence.
This remains “simplified” KNN: no training/validation split, no KD-trees, no scaling beyond windowed min-max, and no probabilistic calibration.
How the script is organized (by input groups)
1) BBPct Settings
• Price Source – Which price to evaluate (%B is computed from this).
• Calculation Period – Lookback for SMA basis and standard deviation.
• Multiplier – Standard deviation width (e.g., 2.0).
• Apply Smoothing / Type / Length – Optional smoothing of the %B stream before ML (EMA, RMA, DEMA, TEMA, LINREG, HMA, etc.). Turning this off gives you the raw %B.
2) Thresholds
• Overbought/Oversold – Default 0.8 / 0.2 (inside ).
• Extreme OB/OS – Stricter zones (e.g., 0.95 / 0.05) to flag stretch conditions.
3) KNN Machine Learning
• Enable KNN – Switch between pure %B and hybrid.
• K (neighbors) – How many historical analogs to blend (default 8).
• Historical Period – Size of the search window for neighbors.
• ML Weight – Blend between raw %B and KNN estimate.
• Number of Features – Use 2–5 features; higher counts add context but raise the risk of overfitting in short windows.
4) Filtering
• Method – None, Adaptive, Kalman-style (first-order),
or Hull smoothing.
• Strength – How aggressively to smooth. “Adaptive” uses model confidence to modulate its alpha: higher confidence → stronger reliance on the ML estimate.
5) Performance Tracking
• Win-rate Period – Simple running score of past signal outcomes based on target/stop/time-out logic (informational, not a robust backtest).
• Early Entry Lookback – Horizon for forecasting a potential threshold cross.
• Profit Target / Stop Loss – Used only by the internal win-rate heuristic.
6) Self-Optimization
• Enable Self-Optimization – Lightweight, rolling comparison of a few canned settings (K = 8/14/21 via simple rules on %B extremes).
• Optimization Window & Stability Threshold – Governs how quickly preferred K changes and how sensitive the overfitting alarm is.
• Adaptive Thresholds – Adjust the OB/OS lines with volatility regime (ATR ratio), widening in calm markets and tightening in turbulent ones (bounded 0.7–0.9 and 0.1–0.3).
7) UI Settings
• Show Table / Zones / ML Prediction / Early Signals – Toggle informational overlays.
• Signal Line Width, Candle Painting, Colors – Visual preferences.
Step-by-step logic
A) Compute %B
Basis = SMA(source, len); dev = stdev(source, len) × multiplier; Upper/Lower = Basis ± dev.
%B = (price − Lower) / (Upper − Lower). Optional smoothing yields standardBB .
B) Build the feature vector
All features are min-max normalized over the KNN window so distances are in comparable units. Features include normalized %B, normalized band width, normalized price ROC, normalized volume ROC, and normalized position within bands. You can limit to the first N features (2–5).
C) Find nearest neighbors
For each bar inside the lookback window, compute the Euclidean distance between current features and that bar’s features. Sort by distance, keep the top K .
D) Predict and blend
Use inverse-distance weights (with a strong cap for near-zero distances) to average neighbors’ prior %B (lagged by one bar). This becomes the KNN estimate. Blend it with raw %B via the ML weight. A variance of neighbor %B around the prediction becomes an uncertainty proxy ; combined with a stability score (how long parameters remain unchanged), it forms mlConfidence ∈ . The Adaptive filter optionally transforms that confidence into a smoothing coefficient.
E) Adaptive thresholds
Volatility regime (ATR(14) divided by its 50-bar SMA) nudges OB/OS thresholds wider or narrower within fixed bounds. The aim: comparable extremeness across regimes.
F) Early entry heuristic
A tiny two-step slope/acceleration probe extrapolates finalBB forward a few bars. If it is on track to cross OB/OS soon (and slope/acceleration agree), it flags an EARLY_BUY/SELL candidate with an internal confidence score. This is explicitly a heuristic—use as an attention cue, not a signal by itself.
G) Informational win-rate
The script keeps a rolling array of trade outcomes derived from signal transitions + rudimentary exits (target/stop/time). The percentage shown is a rough diagnostic , not a validated backtest.
Outputs and visual language
• ML Bollinger %B (finalBB) – The main line after KNN blending and optional filtering.
• Gradient fill – Greenish tones above 0.5, reddish below, with intensity following distance from the midline.
• Adaptive zones – Overbought/oversold and extreme bands; shaded backgrounds appear at extremes.
• ML Prediction (dots) – The KNN estimate plotted as faint circles; becomes bright white when confidence > 0.7.
• Early arrows – Optional small triangles for approaching OB/OS.
• Candle painting – Light green above the midline, light red below (optional).
• Info panel – Current value, signal classification, ML confidence, optimized K, stability, volatility regime, adaptive thresholds, overfitting flag, early-entry status, and total signals processed.
Signal classification (informational)
The indicator does not fire trade commands; it labels state:
• STRONG_BUY / STRONG_SELL – finalBB beyond extreme OS/OB thresholds.
• BUY / SELL – finalBB beyond adaptive OS/OB.
• EARLY_BUY / EARLY_SELL – forecast suggests a near-term cross with decent internal confidence.
• NEUTRAL – between adaptive bands.
Alerts (what you can automate)
• Entering adaptive OB/OS and extreme OB/OS.
• Midline cross (0.5).
• Overfitting detected (frequent parameter flipping).
• Early signals when early confidence > 0.7.
These are purely descriptive triggers around the indicator’s state.
Practical interpretation
• Mean-reversion context – In range markets, adaptive OS/OB with ML smoothing can reduce whipsaws relative to raw %B.
• Trend context – In persistent trends, the KNN blend can keep finalBB nearer the mid/upper region during healthy pullbacks if history supports similar contexts.
• Regime awareness – Watch the volatility regime and adaptive thresholds. If thresholds compress (high vol), “OB/OS” comes sooner; if thresholds widen (calm), it takes more stretch to flag.
• Confidence as a weight – High mlConfidence implies neighbors agree; you may rely more on the ML curve. Low confidence argues for de-emphasizing ML and leaning on raw %B or other tools.
• Stability score – Rising stability indicates consistent parameter selection and fewer flips; dropping stability hints at a shifting backdrop.
Methodological notes
• Normalization uses rolling min-max over the KNN window. This is simple and scale-agnostic but sensitive to outliers; the distance metric will reflect that.
• Distance is unweighted Euclidean. If you raise featureCount, you increase dimensionality; consider keeping K larger and lookback ample to avoid sparse-neighbor artifacts.
• Lag handling intentionally uses neighbors’ previous %B for prediction to avoid lookahead bias.
• Self-optimization is deliberately modest: it only compares a few canned K/threshold choices using simple “did an extreme anticipate movement?” scoring, then enforces a stability regime and an overfitting guard. It is not a grid search or GA.
• Kalman option is a first-order recursive filter (fixed gain), not a full state-space estimator.
• Hull option derives a dynamic length from 1/strength; it is a convenience smoothing alternative.
Limitations and cautions
• Non-stationarity – Nearest neighbors from the recent window may not represent the future under structural breaks (policy shifts, liquidity shocks).
• Curse of dimensionality – Adding features without sufficient lookback can make genuine neighbors rare.
• Overfitting risk – The script includes a crude overfitting detector (frequent parameter flips) and will fall back to defaults when triggered, but this is only a guardrail.
• Win-rate display – The internal score is illustrative; it does not constitute a tradable backtest.
• Latency vs. smoothness – Smoothing and ML blending reduce noise but add lag; tune to your timeframe and objectives.
Tuning guide
• Short-term scalping – Lower len (10–14), slightly lower multiplier (1.8–2.0), small K (5–8), featureCount 3–4, Adaptive filter ON, moderate strength.
• Swing trading – len (20–30), multiplier ~2.0, K (8–14), featureCount 4–5, Adaptive thresholds ON, filter modest.
• Strong trends – Consider higher adaptive_upper/lower bounds (or let volatility regime do it), keep ML weight moderate so raw %B still reflects surges.
• Chop – Higher ML weight and stronger Adaptive filtering; accept lag in exchange for fewer false extremes.
How to use it responsibly
Treat this as a state descriptor and context filter. Pair it with your execution signals (structure breaks, volume footprints, higher-timeframe bias) and risk management. If mlConfidence is low or stability is falling, lean less on the ML line and more on raw %B or external confirmation.
Summary
Machine Learning BBPct augments a familiar oscillator with a transparent, simplified KNN memory of recent conditions. By blending neighbors’ behavior into %B and adapting thresholds to volatility regime—while exposing confidence, stability, and a plain early-entry heuristic—it provides an informational, probability-minded view of stretch and reversion that you can interpret alongside your own process.

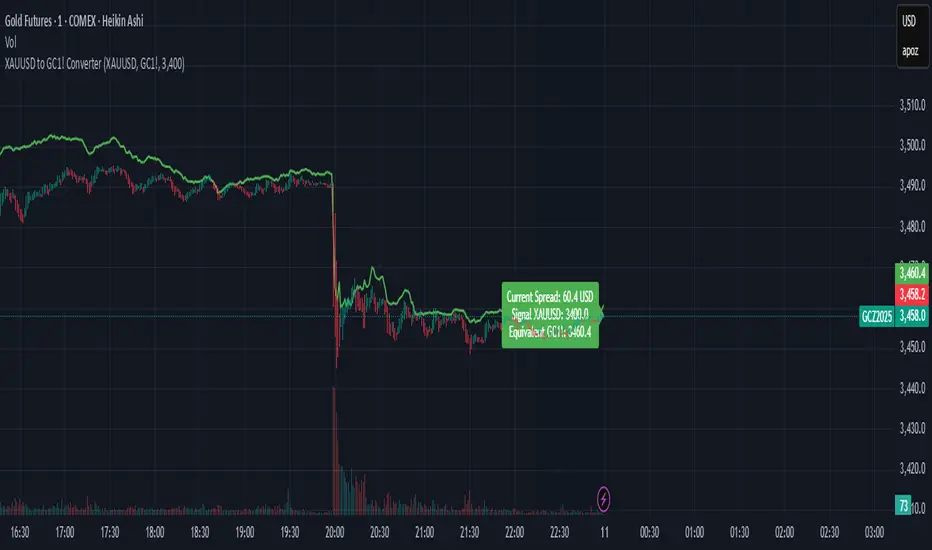
XAUUSD to GC1! ConverterThis simple utility indicator compares the spot gold price (XAUUSD) with the COMEX gold futures contract (GC1!).
It calculates the current spread between the two instruments and allows you to input a signal price on XAUUSD to instantly see the equivalent price on GC1!.
Perfect for traders who receive alerts on spot gold but execute on futures, ensuring seamless price adaptation.
Hassi XAUUSD STRATEGY BOTGold (XAUUSD) 15m trend+momentum based signals with EMA(9/21/200), RSI, custom ADX, ATR-based SL/TP & alerts
Works on XAUUSD 15m.
Entry: EMA9/21 cross + price relative to EMA200 + RSI filter + custom ADX trend strength.
Risk: default SL=1.5×ATR, TP=2×ATR (editable).
Notes: No financial advice. Backtest before live use. Avoid high-impact news whipsaws.

SD Bands Filtered Signals### SD Bands Filtered Signals: Reversion & Volatility Scanner
**Core Description:**
The SD Bands Filtered Signals is a tool developed to help traders identify more accurate buy and sell signals in sideways markets, or during periods of low price movement. It utilizes the principles of Standard Deviation (SD) and a Moving Average (MA), with a unique 'signal filtering' system added to reduce unnecessary noise.
**Key Features:**
* **SD Bands:** Creates upper and lower bands to define price volatility zones, providing a clear overview of market conditions.
* **Intelligent Reversal Signals:** Generates specially filtered Buy/Sell signals for a 'Reversion to the Mean' strategy. These signals appear only when the market has low volatility and the price touches the SD Bands.
* **Advanced Signal Filtering System:** Uses a **`Cooldown Bars`** variable to set a rest period between signals. This prevents repetitive arrows in the same zone, helping you find the best signal at the most suitable point.
* **Fully Customizable:** You can adjust the **`Length`**, **`Multiplier`**, **`Sideways Threshold`**, and **`Cooldown Bars`** to fit your trading style and asset of choice.
**How to Use:**
* **Buy Signal (Green Arrow Up):** Look for this signal when the market is sideways and the price moves down to touch the lower band (SD Low).
* **Sell Signal (Red Arrow Down):** Look for this signal when the market is sideways and the price moves up to touch the upper band (SD High).
* **Customization:** You can adjust the **`Cooldown Bars`** value to control the number of arrows. If you want more accurate but fewer signals, increase this value.
**Disclaimer:**
* This indicator is an **analytical tool only** and is not a 100% guarantee of profit.
* It should be used in conjunction with other forms of analysis, such as candlestick patterns, trading volume, and proper risk management.
ไทย
ชื่ออินดิเคเตอร์ "SD Bands Filtered Signals: Reversion & Volatility Scanner"
คำอธิบายหลัก:
อินดิเคเตอร์ SD Bands Filtered Signals เป็นเครื่องมือที่ถูกพัฒนาขึ้นเพื่อช่วยให้นักเทรดสามารถระบุสัญญาณซื้อ (Buy) และขาย (Sell) ที่แม่นยำขึ้นในตลาดแบบ Sideways หรือช่วงที่ราคาเคลื่อนที่ในกรอบแคบๆ โดยใช้หลักการของ Standard Deviation (SD) และ Moving Average (MA) และเพิ่มระบบ 'กรองสัญญาณ' ที่เป็นเอกลักษณ์เพื่อลดสัญญาณรบกวน (Noise) ที่ไม่จำเป็นออกไป
คุณสมบัติเด่น:
* SD Bands: สร้างเส้นขอบบนและล่างเพื่อระบุโซนความผันผวนของราคา ทำให้เห็นภาพรวมของตลาดได้ง่าย
* สัญญาณ Reversal อัจฉริยะ: สร้างสัญญาณ Buy/Sell ที่ถูกคัดกรองมาเป็นพิเศษสำหรับกลยุทธ์การกลับตัว (Reversion to the Mean) โดยจะปรากฏเฉพาะเมื่อตลาดมีความผันผวนต่ำและราคาแตะขอบของ SD Bands
* ระบบกรองสัญญาณขั้นสูง: ใช้ตัวแปร Cooldown Bars เพื่อกำหนดระยะเวลาพักสัญญาณ ทำให้ไม่เกิดลูกศรซ้ำๆ ในโซนเดียวกัน และช่วยให้คุณได้สัญญาณที่ดีที่สุดในจุดที่เหมาะสมที่สุด
* ปรับแต่งได้เต็มที่: คุณสามารถปรับค่า Length, Multiplier, Sideways Threshold และ Cooldown Bars เพื่อให้เข้ากับสไตล์การเทรดและคู่สินทรัพย์ที่คุณสนใจ
วิธีการใช้งาน:
* สัญญาณ Buy (ลูกศรสีเขียวขึ้น): มองหาสัญญาณนี้เมื่อตลาดอยู่ในช่วง Sideways และราคาวิ่งลงมาแตะเส้นขอบล่าง (SD Low)
* สัญญาณ Sell (ลูกศรสีแดงลง): มองหาสัญญาณนี้เมื่อตลาดอยู่ในช่วง Sideways และราคาวิ่งขึ้นไปแตะเส้นขอบบน (SD High)
* การปรับแต่ง: คุณสามารถปรับค่า Cooldown Bars เพื่อให้ได้จำนวนลูกศรที่ต้องการ หากต้องการสัญญาณที่แม่นยำขึ้นแต่จำนวนน้อยลง ให้เพิ่มค่านี้ให้สูงขึ้น
ข้อควรระวัง:
* อินดิเคเตอร์นี้เป็นเพียงเครื่องมือวิเคราะห์ ไม่ใช่สัญญาณที่การันตีผลกำไร 100%
* ควรใช้ประกอบกับการวิเคราะห์อื่นๆ เช่น รูปแบบแท่งเทียน, ปริมาณการซื้อขาย (Volume) และการจัดการความเสี่ยงที่เหมาะสม

TSD Quantum [Moeinudin Montazerfaraj] 🔸 "TSD" stands for **Trend 1-2-3 and Supply & Demand**, which is the foundation of the trading style this indicator is built upon.
🔹 TSD Quantum is a specialized indicator designed exclusively for day traders who trade EURUSD, XAUUSD (Gold), and DAX40 on the 1H, 15M, and 5M timeframes using a Supply & Demand-based strategy.
This indicator is **not suitable for other symbols** and has been tailored specifically for these three assets to ensure high precision and effectiveness.
---
### 🔍 Key Features:
✅ **Trading Checklist Panel**
A built-in checklist helps you track every rule in your trading plan. If even one condition is left unchecked, the system highlights it in red and marks the trade as "Not Allowed." This feature enhances trading discipline.
✅ **Spread & ATR Control Panel**
Supports both auto-calculated and fixed values for spread and ATR. This is especially helpful when placing stop-losses quickly and accurately.
✅ **Inside & Outside Candle Detection**
A dedicated panel highlights whether the last candle is inside or outside. Hovering your mouse over the chart elements automatically colorizes the candles:
🔵 Blue = Outside candle
🔴 Red = Inside candle
Also displays the high/low of the latest outside bar.
✅ **Weekly Trade Stats Panel**
Custom-built for the mentioned three assets. You can enter your trades using either fixed risk or floating risk models.
✅ **Performance Metrics**
Helps you build and adjust a floating risk model—so you don’t have to enter every trade with the same lot size. Improves risk management across multiple trades.
✅ **Base Candles Display**
Grey and white base candles are marked based on supply and demand zones.
✅ **EOT Candles**
Candles with a green dot underneath indicate valid EOT opportunities for potential move-outs.
✅ **RC (Rejection Candle) Detection**
RC candles are automatically detected to alert you of potential traps or weaknesses during Supply/Demand formations.
---
### ⚠️ Disclaimer
This indicator does **not** issue buy/sell signals and **cannot guarantee profit or prevent loss**. It is a **tool for discretionary trading**, not an automated expert advisor.
All decisions must be made by the trader based on their own strategy and risk tolerance.
This is the **latest tested version** of TSD Quantum. All features have been validated and function as intended. Future updates will be provided if needed.
---
🙏 Thank you for reviewing this script. We hope it becomes a valuable addition to your day trading toolkit!

Time-Price Velocity [QuantAlgo]🟢 Overview
The Time-Price Velocity indicator uses advanced velocity-based analysis to measure the rate of price change normalized against typical market movement, creating a dynamic momentum oscillator that identifies market acceleration patterns and momentum shifts. Unlike traditional momentum indicators that focus solely on price change magnitude, this indicator incorporates time-weighted displacement calculations and ATR normalization to create a sophisticated velocity measurement system that adapts to varying market volatility conditions.
This indicator displays a velocity signal line that oscillates around zero, with positive values indicating upward price velocity and negative values indicating downward price velocity. The signal incorporates acceleration background columns and statistical normalization to help traders identify momentum shifts and potential reversal or continuation opportunities across different timeframes and asset classes.
🟢 How It Works
The indicator's key insight lies in its time-price velocity calculation system, where velocity is measured using the fundamental physics formula:
velocity = priceChange / timeWeight
The system normalizes this raw velocity against typical price movement using Average True Range (ATR) to create market-adjusted readings:
normalizedVelocity = typicalMove > 0 ? velocity / typicalMove : 0
where "typicalMove = ta.atr(lookback)" provides the baseline for normal price movement over the specified lookback period.
The Time-Price Velocity indicator calculation combines multiple sophisticated components. First, it calculates acceleration as the change in velocity over time:
acceleration = normalizedVelocity - normalizedVelocity
Then, the signal generation applies EMA smoothing to reduce noise while preserving responsiveness:
signal = ta.ema(normalizedVelocity, smooth)
This creates a velocity-based momentum indicator that combines price displacement analysis with statistical normalization, providing traders with both directional signals and acceleration insights for enhanced market timing.
🟢 How to Use
1. Signal Interpretation and Threshold Zones
Positive Values (Above Zero): Time-price velocity indicating bullish momentum with upward price displacement relative to normalized baseline
Negative Values (Below Zero): Time-price velocity indicating bearish momentum with downward price displacement relative to normalized baseline
Zero Line Crosses: Velocity transitions between bullish and bearish regimes, indicating potential trend changes or momentum shifts
Upper Threshold Zone: Area above positive threshold (default 1.0) indicating strong bullish velocity and potential reversal point
Lower Threshold Zone: Area below negative threshold (default -1.0) indicating strong bearish velocity and potential reversal point
2. Acceleration Analysis and Visual Features
Acceleration Columns: Background histogram showing velocity acceleration (the rate of change of velocity), with green columns indicating accelerating velocity and red columns indicating decelerating velocity. The interpretation depends on trend context: red columns in downtrends indicate strengthening bearish momentum, while red columns in uptrends indicate weakening bullish momentum
Acceleration Column Height: The height of each column represents the magnitude of acceleration, with taller columns indicating stronger acceleration or deceleration forces
Bar Coloring: Optional price bar coloring matches velocity direction for immediate visual trend confirmation
Info Table: Real-time display of current velocity and acceleration values with trend arrows and change indicators
3. Additional Features:
Confirmed vs Live Data: Toggle between confirmed (closed) bar analysis for stable signals or current bar inclusion for real-time updates
Multi-timeframe Adaptability: Velocity normalization ensures consistent readings across different chart timeframes and asset volatilities
Alert System: Built-in alerts for threshold crossovers and direction changes
🟢 Examples with Preconfigured Settings
Default : Balanced configuration suitable for most timeframes and general trading applications, providing optimal balance between sensitivity and noise filtering for medium-term analysis.
Scalping : High sensitivity setup with shorter lookback period and reduced smoothing for ultra-short-term trades on 1-15 minute charts, optimized for capturing rapid momentum shifts and frequent trading opportunities.
Swing Trading : Extended lookback period with enhanced smoothing and higher threshold for multi-day positions, designed to filter market noise while capturing significant momentum moves on 1-4 hour and daily timeframes.

DAX Inducere Simplă v1.3 – Confirmare InducereDAX Inducere Simplă v1.3 – Confirmare Inducere ,signals before fvg mss and displacement

Gold Power Hours Strategy📈 Gold Power Hours Trading Strategy
Trade XAUUSD (Gold) or XAUEUR during the most volatile hours of the New York session, using momentum and trend confirmation, with session-specific risk/reward profiles.
✅ Strategy Rules
🕒 Valid Trading Times ("Power Hours"):
Trades are only taken during high-probability time windows on Tuesdays, Wednesdays, and Thursdays , corresponding to key New York session activity:
Morning Session:
08:00 – 11:00 (NY time)
Afternoon Session:
12:30 – 16:00
19:00 – 22:00
These times align with institutional activity and economic news releases.
📊 Technical Indicators Used:
50-period Simple Moving Average (SMA50):
Identifies the dominant market trend.
14-period Relative Strength Index (RSI):
Measures market momentum with session-adjusted thresholds.
🟩 Buy Signal Criteria:
Price is above the 50-period SMA (bullish trend)
RSI is greater than:
60 during Morning Session
55 during Afternoon Session
Must be during a valid day (Tue–Thu) and Power Hour session
🟥 Sell Signal Criteria:
Price is below the 50-period SMA (bearish trend)
RSI is less than:
40 during Morning Session
45 during Afternoon Session
Must be during a valid day and Power Hour session
🎯 Trade Management Rules:
Morning Session (08:00–11:00)
Stop Loss (SL): 50 pips
Take Profit (TP): 150 pips
Risk–Reward Ratio: 1:3
Afternoon Session (12:30–16:00 & 19:00–22:00)
Stop Loss (SL): 50 pips
Take Profit (TP): up to 100 pips
Risk–Reward Ratio: up to 1:2
⚠️ TP is slightly reduced in the afternoon due to typically lower volatility compared to the morning session.
📺 Visuals & Alerts:
Buy signals: Green triangle plotted below the bar
Sell signals: Red triangle plotted above the bar
SMA50 line: Orange
Valid session background: Light pink
Alerts: Automatic alerts for buy/sell signals

RSI Multi-Timeframe Dashboard by giua64)### Summary
This is an advanced dashboard that provides a comprehensive overview of market strength and momentum, based on the Relative Strength Index (RSI) analyzed across 6 different timeframes simultaneously (from 5 minutes to the daily chart).
The purpose of this script is to offer traders an immediate and easy-to-read summary of market conditions, helping to identify the prevailing trend direction, overbought/oversold levels, and potential reversals through divergence detection. All of this is available in a single panel, eliminating the need to switch timeframes on your main chart.
### Key Features
* **Multi-Timeframe Analysis:** Simultaneously monitors the 5m, 15m, 30m, 1H, 4H, and Daily timeframes.
* **Scoring System:** Each timeframe is assigned a score based on multiple RSI conditions (e.g., above/below 50, overbought/oversold status, direction) to quantify bullish or bearish strength.
* **Aggregated Signal:** The dashboard calculates a total percentage score and provides a clear summary signal: **LONG**, **SHORT**, or **WAIT**.
* **Divergence Detection:** Automatically identifies Bullish and Bearish divergences between price and RSI for each timeframe.
* **Non-Repainting Option:** In the settings, you can choose to base calculations on the close of the previous candle (`Use RSI on Closed Candle`). This ensures that past signals (like status and score) do not change, providing more reliable data for analysis.
* **Fully Customizable:** Users can modify the RSI period, overbought/oversold thresholds, divergence detection settings, and the appearance of the table.
### How to Read the Dashboard
The table consists of 6 columns, each providing specific information:
* **% (Total Score):**
* **Header:** Shows the overall strength as a percentage. A positive value indicates bullish momentum, while a negative value indicates bearish momentum. The background color changes based on intensity.
* **Rows:** Displays the numerical score for the individual timeframe.
* **RSI:**
* **Header:** The background color indicates the average of all RSI values. Green if the average is > 50, Red if < 50.
* **Rows:** Shows the real-time RSI value for that timeframe.
* **Signal (Status):**
* **Header:** This is the final operational signal. It turns **🟢 LONG** when bullish strength is high, **🔴 SHORT** when bearish strength is high, and **⚪ WAIT** in neutral conditions.
* **Rows:** Describes the RSI status for that timeframe (e.g., Bullish, Bearish, Overbought, Oversold).
* **Dir (Direction):**
* **Header:** Displays an arrow representing the majority direction across all timeframes.
* **Rows:** Shows the instantaneous direction of the RSI (↗️ for rising, ↘️ for falling).
* **Diverg (Divergence):**
* Indicates if a bullish (`🟢 Bull`) or bearish (`🔴 Bear`) divergence has been detected on that timeframe.
* **TF (Timeframe):**
* Indicates the reference timeframe for that row.
### Advantages and Practical Use
This tool was created to solve a common problem: the need to analyze multiple charts to understand the bigger picture. With this dashboard, you can:
1. **Confirm a Trend:** A predominance of green and a "LONG" signal provides strong confirmation of bullish sentiment.
2. **Identify Weakness:** Red signals on higher timeframes can warn of an impending loss of momentum.
3. **Spot Turning Points:** A divergence on a major timeframe can signal an excellent reversal opportunity.
### Originality and Acknowledgements
This script is an original work, written from scratch by giua64. The idea was to create a comprehensive and visually intuitive tool for RSI analysis.
Any feedback, comments, or suggestions to improve the script are welcome!
**Disclaimer:** This is a technical analysis tool and should not be considered financial advice. Always do your own research and backtest any tool before using it in a live trading environment.
Script open-source
In pieno spirito TradingView, il creatore di questo script lo ha reso open-source, in modo che i trader possano esaminarlo e verificarne la funzionalità. Complimenti all'autore! Sebbene sia possibile utilizzarlo gratuitamente, ricorda che la ripubblicazione del codice è soggetta al nostro Regolamento.
giua64
borsamercati.it – Educational tools by giua64
Anche su:
Declinazione di responsabilità
Le informazioni ed i contenuti pubblicati non costituiscono in alcun modo una sollecitazione ad investire o ad operare nei mercati finanziari. Non sono inoltre fornite o supportate da TradingView. Maggiori dettagli nelle Condizioni d'uso.

Gold DynamicThis is a custom-made TradingView indicator designed to visualize "sequential price levels" based on a user-defined step value, dynamically centered around the current gold price. It draws horizontal lines at multiples of a chosen step value (e.g., 7) both above and below the current price.
Key Features:
Dynamic Price Levels: Lines are calculated relative to the live price, providing relevant support/resistance or structural levels for the current market context.
Customizable Step Value: Easily adjust the Sequence Step Value (e.g., 7, 10, 14) from the indicator settings to align with your trading theory.
Adjustable Line Count: Control the Number of Lines ABOVE Current Price and Number of Lines BELOW Current Price to show as many or as few levels as desired.
Extended Lines: Horizontal lines extend indefinitely to both the left (historical data) and right (future projection) for comprehensive visualization.
Clear Price Labels: Each line displays its exact price value, positioned at the far right of the chart for quick reference.
Customizable Appearance: Modify line color, width, and style (solid, dotted, dashed) to suit your charting preferences.
Exact Values: All displayed price labels are rounded to whole numbers for clear, precise visualization without decimal values.
This indicator is ideal for traders looking to apply a fixed-step price theory to their gold analysis.

CHN BUY SELL with EMA 200Overview
This indicator combines RSI 7 momentum signals with EMA 200 trend filtering to generate high-probability BUY and SELL entry points. It uses colored candles to highlight key market conditions and displays clear trading signals with built-in cooldown periods to prevent signal spam.
Key Features
Colored Candles: Visual momentum indicators based on RSI 7 levels
Trend Filtering: EMA 200 confirms overall market direction
Signal Cooldown: Prevents over-trading with adjustable waiting periods
Clean Interface: Simple BUY/SELL labels without clutter
How It Works
Candle Coloring System
Yellow Candles: Appear when RSI 7 ≥ 70 (overbought momentum)
Purple Candles: Appear when RSI 7 ≤ 30 (oversold momentum)
Normal Candles: All other market conditions
Trading Signals
BUY Signal: Triggered when closing price > EMA 200 AND yellow candle appears
SELL Signal: Triggered when closing price < EMA 200 AND purple candle appears
Signal Cooldown
After a BUY or SELL signal appears, the same signal type is suppressed for a specified number of candles (default: 5) to prevent excessive signals in ranging markets.
Settings
RSI 7 Length: Period for RSI calculation (default: 7)
RSI 7 Overbought: Threshold for yellow candles (default: 70)
RSI 7 Oversold: Threshold for purple candles (default: 30)
EMA Length: Period for trend filter (default: 200)
Signal Cooldown: Candles to wait between same signal type (default: 5)
How to Use
Apply the indicator to your chart
Look for yellow or purple colored candles
For LONG entries: Wait for yellow candle above EMA 200, then enter BUY when signal appears
For SHORT entries: Wait for purple candle below EMA 200, then enter SELL when signal appears
Use appropriate risk management and position sizing
Best Practices
Works best on timeframes M15 and higher
Suitable for Forex, Gold, Crypto, and Stock markets
Consider market volatility when setting stop-loss and take-profit levels
Use in conjunction with proper risk management strategies
Technical Details
Overlay: True (plots directly on price chart)
Calculation: Based on RSI momentum and EMA trend analysis
Signal Logic: Combines momentum exhaustion with trend direction
Visual Feedback: Colored candles provide immediate market condition awareness

Adaptive Multi-TF Indicator Table with Presets giua64📌 Script Name:
Adaptive Multi-Timeframe Indicator Table with Presets — giua64
📄 Description:
This script displays an adaptive multi-timeframe dashboard that summarizes the signals of three key technical indicators:
Moving Averages (MAs), Relative Strength Index (RSI), and MACD.
It provides a fast and visually intuitive overview of market conditions across five timeframes (5m, 15m, 30m, 1h, 4h), helping traders quickly identify potential directional biases (e.g., bullish, bearish, or neutral) based on either predefined presets or fully manual settings.
🧰 Preset Configurations:
You can choose between four trading styles, each with optimized indicator parameters:
Scalping
• MAs: 5 / 10 (Fast), 20 / 50 (Slow)
• RSI: 7 periods | Overbought: 70 | Oversold: 30
• MACD: 5 / 13 | Signal: 3
Intraday
• MAs: 9 / 21 (Fast), 50 / 100 (Slow)
• RSI: 14 periods | Overbought: 60 | Oversold: 40
• MACD: 12 / 26 | Signal: 9
Swing
• MAs: 10 / 20 (Fast), 50 / 200 (Slow)
• RSI: 14 periods | Overbought: 65 | Oversold: 35
• MACD: 12 / 26 | Signal: 9
Manual
• Full custom control over all indicator settings.
🛠️ All settings can be customized manually from the options panel, including the exact MA periods, RSI thresholds, and MACD structure.
🧠 How It Works:
For each timeframe, the script evaluates:
MA crossover status (two levels):
The first symbol refers to the crossover of the fast MAs
The second symbol refers to the crossover of the slow MAs
🟢 = Bullish crossover
🔴 = Bearish crossover
➖ = Flat or no clear signal
RSI Direction:
↑ = RSI above upper threshold (potential overbought)
↓ = RSI below lower threshold (potential oversold)
→ = RSI in neutral range
MACD Line vs Signal Line:
↑ = MACD line is above signal line (bullish)
↓ = MACD line is below signal line (bearish)
→ = Flat or neutral signal
Each signal is assigned a numerical score. These are aggregated per timeframe to compute a combined score that reflects the directional bias for that specific time window.
🧠 Adaptive Logic by Asset:
This script is designed to be universally compatible across all asset types — including forex, crypto, stocks, indices, and commodities.
Thanks to its multi-timeframe nature and flexible indicator presets, the script automatically adjusts its behavior based on the asset selected, ensuring relevant analysis without requiring manual recalibration.
🧾 Summary Table Output:
At the bottom of the dashboard, a combined sentiment is displayed for:
3TF → 5m, 15m, 30m
4TF → Adds 1h
5TF → Adds 4h
Each row shows:
Signal → LONG / SHORT / NEUTRAL
Confidence (%) → Based on score aggregation and signal consistency
📌 Customization Options:
Table Position: Left, Right, or Center
Text Size: Small, Normal, or Large
Full Manual Configuration: All MA, RSI, and MACD parameters can be adjusted as needed
⚠️ Disclaimer:
This script is for educational and analytical purposes only.
It does not constitute financial advice or guarantee any trading results.
Always do your own research and apply responsible risk management.

CANX Gold (XAUUSD) $5 Psychological Levels© CanxStixTrader
FOR GOLD ONLY
--------------------------------
This is a vary simple yet powerful indicator based on the psychological levels that retail traders use to trade gold and institutions in turn target these levels.
--------------------------------
HOW TO USE
Once the trend has been determined then this simple indicator can be used to target the pull backs for the sniper entries you want.
-TIP, pair with other indicators for optimal entries and trend identification. We recommend the 1 minute time frame for entries and a momentum indicator for extra confirmation.
--------------------------------
The indicator draws lines every 50 pips or $5 on the chart and is customizable to your preference.
Like always, Keep it simple!
© CanxStixTrader

Gold/Silver RatioOverview
This indicator displays the Gold/Silver Ratio by dividing the price of gold (XAUUSD) by the price of silver (XAGUSD) on the same timeframe. It is a widely used tool in macroeconomic and precious metals analysis, helping traders and investors evaluate the relative value of gold compared to silver.
📈 What it does
Plots the ratio between gold and silver prices as a line on the chart.
Displays two key horizontal levels:
Overbought level at 90 (dashed red line).
Oversold level at 70 (dashed green line).
Highlights the chart background to show extreme conditions:
Red shading when the ratio exceeds 90 (gold is likely overvalued relative to silver).
Green shading when the ratio drops below 70 (silver is likely overvalued relative to gold).
🧠 How to Use
When the ratio exceeds 90, it suggests that gold may be overbought or silver may be undervalued. Historically, these have been good times to consider shifting exposure from gold to silver.
When the ratio falls below 70, it may indicate silver is overbought or gold is undervalued.
This tool is best used in conjunction with technical analysis, macroeconomic trends, or RSI/Bollinger Bands applied to the ratio.
⚙️ Inputs
This version of the script uses OANDA's XAUUSD and XAGUSD pairs for spot gold and silver prices. You may edit the request.security() calls to change data sources (e.g., FXCM, FOREXCOM, or CFD tickers from your broker).
✅ Best For:
Macro traders
Commodity investors
Ratio and spread traders
Long-term portfolio reallocators

PRO SMC Full Suite BY Mashrur“PRO SMC Full Suite BY Mashrur”
A Pine Script (v5) indicator for TradingView, focused on Smart Money Concepts (SMC). It overlays on price charts and provides visual tools for identifying key institutional trading behaviors.
🎯 Purpose
This script is designed to help traders analyze and trade using SMC principles by automatically detecting:
Order Blocks (OBs)
Fair Value Gaps (FVGs)
Breaks of Structure (BoS)
Liquidity Sweeps (Buy/Sell Side Liquidity Grabs)
Mitigation Entries
⚙️ Inputs / Settings
Show Fair Value Gaps: Toggle FVGs on/off
Higher Timeframe (HTF): Choose HTF for OB analysis
Use HTF OBs: Switch between current TF OBs and HTF OBs
Show Order Blocks: Toggle OBs on/off
Show OB Mitigation Entries: Toggle mitigation entry signals on/off
🧠 Core Logic Overview
🔹 1. Swing Points Detection
Identifies swing highs/lows using a 3-bar pattern (pivot-based structure).
🔹 2. Break of Structure (BoS)
A bullish BoS happens when price closes above the last swing high.
A bearish BoS occurs when price closes below the last swing low.
🔹 3. Order Block Detection
Upon BoS, the script marks the previous candle as the Order Block.
Uses either:
Current TF OBs (based on price action)
HTF OBs (based on candle body direction)
🔹 4. Mitigation Entry Logic
A mitigation occurs when price returns to the OB and reacts with confirmation:
Bullish: price dips into OB and closes above
Bearish: price wicks into OB and closes below
Plots entry markers for these mitigations.
🔹 5. Liquidity Sweeps
Detects equal highs/lows (liquidity zones)
Marks Buy SL when price dips below an equal low then closes above
Marks Sell SL when price breaks above an equal high then closes below
🔹 6. Fair Value Gaps (FVGs)
FVG Up: Gap between candle 3 and candle 1 (low > high )
FVG Down: Gap between candle 3 and candle 1 (high < low )
Plots highlighted boxes on these gaps
📊 Visual Elements
Boxes: For OB zones and FVGs
Shapes:
Labels: OB Buy/Sell entries
Triangles: Buy SL / Sell SL liquidity sweeps
Lines: Equal Highs and Lows
🔔 Alerts
Built-in alerts to notify when:
OB entries are confirmed
Liquidity sweeps happen
Helps in automation or active monitoring
✅ Ideal For
Traders using SMC, ICT concepts, Wyckoff, or institutional trading models
Anyone wanting to automate detection of structural elements on their chart

RiskCalc FX & GoldRiskCalc FX & Gold is a multi-market position sizing tool designed to help you manage risk quickly and accurately. With this script, simply enter your account capital, the percentage of risk you wish to take, and your stop in ticks. Depending on the selected market—Forex or XAUUSD—the script automatically adjusts its calculations:
Forex: Assumes 1 lot equals 100,000 units.
XAUUSD: Assumes 1 lot equals 100 ounces.
The script calculates your risk in dollars and, using a fixed value of 1 USD per tick per lot, determines the ideal position size in both lots and total contracts. Results are displayed in a clear, centralized table at the top of the chart for real-time decision-making.
Perfect for traders operating across multiple markets who need an automated and consistent approach to risk management.

Fractal levels Gold [AstroHub]This indicator detects key fractal points on a price chart and visually marks them with shapes and levels. It helps traders identify potential reversal zones and dynamic support/resistance levels, enhancing market analysis.
Key Features:
Fractal Detection:
The indicator identifies top and bottom fractals using a 5-bar pattern.
A top fractal forms when the middle bar has a higher high compared to the two bars on either side.
A bottom fractal forms when the middle bar has a lower low compared to the two bars on either side.
Fractal Filtering:
The indicator can filter out "pristine" fractals (uninterrupted fractal patterns) based on custom conditions, making it more selective and reducing false signals.
Fractal Plotting:
are plotted as downward triangles.
are plotted as upward triangles.
Users can choose to display or hide fractal points and their corresponding labels.
Fractal Levels:
The indicator automatically plots fractals' levels on the chart, marking potential resistance and support zones.
Fractal levels change dynamically as new fractals are identified.
Customizable Display Options:
Show or hide fractals and levels with adjustable settings.
Choose whether to apply filtering for pristine fractals.
Display the pivot labels to easily track fractal positions.
How It Works:
The indicator uses a simple approach to recognize top and bottom fractals . When a valid fractal is detected, it highlights it on the chart and plots the corresponding price level.
By default, top fractals are shown above the bars (red color), and bottom fractals are shown below the bars (green color).
Fractal levels represent potential reversal points and can act as dynamic support and resistance zones.
Best Use:
The indicator is particularly useful in identifying reversal points and trend changes, helping traders to spot key price levels.
It can be used across various timeframes and markets, particularly for trend-following or reversal strategies.
Customizable Settings:
Show Pivots: Toggle the display of pivot points.
Show Pivot Labels: Display labels for pivot levels.
Show Fractals: Toggle fractal points on the chart.
Show Fractal Levels: Show or hide the levels corresponding to the detected fractals.
Filter for Pristine Fractals: Enable this option to filter out non-pristine fractals for higher accuracy.
Conclusion:
This indicator provides clear, actionable fractal signals, helping traders easily identify critical levels for entry and exit. With customizable settings and visual cues, it's suitable for both novice and expe

Marcel's Dynamic Profit / Loss Calculator for GoldOverview
This Dynamic Risk / Reward Tool for Gold is designed to help traders efficiently plan and manage their trades in the volatile gold market. This script provides a clear visualisation of trade levels (Entry, Stop Loss, Take Profit) while dynamically calculating potential profit and loss. It ensures gold traders can assess their positions with precision, saving time and improving risk management.
Key Features
1. Trade Level Visualisation:
Plots Entry (Blue), Stop Loss (Red), and Take Profit (Green) lines directly on the chart.
Helps you visualise and confirm trade setups quickly which is good for scalping and day trades.
2. Dynamic Risk and Reward Calculations:
Calculates potential profit and loss in real time based on user-defined inputs such as position size, leverage, and account equity.
Displays a summary panel showing risk/reward metrics directly on the chart.
3. Customisable Settings:
Allows you to adjust key parameters like account equity, position size, leverage, and specific price levels for Entry, Stop Loss, and Take Profit.
Defaults are dynamically generated for convenience but remain fully adjustable for flexibility.
How It Works
The script uses gold-specific conventions (e.g., 1 lot = 100 ounces, 1 pip = 0.01 price change) to calculate accurate risk and reward metrics.
It dynamically positions Stop Loss and Take Profit levels relative to the entry price, based on user-defined or default offsets.
A real-time summary panel is displayed in the bottom-right corner of the chart, showing:
Potential Profit: The monetary value if the Take Profit is hit.
Potential Lo
ss: The monetary value if the Stop Loss is hit.
How to Use It
1. Add the script to your chart on a gold trading pair (e.g., XAUUSD).
2. Input your:
Account equity.
Leverage.
Position size (in lots).
Desired En
try Price (default: current close price).
3. Adjust the Stop Loss and Take Profit levels to your strategy, or let the script use default offsets of:
500 pips below the Entry for Stop Loss.
1000 pips above the Entry for Take Profit.
4. Review the plotted levels and the summary panel to confirm your trade aligns with your risk/reward goals.
Why Use This Tool?
Clarity and Precision:
Provides clear trade visuals and financial metrics for confident decision-making.
Time-Saving:
Automates the calculations needed to evaluate trade risk and reward.
Improved Risk Management:
Ensures you never trade without knowing your exact potential loss and gain.
This script is particularly useful for both novice and experienced traders looking to enhance their risk management and trading discipline in the Gold market. Enjoy clearer trades at speed.

XAUUSD Weekly Gap Indicator (oberlunar)The XAUUSD Weekly Gap Indicator is a technical tool designed specifically for tracking weekly price gaps in the XAUUSD (gold) market. It identifies and visualizes the price difference between the Friday close and the Monday open, providing valuable insights into market dynamics over the weekend.
Gap Detection:
Measures the price difference between Friday's closing price and Monday's opening price.
Highlights whether the gap is bullish (Monday opens above Friday’s close) or bearish (Monday opens below Friday’s close).
Visualization:
Draws a line or rectangle to connect the Friday close and the Monday open, clearly marking the gap on the chart.
Displays an indicator label with the gap value, often in pips or points, to quantify the gap size.
Color Coding:
Green: Bullish gap (positive price movement).
Red: Bearish gap (negative price movement).
Market Sentiment:
Large gaps can indicate significant market sentiment shifts due to weekend events, such as economic reports or geopolitical news.
Support and Resistance:
Weekly gaps often act as temporary support or resistance levels, as the market may attempt to revisit or "fill" the gap.
Trading Strategies:
Gap Filling: XAUUSD often tends to "fill" these gaps, providing trading opportunities.
Continuation or Reversal: The reaction to the gap can signal whether the trend is likely to continue or reverse.
