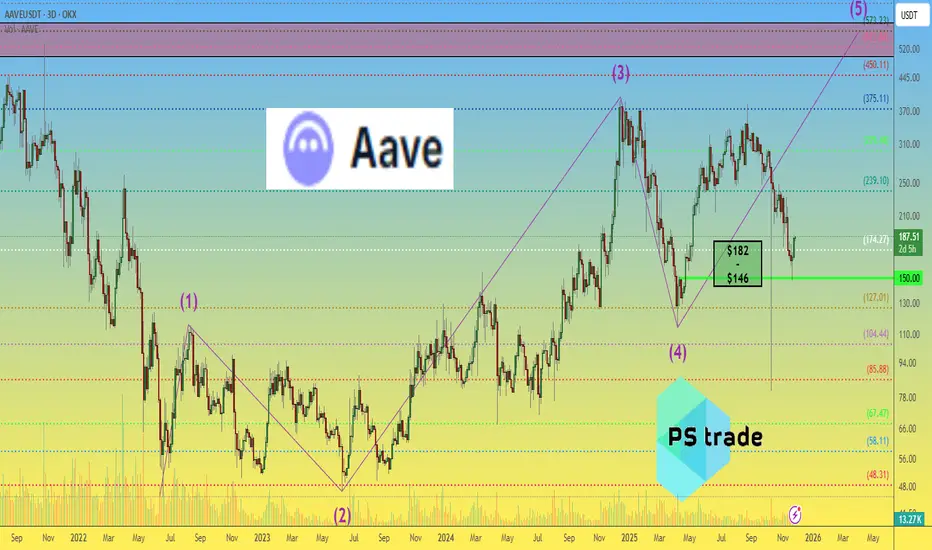
AAVE price analysisAfter nearly 5–6 months of waiting, CRYPTOCAP:AAVE has reached the $146 target, followed by a constructive rebound. The brief volatility spike on October 10–11 doesn’t change the broader structure.
From a fundamental perspective, CRYPTOCAP:AAVE remains one of the more robust DeFi assets. Price stability is notable considering the complete absence of ETF-related hype — which means any future catalyst could amplify the move.
If market conditions improve, OKX:AAVEUSDT has a reasonable probability of retesting the $500–600 ATH zone.
What’s your view: is CRYPTOCAP:AAVE preparing for a mid-term trend expansion or is the asset likely to stay in accumulation?
______________
◆ Follow us ❤️ for daily crypto insights & updates!
🚀 Don’t miss out on important market moves
🧠 DYOR | This is not financial advice, just thinking out loud
Trade ideas
AVEE. USDTWithout a doubt, one of the best cryptocurrencies is AAVE.
With 16 million tokens, all of which have already been issued to the market.
While most cryptocurrencies either have billions of tokens or an infinite supply, Ripple has 100 billion, Dogecoin has an infinite supply, and...
Even Bitcoin has 21 million tokens. (Although not all of them have been mined.)
Of course, there are many high-potential cryptocurrencies like AAVE, such as Avax, Uni, Link...
Therefore, a successful investment is investing in high-potential cryptocurrencies.
Note:
When and at what price should you buy AAVE, and when exite the market?
However, AAVE is currently adjusting its price.
I'm considering a price range of $120 to $140.
What do you think?

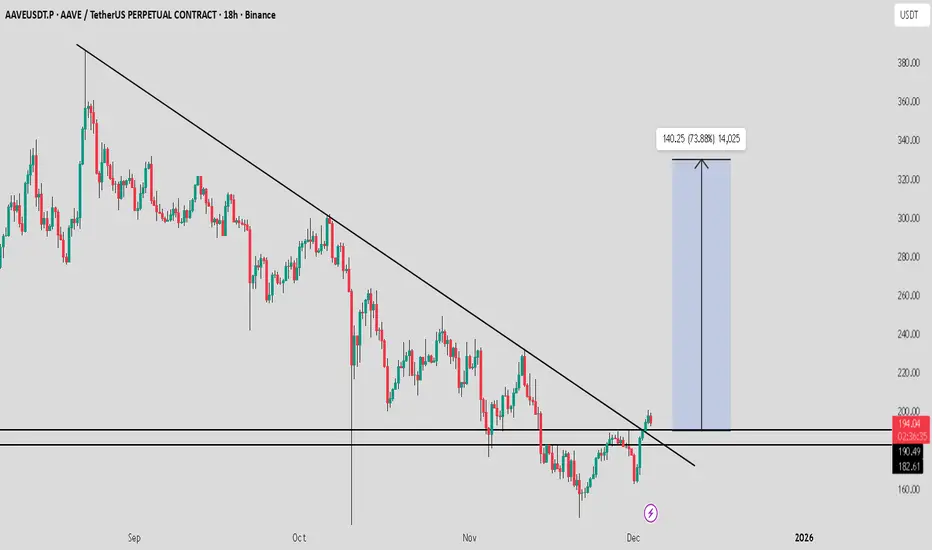
AAVE Holding Strong — Watching for Breakout Reaction Toward $250AAVE / USDT is holding strong above the marked horizontal levels. If price reacts with clear strength from this zone, it could offer a solid opportunity for a move towards $250–$320. Wait for clean confirmation before entering and manage risk wisely.
AAVE Update🚨📊 AAVE Update
AAVE has formed a double bottom pattern,
which is normally a strong bullish reversal signal —
but we still have a red resistance zone 🔴
sitting right above the price.
This red zone is acting as a strong ceiling,
and price must break above it
for the double bottom to fully confirm and momentum to continue higher.
Until that breakout happens,
upside stays limited and sellers remain active at this zone.

AAVEUSDT
"From my perspective, AAVE has a chance to return to daily support (blue box). That is just my forecast; the market is dynamic, of course."

AAVE USDT LONG SIGNAL📢 Official Trade Signal – AAVE/USDT
📈 Position Type: LONG
💰 Entry Price: 178.89
---
🎯 Take-Profit Targets (Tiered Exits):
• TP1: 183.90
• TP2: 188.75
• TP3: 194.53
• TP4: 199.73
• TP5: 205.80
• TP6: —
---
🛑 Stop-Loss: 173.00
📊 Timeframe: 15m
⚖️ Risk/Reward Ratio: 4.73
💥 Suggested Leverage: 5× – 10×
---
🧠 Technical Analysis Summary
AAVE is showing strong bullish continuation from the 177–179 demand zone, with higher-low structure confirming upward momentum on the 15m timeframe.
Order-flow and intraday momentum both align with a push toward upper resistance clusters:
183.90 → 188.75 → 194.53 → 199.73 → 205.80
A clean break above TP1 increases the probability of reaching extended targets.
---
⚙️ Trade Management Guidelines
✔ Take partial profits at TP1
✔ Move SL to Break-Even after TP1 hits
✔ Trail your SL as price moves toward higher targets
✔ Do NOT re-enter if SL is hit
✔ Confirm price structure before entering the trade
---
📌 TradingView Hashtags
#AAVEUSDT #AAVE #CryptoSignal #LongSetup
#TradingView #FuturesTrading #Altcoins #TechnicalAnalysis
---

AAVE USDT LONG SIGNAL---
📢 Official Trade Signal – AAVE/USDT
📈 Position Type: LONG
💰 Entry Price: 183.25
---
🎯 Take-Profit Targets (Partial Exits):
TP1 = 190.95
TP2 = 202.39
TP3 = 214.00
TP4 = 225.00
TP5 = —
TP6 = —
---
🛑 Stop-Loss: 175.15
📊 Timeframe: 15m
⚖️ Risk/Reward Ratio: 5.32
💥 Suggested Leverage: 5× – 10×
---
🧠 Technical Analysis Summary
AAVE is showing strong bullish continuation after defending the 182–184 demand zone, forming a clean higher-low structure on lower timeframes.
Momentum indicators are turning upward, and price is attempting to reclaim short-term liquidity pockets.
Key upside liquidity pools align with the take-profit levels at 190.95, 202.39, 214, and 225.
A confirmed breakout above TP1 could trigger accelerated momentum toward the mid-range resistance zones.
---
⚙️ Trade Management Rules
✔️ Secure partial profits at TP1
✔️ Move SL to Break-Even after TP1 hits
✔️ Trail SL as price approaches higher targets
✔️ No re-entry if SL is hit
✔️ Always confirm trend structure before entering
---
⚠️ Risk-Management Note
Reaching TP1 → SL moves to BE (zero-risk position).
If price later returns and closes at BE, it is not a loss — it is optimal capital protection.
Capital preservation always comes first.
---
📌 TradingView Hashtags
#AAVEUSDT #AAVE #CryptoSignal #LongSetup
#TradingView #TechnicalAnalysis #FuturesTrading #Altcoins
---

AAVE USDT SHORT SIGNAL---
📢 Official Trade Signal – AAVE/USDT
📉 Position Type: SHORT
💰 Entry Price: 176.48
---
🎯 Take-Profit Targets (Partial Exits):
TP1 = 171.35
TP2 = 166.41
TP3 = 160.45
TP4 = —
TP5 = —
TP6 = —
---
🛑 Stop-Loss: 181.30
📊 Timeframe: 15m
⚖️ Risk/Reward Ratio: 3.65
💥 Suggested Leverage: 5× – 10×
---
🧠 Technical Analysis Summary
AAVE is showing clear bearish rejection from the 177–178 supply zone, with strong downside momentum forming on the 15m chart.
Price has swept local liquidity and is now forming a lower-high structure — a typical continuation signal for short setups.
Downside liquidity levels align precisely with our TP targets:
171.35 → 166.41 → 160.45
A confirmed break below 171.35 (TP1) opens the path toward deeper sell-side liquidity zones.
---
⚙️ Trade Management Rules
✔️ Take partial profit at TP1
✔️ Move SL to Break-Even immediately after TP1 hits
✔️ Trail SL as price approaches lower targets
✔️ Avoid forced re-entries if SL is hit
✔️ Confirm bearish structure before entering
---
⚠️ Risk-Management Note
Once TP1 is hit → move SL to Break-Even.
If the market reverses and stops you at BE afterward, the trade remains risk-free.
Protecting capital always comes first.
---
📌 TradingView Hashtags
#AAVEUSDT #AAVE #CryptoSignal #ShortSetup
#TradingView #FuturesTrading #Altcoins #TechnicalAnalysis
-

AAVE Retracement Long Entry ZoneStructure broken. Looking for a Fibo retracement to enter Long. Target Levels are supply POI on the chart.

AAVE USDT SHORT SIGNAL📢 Official Trade Signal – AAVE/USDT
📉 Position Type: SHORT
💰 Entry Price: 163.47
---
🎯 Take-Profit Targets (Partial Exits):
TP1 = 161.08
TP2 = 158.17
TP3 = 155.16
TP4 = 152.82
TP5 = —
---
🛑 Stop-Loss: 166.00
📊 Timeframe: 15m
⚖️ Risk/Reward Ratio: 4.30
💥 Suggested Leverage: 5× – 10×
---
🧠 Technical Context
AAVE is showing weakness near the 163–166 supply zone, with clear bearish reaction and momentum fading.
Downside liquidity levels align with the TP zones, making this a high-probability corrective short setup.
---
⚙️ Trade Management Rules
✔️ Take partial profit at TP1
✔️ Move SL to Break-Even once TP1 is hit
✔️ Trail SL as price approaches each next target
✔️ Do not re-enter if SL at 166 is hit
✔️ Confirm short-term market structure before entering
---
⚠️ Risk-Management Note
Moving SL to Break-Even after TP1 is hit is standard professional risk protection.
If price reverses and stops you out at BE, this is not a losing trade — capital remains safe.
---
📌 TradingView Hashtags
#AAVEUSDT #AAVE #CryptoSignal #ShortSetup #TechnicalAnalysis
#TradingView #FuturesTrading #Altcoins

AAVE USDT SHORT SIGNAL---
📢 Official Trade Signal – AAVE/USDT
📉 Position Type: SHORT
💰 Entry Price: 157.70
---
🎯 Take-Profit Targets (Partial Exits)
TP1 = 154.78
TP2 = 151.49
TP3 = 148.46
TP4 = 144.97
TP5 = 141.09
TP6 = 136.21
---
🛑 Stop-Loss: 160.93
📊 Timeframe: —
⚖️ Risk/Reward Ratio: 6.78
💥 Suggested Leverage: 5× – 10×
---
🧠 Technical Analysis Summary
AAVE has reached a strong supply zone around 157–160, where sellers previously showed significant control.
Multiple bearish rejections and weakening momentum indicate a potential downside move.
The short setup aligns with a breakdown of minor support levels and a shift in market structure on lower timeframes.
Targets are placed at key liquidity pools and untested demand zones.
Price shows exhaustion signs with bearish divergence forming, supporting continuation to the downside.
---
⚙️ Trade Management Rules
Take partial profit at TP1
Move Stop-Loss to Break-Even once TP1 is hit
Trail SL progressively as price approaches TP2–TP6
Avoid re-entry if price hits SL at 160.93
---
⚠️ Important Risk-Management Note
✔️ After TP1 is reached, move SL to the Entry Price.
This is standard professional risk management.
❗ If price hits TP1 then reverses and stops out at break-even — this is NOT a losing trade.
It simply means the trade closed with zero risk.
🔐 Protecting capital always comes before chasing big profits.
---
📌 TradingView Hashtags
#AAVEUSDT #AAVE #CryptoSignal #ShortSetup #TechnicalAnalysis #TradingView #FuturesTrading #Altcoins
--

clean higher-low structure after completing a deep corrective waPrice is now consolidating right below a key breakout zone, showing strength with a series of bullish candles and stable volume. If this consolidation holds, a continuation toward the next major resistance becomes highly probable. The stop-loss is placed below the recent demand zone to protect against a failed breakout. The setup targets a trend-extension move aligned with the broader bullish recovery structure.
AAVE USDT LONG SIGNAL---
📢 Trade Signal – AAVE/USDT
📈 Position Type: Long
💰 Entry Price: 171.93
---
🎯 Take-Profit Targets (Partial Exits)
TP1 = 177.40
TP2 = 182.23
TP3 = 190.42
TP4 = 196.57
TP5 = —
TP6 = —
---
🛑 Stop-Loss: 163.80
📊 Timeframe: —
⚖️ Risk/Reward Ratio: 3.11
💥 Suggested Leverage: 5× – 10×
---
🧠 Technical Analysis Summary
AAVE is bouncing from a strong demand zone in the 169–172 USD area, where previous liquidity sweeps occurred.
Market structure is shifting bullish, and price has reclaimed the intraday support above 171.50.
Momentum indicators show early strength, suggesting continuation toward the resistance cluster around 177–182.
A clean breakout above 182.23 opens the way toward 190+, aligning with the upper range and supply block.
---
⚙️ Trade Management
✔️ Take partial profit at TP1
✔️ Move SL → Break Even after TP1 hits
✔️ Trail stop gradually if price moves toward TP2–TP3
✔️ Avoid re-entry if price breaks and closes below 163.80
---
⚠️ Disclaimer
This signal is for educational purposes only.
Always manage risk properly and trade responsibly.
---
📌 Hashtags for TradingView
#AAVEUSDT #AAVE #CryptoSignal #TradingView #Futures #Altcoins #TechnicalAnalysis
---

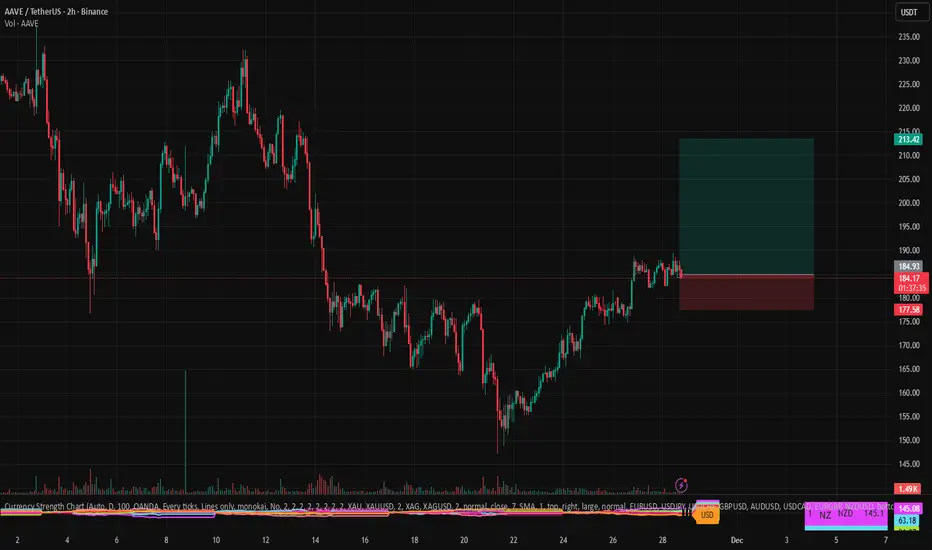
$AAVE Long🟢 Entry : 204$ - 200$
🎯 Targets :
1) 210$
2) 215$
3) 220$
4) 230$+
🔴 Stop : 193$
📌 Do proper money management... DYOR
Buy : CRYPTOCAP:AAVE

AAVE USDT SHORT SIGNAL: AAVE/USDT
Type: Short
Entry Zone: 209.22 – 214.60
🎯 Take-Profit Targets:
• TP1 = 203.43
• TP2 = 198.44
• TP3 = 192.25
• TP4 = 186.20
🛑 Stop-Loss: 220.40
⏱ Timeframe: 1H
⚖️ Risk/Reward Ratio: 2.12
💥 Suggested Leverage (if used): 5x–10x
---
Technical Analysis:
AAVE is showing a clear bearish rejection from the major resistance zone around 214–216, forming a lower high structure and confirming a potential short setup.
Price is currently trading below EMA50, with RSI turning down from the midline, suggesting momentum is shifting in favor of sellers.
If price fails to reclaim 215, continuation toward 198–192 levels is expected.
A break below 203 will likely accelerate downside pressure toward 186 in the coming sessions.
---
Trade Management Tips:
• Consider partial profit-taking at each target zone.
• Move SL to entry once TP1 is reached.
• If price closes above 220 on the 1H timeframe, invalidate the setup.
---
⚠️ Disclaimer:
This analysis is for educational purposes only and not financial advice.
Always conduct your own research and apply proper risk management before entering any trade.
---

AAVEUSDT 12H#AAVE is currently trading within a Descending Broadening Wedge pattern on the 12H timeframe. It’s now breaking above the 12H SMA50, which is a positive sign. In case of a breakout above the wedge resistance, the potential upside targets are:
🎯 $248.68
🎯 $269.69
🎯 $290.70
🎯 $320.61
🎯 $358.71
⚠️ Always use a tight stop-loss and maintain proper risk management.

AAVE usdt long signal---
📢 Signal Alert
🔹 Pair: AAVE / USDT
📈 Trade Type: Long
💰 Entry Zone: 198.05 – 200.92
🎯 Take-Profit Targets (with partial management):
▫️ TP1 = 204.35
▫️ TP2 = 208.68
▫️ TP3 = 212.00
▫️ TP4 = 214.84
🛑 Stop-Loss: 196.00
📊 Timeframe: 1H
⚖️ Risk/Reward Ratio: 3.0
📌 Suggested Leverage: 5x – 10x
⚠️ Capital management is mandatory.
💬 Please review the chart carefully before entry.
---
🧠 Technical Analysis Summary:
AAVE shows a bullish continuation pattern after finding strong support near 198–199 USD.
The price has broken above a local resistance zone and is forming higher lows, signaling potential upward momentum.
Volume is rising, confirming buyers’ control.
Momentum indicators such as RSI (above 55) and MACD bullish crossover strengthen the long bias.
A sustained close above 201.0 could accelerate the move toward 208–214 levels.
---
⚙️ Trade Management Tip:
After TP1 hits, move Stop-Loss to Entry and secure partial profits.
Allow the rest to ride toward TP3–TP4 for maximum gain.
---
⚠️ Disclaimer:
This setup is for educational purposes only and not financial advice.
Always manage your risk and perform independent analysis (DYOR) before trading.
---

AAVE USDT LONG SIGNAL ---
📢 Signal Alert
🔹 Pair: AAVE / USDT
📈 Trade Type: Long
💰 Entry Zone: 198.05 – 200.92
🎯 Take-Profit Targets (with partial management):
▫️ TP1 = 204.35
▫️ TP2 = 208.68
▫️ TP3 = 212.00
▫️ TP4 = 214.84
🛑 Stop-Loss: 196.00
📊 Timeframe: 1H
⚖️ Risk/Reward Ratio: 3.0
📌 Suggested Leverage: 5x – 10x
⚠️ Capital management is mandatory.
💬 Please review the chart carefully before entry.
---
🧠 Technical Analysis Summary:
AAVE shows a bullish continuation pattern after finding strong support near 198–199 USD.
The price has broken above a local resistance zone and is forming higher lows, signaling potential upward momentum.
Volume is rising, confirming buyers’ control.
Momentum indicators such as RSI (above 55) and MACD bullish crossover strengthen the long bias.
A sustained close above 201.0 could accelerate the move toward 208–214 levels.
---
⚙️ Trade Management Tip:
After TP1 hits, move Stop-Loss to Entry and secure partial profits.
Allow the rest to ride toward TP3–TP4 for maximum gain.
---
⚠️ Disclaimer:
This setup is for educational purposes only and not financial advice.
Always manage your risk and perform independent analysis (DYOR) before trading.
---

#AAVE Bears Ready For Further Downside | Must Watch For Bears Yello Paradisers! Are you watching what’s unfolding on #AAVEUSDT right now? Because if you’re not, this could catch you completely off guard. There’s a potential bearish breakdown brewing that could send #AAVE into much deeper territory. Let’s dive in before it's too late:
💎#AAVE has been trading inside a symmetrical triangle, caught between a descending resistance and ascending support. Each test of the upper boundary has been weaker, showing fading bullish momentum. Now, we’re pressing against the lower support line with sellers gaining control.
💎The current price is $222, and we’re right on the edge. A confirmed breakdown below the ascending support will flip the entire structure bearish. The 50 EMA is now acting as resistance, reinforcing this downward pressure and aligning with the broader setup.
💎If this bearish scenario confirms, the next downside target becomes the Support Zone around $195–180, but the real liquidity lies deeper. A sharp move could easily send #AAVEUSD into the Strong Demand Zone between $133–123, where we expect stronger buyers to finally show up.
💎However, this setup is invalidated if #AAVE breaks back above the Resistance Zone at $263. That would signal strength and likely trigger a fast bullish reversal targeting higher levels above $280.
Trade smart, Paradisers. This setup will reward only the disciplined.
MyCryptoParadise
iFeel the success🌴

AAVE USDT LONG SIGNAL---
⚠️ Disclaimer:
This analysis reflects personal market observation and is not a buy or sell signal.
Always analyze the chart carefully and use proper risk management before entering any trade.
📢 Signal Alert
🔹 Pair: AAVE / USDT
📈 Trade Type: Long
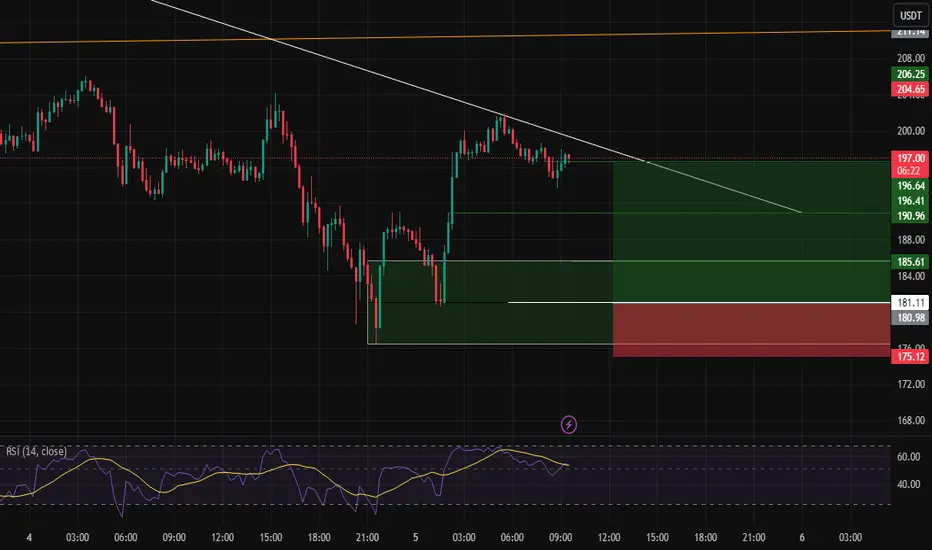
💰 Entry Price: 181.11
🎯 Take-Profit Targets:
TP1 = 185.61
TP2 = 191.00
TP3 = 196.70
🛑 Stop-Loss: 177.20
📊 Timeframe: 1H
⚖️ Risk/Reward Ratio: 2.63
📌 Suggested Leverage: 5x–10x
🔄 After reaching TP1, move Stop-Loss to Entry to secure profits.
---
🧠 Technical Analysis Summary:
AAVE is showing bullish continuation after reclaiming the key support zone around $180, which previously acted as resistance.
The price is currently holding above the EMA50 and forming higher lows, indicating renewed buying momentum.
A breakout above $182–$183 could trigger acceleration toward the next resistances near $185.6 and $191.0.
RSI is trending above 50 and showing increasing strength, confirming momentum alignment with bulls.
The stop-loss at $177.20 sits below the recent swing low, allowing for healthy retracement while maintaining a solid R/R ratio.
⚙️ Trade Management Tip:
Wait for a bullish 1H candle close above $181 for confirmation before entry.
Take partial profits at TP1 and trail your stop to lock in gains as the price approaches higher targets.
---
AAVE USDT LONG SIGNAL ---
⚠️ Disclaimer:
This analysis represents my personal opinion only and does not constitute financial advice or a buy/sell signal.
Please analyze the chart carefully and always use strict risk management before entering any trade.
📢 Signal Alert
🔹 Pair: AAVE / USDT
📈 Trade Type: Long
💰 Entry Price: 193.98
🎯 Take-Profit Targets:
TP1 = 198.09
TP2 = 202.70
TP3 = 206.80
🛑 Stop-Loss: 191.40
📊 Timeframe: 1H
⚖️ Risk/Reward Ratio: 5.0
📌 Suggested Leverage: 5x–10x
🔄 After TP1 is reached, move Stop-Loss to Entry to protect profits.
---
🧠 Technical Analysis Explanation:
AAVE is showing bullish structure continuation after finding strong support around the 191.0–192.0 demand zone, an area that previously acted as a key accumulation point.
The price is currently forming higher lows and trading above the EMA 50, which confirms that the short-term market bias remains bullish.
The RSI indicator has bounced from the midline (50), suggesting renewed momentum from buyers. Volume analysis also confirms increased participation on green candles, indicating potential follow-through to the upside.
The entry at 193.98 aligns with a recent retest of support after a minor pullback — a strong setup for continuation toward the resistance levels.
Targets (TP1–TP3) correspond to Fibonacci extension levels and local resistance zones, while the stop-loss at 191.40 is strategically placed below structural support to minimize risk.
⚙️ Trade Management Tip:
Wait for a bullish 1H candle confirmation (engulfing or breakout) before entering.
Secure partial profits at TP1 and trail your stop for maximum gain protection.

AaveAAVE (AAVE/USDT) remains within a long-term ascending channel, showing consistent higher lows since mid-2022. After a strong rally toward the $400–$420 resistance zone, the price faced rejection and is now testing the mid-channel support area around $200–$220.
This region has historically acted as a strong demand zone, aligning with the ascending green trendline. As long as AAVE holds above this level, the structure remains technically bullish in the bigger picture.
A successful rebound from here could lead to a continuation move toward $400, and a confirmed breakout above that range could open the way toward $670 and even higher channel targets near $950–$1,000.
Overall, AAVE looks technically healthy, and this correction might offer a solid reaccumulation opportunity for long-term investors.

AAVE USDT LONG SIGNAL---
📢 Signal Alert
🔹 Pair: AAVE / USDT
📈 Trade Type: Long
💰 Entry: 222.40
🎯 Targets (Take Profits):
TP1 = 224.65
TP2 = 226.80
TP3 = 228.50
TP4 = 231.90
🛑 Stop-Loss: 221.00
📊 Timeframe: 1H
⚖️ Risk/Reward Ratio: 6.85
📌 Suggested Leverage: 5x – 10x
---
🧠 Technical Analysis
AAVE is showing bullish continuation signals after consolidating near the 221 support area.
The price has bounced from support and is forming a higher low pattern.
RSI is turning upward and remains above the midline, showing growing bullish momentum.
Entry at 222.40 offers a favorable low-risk, high-reward setup.
Stop-Loss at 221.00 is set below the nearest swing low to manage risk efficiently.
⚠️ Confirm entry with a bullish 1H candle close or breakout of minor resistance. Consider partial profit-taking at TP1 and TP2, while holding remaining positions toward TP3 and TP4
