Trade ideas

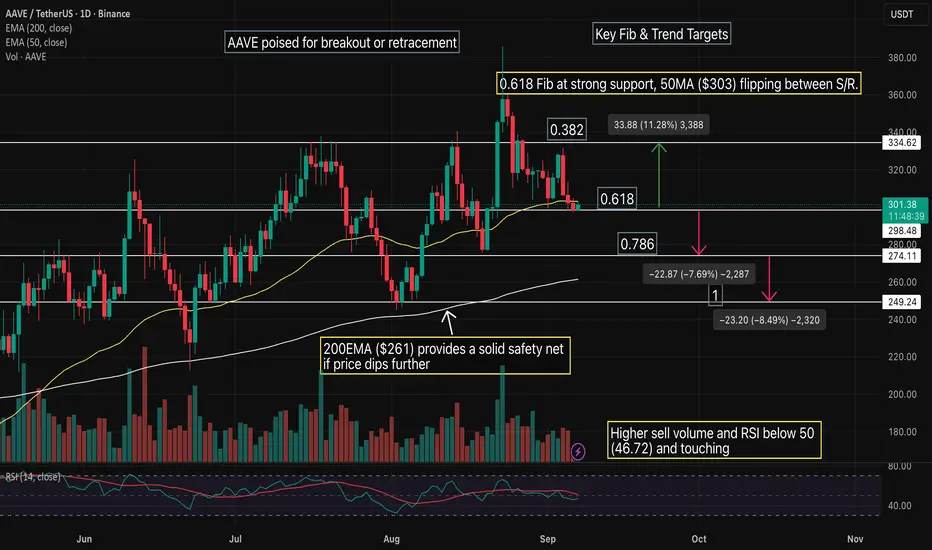
Simple Aave daily Chart Setup – Feedback Welcome!Hey traders! I'm testing out a new, simplified chart setup and wanted to share it with the community here before posting it on X. I'd really appreciate any feedback — whether it's suggestions for improvement or just letting me know if it looks clean and useful. Thanks in advance!
aave dump to $294sl: 303.35
tp: 294 area
structurally seems a bit low on daily but still high on weekly tf, 4hr and 1hr tf still bearish. Not the most confident setup but still think the odds stack in favors of the bears more.

Aave (AAVE): We Might Get Good Bounce From Here | BullishSeeing a good chance for AAVE to have proper MSB and bounce very soon. We are looking for a local support area near $257, which would also mean that the price will fill the CME gap. From there, we will start looking for proper upward movement towards our target in the upper area.
We are also keeping an eye on the liquidity zone, as if we see the pricefall further, then our SL will be extended, but if we get proper MSB near support, then the SL remains the same!
Swallow Academy

AAVE 8H – Trendline + 0.618 Fib Retest, Bounce or Breakdown?AAVE is currently testing a confluence zone where the ascending trendline meets the 0.618 retracement at 299. Price is sitting in a critical decision area — a successful bounce here could set up continuation back toward the 315 level and eventually the 367 resistance.
Failure to hold this confluence opens the door to a deeper retrace toward the 0.786 level at 275. This level will be key for determining whether bulls maintain control or bears take momentum back.

AAVE SHORT TRADE SETUPNew Trade Setup: AAVE-USDT
SHORT
Entry: 318.07 or CMP
Target: TP1: 313.01, TP2: 307.95, TP3: 302.89, TP4: 297.82
Stoploss: 332.48
Leverage: 1X
Technical Analysis: AAVE/USDT is taking reversal at its resistance zone, indicating a high chance of a short-term trend reversal. We may see an downtrend in the short term

AAVE 1D – Consolidating Above Trendline, $402 High in SightAAVE is holding firm along its trendline support while pulling back into the golden retracement zone. As long as this structure holds, the bias leans bullish with $402 — the previous major high — acting as the next upside target.
Key points:
$316–300 retracement zone → strong support zone.
Trendline support → guiding structure higher.
$402 high → major resistance to reclaim before continuation.
The setup shows a healthy correction inside an uptrend, with potential to retest the $402 level if buyers hold control.

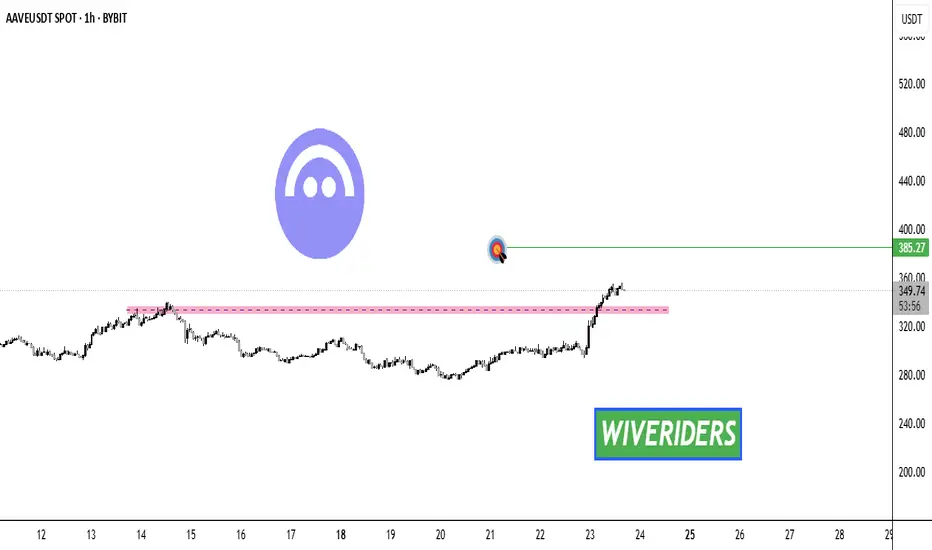
AAVE 4H - Break Toward $385 or Liquidity Grab Below?AAVE is currently testing the $315 demand zone after a strong push earlier in the month. This area has acted as support before, making it a key level for buyers to defend.
If bulls hold above the demand zone, continuation toward $385 resistance is on the table, aligning with the recent range high. Failure to hold here, however, exposes liquidity levels below at $293 and $260, which could be swept before any recovery.
Indicators are mixed: Stoch RSI is extended into overbought territory while the MACD Liquidity Tracker is still signaling bearish momentum, suggesting the potential for further downside before a clean reversal.
Key levels:
– Demand Zone: $315
– Liquidity: $293, $260
– Resistance: $385

AAVE 4H Analysis | Key Triggers Ahead💀 Hey , how's it going ? Come over here — Satoshi got something for you !
⏰ We’re analyzing AAVE on the 4-Hour timeframe timeframe .
👀 On the 4-hour timeframe of AAVE, we can see that after breaking the trendline, its volume increased and it moved toward the $361 resistance, then entered a corrective trend. Currently, this coin is ranging inside a triangle consolidation, and the volume has dropped significantly.
⚙️ The RSI fluctuation of this coin is still below the 50 zone, and two key levels have been considered for its movement: 55.15 and 37.89. If the RSI passes beyond these levels, this coin can experience another movement leg.
🕯 The size and volume of the candles have decreased, with the red candles being bigger and more numerous than the green ones. This could be a sign of the end of selling pressure or the beginning of a new wave of selling pressure. The coin is in a very important area, and with today’s news it may move upward and end this corrective trend.
💰 On the 4-hour timeframe of the trading pair AAVEBTC, after a strong rally against Bitcoin, this coin is now in a triangle consolidation and the volume has dropped. A significant amount of this coin has been sold and converted to Bitcoin (buyer makers of Bitcoin). A ceiling and floor have also been formed as our alarm zones, where price action in these areas can help us make the best decision for this trading pair.
🔔 The alarm zone for this coin is considered at $323 for a long trade and $301 for a short trade. Today, this coin recorded a historic milestone in DeFi, and with the breakout and confirmation of the marked trendline and the activation of triggers, it can experience good growth. 🚀
❤️ Disclaimer : This analysis is purely based on my personal opinion and I only trade if the stated triggers are activated .

AAVE LONG4H/D demand zone tapped
Clear CIOF
Tapped volumized OB 4H, targetting next line of resistance.

Aave Trading Strategy Aave/usdt
Bias: Long
Limit Order
Entry: 310.14, 307.3, 299.67, 294
Leverage 10x
TP 1: 320.35
2: 328.43
3: 335.58
SL: 288.01
Disclaimer: You must conduct your own research, consider your risk tolerance, and never invest more than you can afford to lose.

Aave Falters at Key Resistance, All Eyes on $227 Defensive ZoneAave (AAVE) failed to break above the $390 resistance level and has since turned lower. The market is now watching closely as price approaches the $227 support area, a zone that could determine whether the broader bullish structure holds or breaks down.
Price Rejection at Resistance
AAVE attempted to extend higher but was firmly rejected at $390, a level that has capped momentum before. The rejection sparked a corrective move, shifting sentiment short term and forcing the asset back toward mid-range support. This rejection confirms $390 as a major ceiling in the current structure.
$227 as the Critical Line in the Sand
The decline has brought price action toward the $227 region, which carries strong technical significance. This level aligns with the 0.618 Fibonacci retracement of the recent move, as well as the prior structural higher low. The confluence here makes $227 the most important level for bulls to defend if they want to maintain the upward narrative.
Volume and Market Structure
One notable observation is that bullish volume has faded during this pullback. Previous rallies in AAVE were supported by consistent spikes in demand, fueling continuation. For a reversal from $227 to gain traction, the market needs to see a clear return of strong buy-side activity. Without this, any bounce risks being short-lived.
Scenarios to Watch
Bullish Case: If $227 holds with renewed volume, AAVE could rotate higher and retest the $390 resistance. A successful breakout from there would mark a significant continuation of the uptrend.
Bearish Case: If $227 breaks with conviction, the bullish structure of higher lows would collapse, opening the door to a deeper retracement toward lower support zones.
Outlook
Aave sits at a decisive juncture. The rejection at $390 has confirmed overhead resistance, but the upcoming reaction at $227 will dictate the next chapter. Hold the level, and a path back toward $390 remains alive. Lose it, and momentum shifts firmly in favor of sellers.

Is AAVE About to Explode Above or Collapse? Key Levels to WatchYello Paradisers! Is #AAVE quietly prepping for a major breakout… or is this just another setup to wipe out the impatient bulls before the real move begins?
💎#AAVEUSDT is moving in a textbook ascending channel, respecting both trendline resistance and support beautifully. The structure is clean, but deceptive. While many may assume this is an easy path higher, seasoned traders know better — especially with what’s happening near the critical resistance zone.
💎The red resistance zone ($270–$280) that was previously a major support during the last cycle is now acting as heavy resistance again. #AAVEUSD is currently battling this zone after several failed attempts to break through. But the structure still leans bullish as long as we stay within the ascending channel.
💎Both the 50 & 200 EMA are now acting as dynamic support. This is key — if the price remains above these EMAs and the lower channel boundary, momentum favors the bulls. A decisive breakout above $280 could trigger a parabolic rally toward the $375–$410 range, a level where serious resistance and profit-taking are expected.
💎However… if bulls get lazy and we see a strong breakdown below the ascending channel, especially below $237, the setup gets shaky fast. A complete invalidation of the bullish case occurs if AAVE loses $209 — from there, expect a breakdown structure to unfold with a likely test of much lower levels and a possible retest of the $150 zone.
Trade smart, Paradisers. This setup will reward only the disciplined.
MyCryptoParadise
iFeel the success🌴

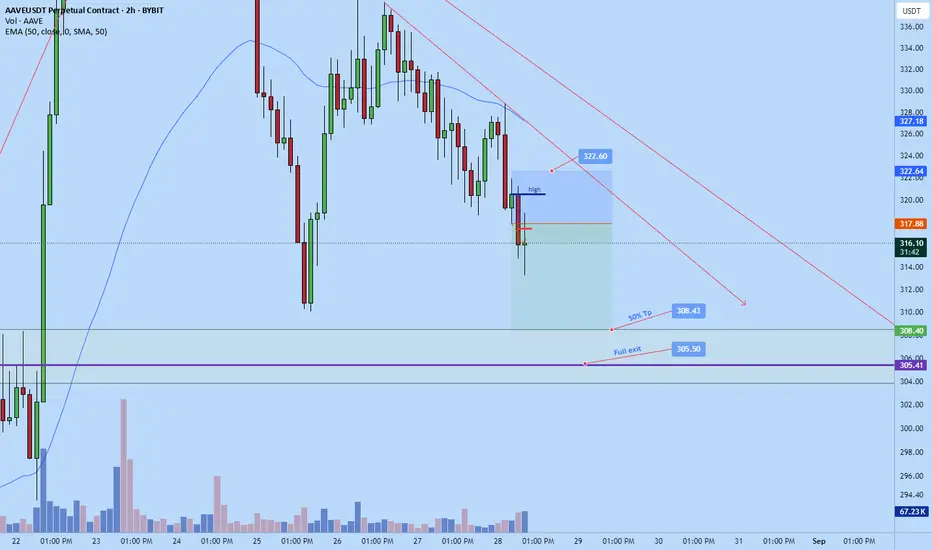
Aave dump today down to $305.5 areaAave dump today down to $305.5 area
Sl: 322.6
tp: 305.5
Potential early partial at $308.43
AAVE LONG1D Technical Analysis for CRYPTOCAP:AAVE with Supply Zone and 4H Demand Confirmation
On the daily timeframe, CRYPTOCAP:AAVE is currently navigating a key supply zone around the $285 to $308 range which has historically acted as a strong resistance area, causing pauses or pullbacks during prior rallies.
Recently, the price of CRYPTOCAP:AAVE dropped sharply after failing to hold above $307.86 and found strong support in a key 4-hour demand zone near $255. This demand zone provides a crucial technical floor confirming buyers’ presence and a potential base for recovery.
Following the tap of the 4H demand, CRYPTOCAP:AAVE has seen a bounce of approximately 12%, attempting to re-enter the resistance zone while testing overhead supply congestion.
Momentum indicators on the daily chart, such as RSI and moving averages, indicate neutral to mildly bullish conditions; the key to sustained upside will be maintaining price above the $255 demand and breaking above the $285–$308 supply with solid volume.
Failure to reclaim and hold above this supply zone risks resumption of the downtrend, with lower support levels around the $250 mark serving as critical decision points for bulls and bears.


Key AAVE Price Indicators Still Point To $430AAVE has slipped to $325, flipping the $339 zone from support into near-term resistance. The cost-basis heatmap confirms heavy clusters between $337–$339, with about 279,000 AAVE held there, which explains why this area is difficult to reclaim. Immediate upside also faces resistance at $352–$371, while a confirmed daily close above could reopen the path to the Fibonacci extension target of $430.
On-chain context supports the overall trend. Exchange reserves have declined 4.33% in 30 days to 5.4 million AAVE, with 244,000 tokens ($79 million) pulled from exchanges. Meanwhile, whale holdings rose 13.5%, adding 2,320 tokens (~$750,000). Sellers have also eased: spent coins dropped from 46,600 on Aug 23 to 15,230, a 67% decline, showing long-term holders are not rushing out.
For now, $323 is acting as fragile support. Holding this band could keep the bullish case alive, but failure below $275 risks flipping AAVE’s structure bearish.

aave short to $335Just recently opened up a short position on aave. Aiming for $335. Weekly is bullish and likely to push for new highs this week but at the moment its quite high on the daily and likely to correct before continuation
sl: 355.5
Tp: 335
2RR

AAVEBluechip ethereum coin
With eth pushing to highs is this the future world lending markets final breakout?
14% to local highs
600$ ath is alot more
Defi is pursuing its modular course with further integration, staking on metamask via aave
Perps on phantom via hyperliquid
The future of finance is modular defi apps
It appears the backbone of these is already built and things will be built on top of them or they will be integrated.

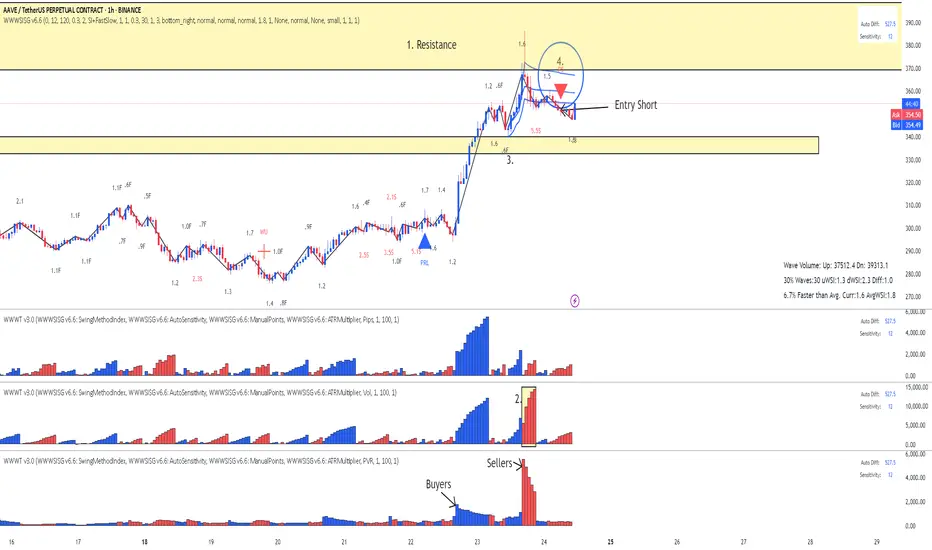
AAVE - Entered Short based on Lesson 15
Reading the chart with Lesson 15 methodology:
1. Location: Resistance coming from the weekly chart
2. Largest down volume wave after a long time
3. Place AVWAP at the of the last up wave. Price crossed it and pulled back to AWVAP
4. The Entry, a PS signal after the pullback to AVWAP
Enjoy!
PS. PVR show Buyers and Sellers locations.
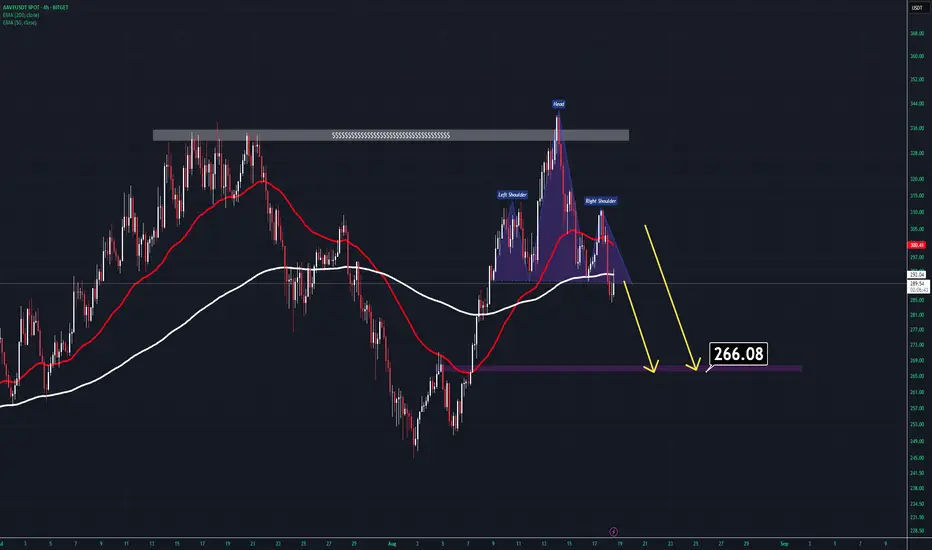
AAVE ANALYSIS (4H)After grabbing the upper liquidity pool, AAVE has shifted into a bearish structure.
Currently, the price is trading below both the 50 EMA and the 200 EMA.
Additionally, we can clearly identify a textbook Head & Shoulders pattern on the chart.
With these confirmations, AAVE remains bearish, and the downside target should be around $270 – $266.
Thanks for reading.
AAVE Breakout Alert! 🚨 CRYPTOCAP:AAVE Breakout Alert! 🚨
CRYPTOCAP:AAVE has broken out of the red resistance zone 🔴✅
The first target is the green line level 🎯
This breakout confirms bullish momentum and could drive further upside if buyers maintain control 💪
Ultra-Bullish Aave Reveals Altcoins Market Next MoveAAVE is up 210% since its 7-April market bottom. Wow, a strong rise. The bullish move started to lose momentum after 11-June. At this point, a bullish consolidation pattern showed up on the chart. AAVEUSDT moved within a rising triangle for 74 days.
Today, the action is full green above this 2.5 months old resistance. The upper boundary of the triangular pattern. As the current session (candle) is trading above the highs all these months—AAVE just hit the highest price since Jan. 2025—this confirms a bullish bias.
Since Aave has been straight up; Growing and then some more growth; moving ahead. We can use it when the market shows any type of doubt. Is the current bullish breakout a real move or just a fakeout, a bull trap? This is the question that AAVEUSDT daily can answer.
Seeing how AAVE is full green and moving higher, we can expect the rest of the market to do the same. It is still early in the current move, but we have full blown confirmation. All-in now or tomorrow might already be too late.
Thanks a lot for your continued support.
Namaste.
