TradeCityPro | AAVE: Trendline Squeeze, Breakout Loading👋 Welcome to TradeCity Pro!
In this analysis, I want to review the AAVE coin for you—one of the lending projects in the Ethereum ecosystem, currently ranked 32 on CoinMarketCap with a market cap of $3.36 billion.
⏳ 4H Timeframe
On the 4-hour timeframe, this coin started a downtrend after being rejected from the 301.39 zone and, together with a descending trendline, has been moving downward.
✔️ Price has now reached it again, faked it once, and is still ranging around this trendline.
✨ If the trendline is broken and price holds above its trigger, it can begin an upward move.
⚡️ The trigger we have to confirm the start of this move is the 234.24 zone. With the break of this trigger, we can also use it to open a long position.
📊 The next resistance levels this coin has are 261.25 and 302.18, each of which can be used as the next trigger for a long position.
💥 For a short position, the main floor that has formed is 202.86. A break of this level will be a very good trigger for a short position.
📝 Final Thoughts
Stay calm, trade wisely, and let's capture the market's best opportunities!
This analysis reflects our opinions and is not financial advice.
Share your thoughts in the comments, and don’t forget to share this analysis with your friends! ❤️
Trade ideas

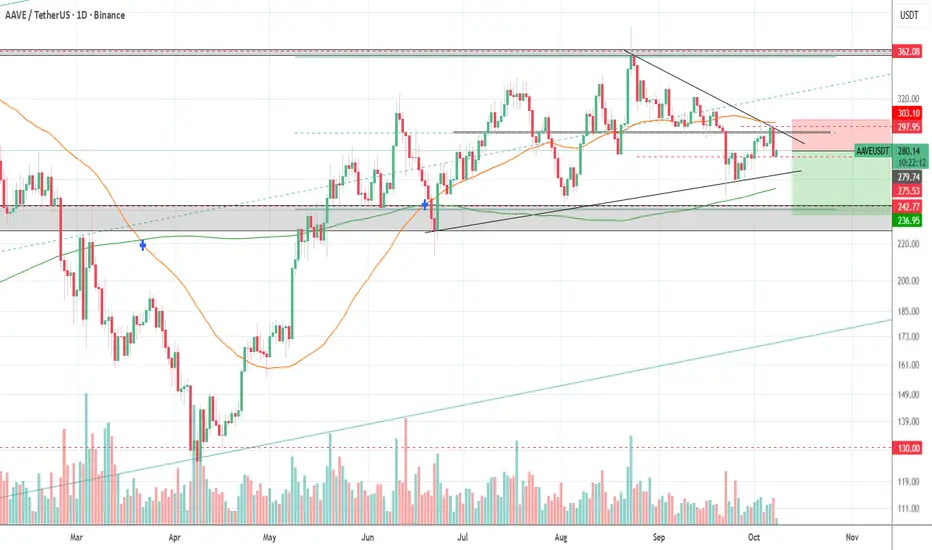
Aave (AAVE): Looking For Potential Buy EntryAAVE had a solid reaction from the lower support area, where buyers stepped back in and held control. As long as this zone holds, we’re looking at two potential trades — first being the short-term move toward EMAs, and second, a larger continuation setup once a proper market structure break forms.
Both setups depend on buyers keeping momentum here, so we’ll stick to the plan and watch how price reacts around the EMAs next.
Swallow Academy

AAVE shortThesis: short AAVE on a daily retest-and-failure of the 200‑day region, using that moving average as the regime filter and invalidation line.
Entry: wait for price to tag 255–259 and print a bearish rejection (wick and close back below) or a 4h lower high inside that band to trigger the short with precision.
Stop: place a hard stop on a daily close above 262–265, signaling acceptance back over the 200‑day and invalidating the setup per trend‑filter rules.
Sizing: risk no more than 0.5–1.0% of equity, sizing to the distance between entry in 255–259 and the 262–265 invalidation range to keep consistency across volatility regimes.
Targets: T1 at 236–240 to harvest initial momentum, T2 at 225, T3 at 211, and a stretch toward ~196 aligned with common 4h Fibonacci extension mapping of the downswing.
Management: on reaching T1, reduce 25–33% and move stop to break‑even or just above the most recent 4h lower high to protect gains while preserving downside participation.
Trailing: continue to trail above successive 4h lower highs or via a fast MA swing method as long as daily price remains beneath the 200‑day to stay aligned with the regime filter.
Confirmation cues: rising daily ADX and RSI below 50 favor continuation after rejection, improving the odds that rallies into the MA cluster fail rather than flip the regime.
Invalidation protocol: two strong daily closes above 262–265 or clear basing above the 200‑day require full exit and reassessment to avoid fighting a potential trend reversal.
Relative edge: AAVE shows clearer overhead confluence and momentum context than the broad market, which still hovers nearer its own 200‑day, offering better asymmetry for selling strength here.


AAVE. USDT On the weekly chartAAVE fluctuates between long and short positions.
Professional traders can certainly hold long and short positions, but non-professional traders may be better off waiting for AAVE to correct on the weekly time frame to avoid losses or liquidation.
A price around $180-200 may be a good option.
The digital currency market is very risky, and in recent years, due to the oversupply of all types of tokens, this risk has increased.
what is your opinion ?

#AAVEUSDT Daily ChartPrice previously did a change of character before dropping and leaving a daily supply zone at around $280 also sweeping the daily demand at $220 before moving up again aggressively. MACD is showing bearish weakness, RSI is sold and EMAs are turning bearish. Price is expected to tap into the daily supply before potentially continuing its bearish movements. This is a crucial area which price would need to break in order to have bullish confirmation again.

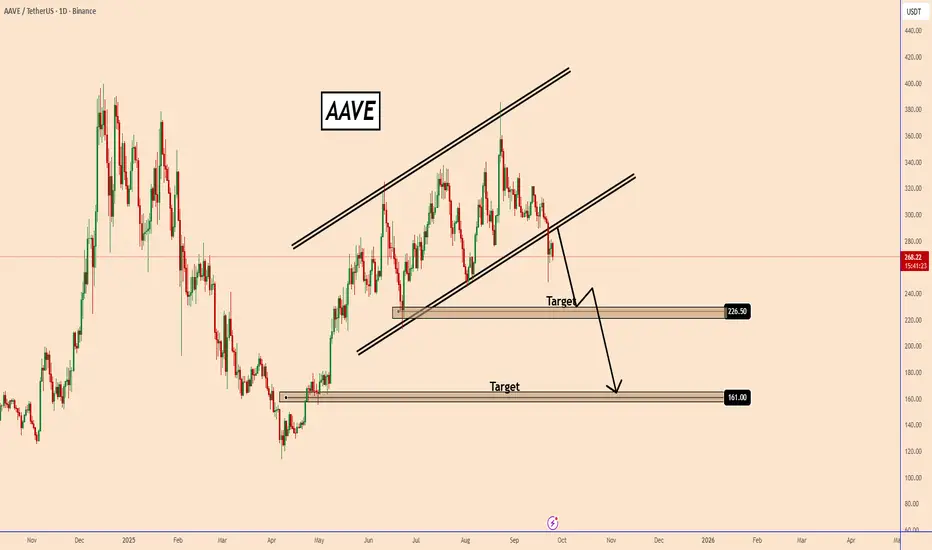
AAVE Confirmed a Larger Decline on The Daily Chart AAVE Confirmed a Larger Decline on The Daily Chart
On the Daily Chart we can see that AAVE has broken below the Ascending Channel Pattern, indicating weakness.
The sellers are now in control and further declines are possible. It may also make a small correction until the price realizes that AAVE is preparing for a downward move.
First Target: 226.50
Second Target: 161.00
If the downward momentum continues, the price could head towards these support areas and possibly even lower.
You may find more details in the chart!
Thank you and Good Luck!
❤️PS: Please support with a like or comment if you find this analysis useful for your trading day❤️
AAVE/USDT Short Set-up
— Multiple tests of the support level, decreasing volatility, compression below the 50-day MA, high probability of testing the 200-day MA and a strong support zone. The coin is strong and currently in accumulation.. The BTC market index short signal has not yet played out.
— Entry: $280 (Market Sell)
— Stop: $305
— Target: $237 ✅
Risk is 1% of the account balance
AAVE/USDT;BUY LIMITHello friends
Given the price reaching the specified support and the strong support of the price by buyers in the specified range and the failure of the specified resistance, we can buy in steps with risk and capital management and move to the specified targets.
*Trade safely with us*

AAVE Update📊 CRYPTOCAP:AAVE Update
CRYPTOCAP:AAVE has successfully broken out of the red resistance zone 🔥
✅ First target reached — and now second target green line level also 🚀

AAVE Near Crucial Support, Setting Stage for 14% Bounce to 326$Hello✌️
Let’s analyze Aave’s price action both technically and fundamentally 📈.
🔍Fundamental analysis:
Aave’s next big update (V4) will make its markets more connected and efficient. If it succeeds like the last upgrade, AAVE’s value could move toward $326 again. 💧
📊Technical analysis:
BINANCE:AAVEUSDT is approaching a key monthly support area. If this zone holds, price could see a potential 14% rebound toward the 326 level, with confirmation coming from sustained buying momentum around support. 📊💎
📈Using My Analysis to Open Your Position:
You can use my fundamental and technical insights along with the chart. The red and green arrows on the left help you set entry, take-profit, and stop-loss levels, serving as clear signals for your trades.⚡️ Also, please review the TradingView disclaimer carefully.🛡
✨We put love into every post!
Your support inspires us 💛 Drop a comment we’d love to hear from you! Thanks, Mad Whale

AAVEUSDTBINANCE:AAVEUSDT is short term uptrend but in long tern have Triangle pattern for jump or dump. The price 297.40$ is key level for bullish trend so wait for break this level for buy.
🟢Resistance: 297 - 323 - 351 - 376
🔴Support: 270 - 252
⚠️Please control risk management.

AAVE is forming a bullish Double Bottom pattern📊 CRYPTOCAP:AAVE Market Update
CRYPTOCAP:AAVE is forming a bullish Double Bottom pattern ✅
It’s now testing the red resistance zone 🔴 — if it breaks out with confirmation, the first target will be the blue line level 🎯
AAVE OpportunityAAVE big accumulation going on, retest in progress.
Waiting for the price to go up to the W/M orderblock around 200-250usd

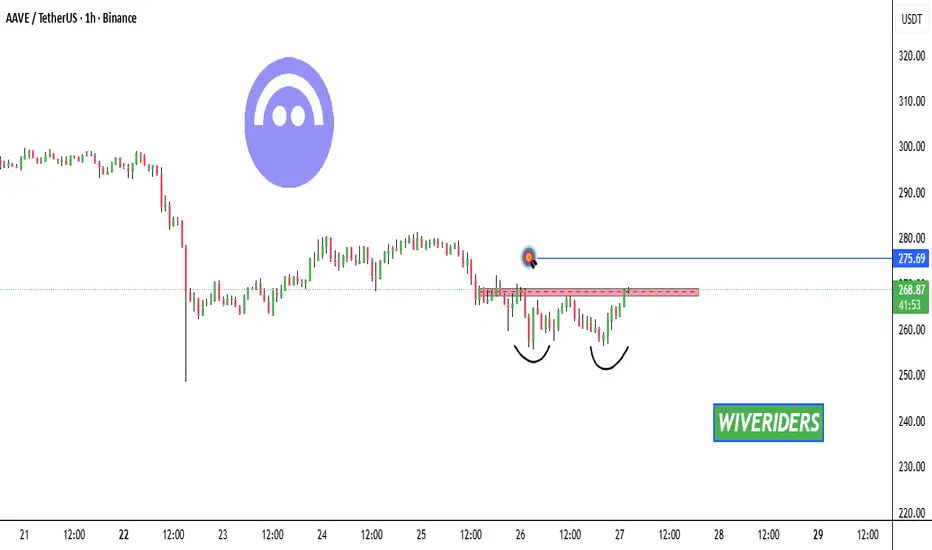
Signal #1 BUY AAVE 15mFree Signal #1
TF: 15m
in #AAVE
BUY SIGNAL
Entry: 276.94
SL: 267.60
TP1: 289.32 (75%)
TP2: 300.18
TP3, TP4 soon in comments after touch TP2
Risk: 1-5% of your Balance
S.Reza Mehrjuyan / CEO FNS
Analyst, Manager

AAVE is forming a potential double bottom pattern📊 CRYPTOCAP:AAVE Market Update
CRYPTOCAP:AAVE is forming a potential double bottom pattern 🔄. If it breaks out of the red resistance zone 🔴, the first target will be the 🔵 blue line level 🎯.
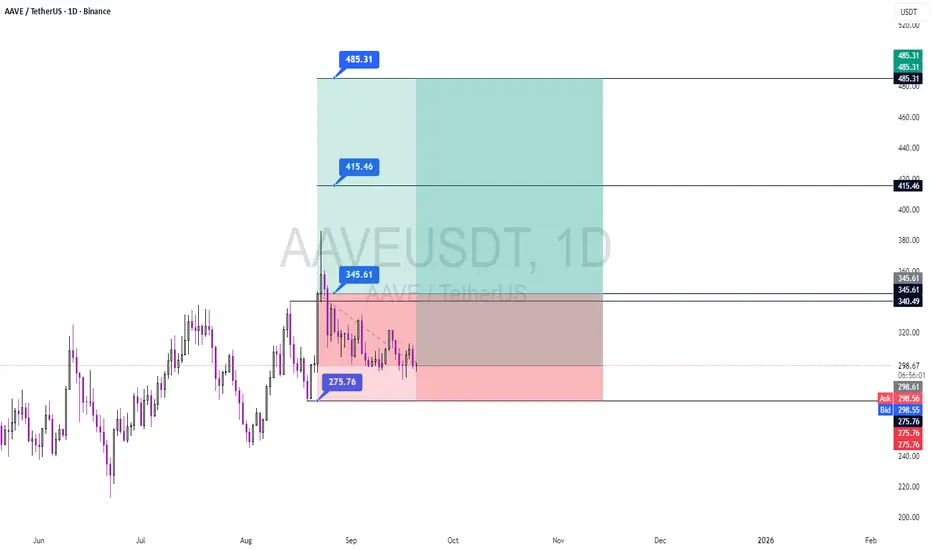
Professional Analysis and BUY SIGNAL: AAVEUSDT (Daily Timeframe)Current Setup:
AAVE has delivered a buy signal following a successful breakout and consolidation above the key $340.49 resistance level, with confirmation at $345.61. Although the second candle after the signal touched $380 and formed a large upper shadow (indicating short-term profit-taking and buyer trapping), the overall structure remains aligned with the bullish trajectory. The asset is now consolidating within the $345.61–$275.76 range, offering a potential entry zone for strategic buyers.
Trigger & Confirmation:
The buy signal was confirmed at $345.61. While the rejection at $380 suggests increased short-term volatility, it does not invalidate the broader bullish outlook. Traders may consider entries near the $345–$350 support zone, with a decisive close above $380 reaffirming momentum.
Projection:
Upon sustained bullish momentum, AAVE is poised to target $415.46 (Target 1) and $485.31 (Target 2). The recent rejection at $380 implies potential consolidation before upward resumption. A breakout above $380 could accelerate momentum toward higher targets.
Risk Management:
Stop-Loss: $275.76 (daily close below).
Position Strategy:
Given the recent volatility, limit orders near $345–$350 are advised for optimal risk-reward.
Use SPOT trading or low leverage (≤3x) to mitigate volatility risks.
Risk ≤5% of capital per position.
At $415.46 (Target 1), close 75% of the position to secure profits and adjust the stop to breakeven.
Hold the remainder toward $485.31 (Target 2).
Note: The upper shadow at $380 underscores the need for disciplined entry and risk management. This signal remains valid unless $275.76 is lost.
Trade Safe,
S.Reza Mehrjuyan / CEO FNS
Analyst, Manager
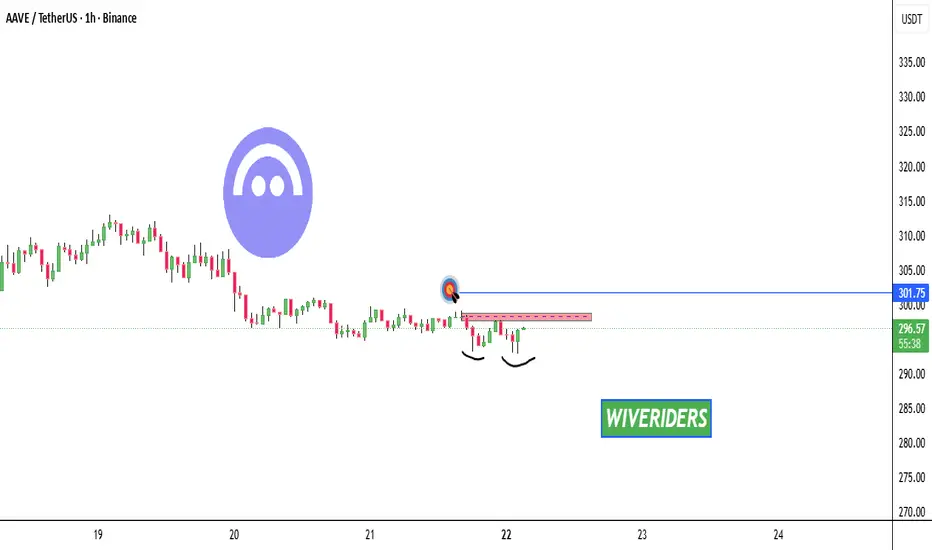
AAVEUSDT – Quick Dip Play?Hi everyone! Today I’m eyeing a possible slight move down on AAVEUSDT. Plan is simple: tight stop-loss, risking just 0.5% of the account — no greed here.
On the 4H timeframe, EMAs are tightening, which often leads to a strong move in either direction. Fundamentally, the bias still leans bullish after yesterday’s news, but we might get a small dip first before any pump.
Risk is balanced — more of a 50/50 setup — so discipline is key. Let’s see how it plays out. Good luck! 🍀

AAVE has formed a bullish double bottom📊 CRYPTOCAP:AAVE Market Update
CRYPTOCAP:AAVE has formed a bullish double bottom 📈
👉 If it breaks out the red resistance zone 🔴, the first target will be the green line level 🎯

AAVE/USD - Bearish OutlookBINANCE:AAVEUSDT AAVE/USD - Looking for strong bearish around Trendline and Resistance Zone.
Fundamental Update :
Decentralized liquidity protocol Aave announced it had surpassed $60 billion in net deposits, scammers launched a phishing campaign targeting its users through Google Ads, according to security researchers.
Support by Likes and Comments.
Thank you.

AAVE has formed a bearish Head & Shoulders pattern 📊 CRYPTOCAP:AAVE Market Update
CRYPTOCAP:AAVE has formed a bearish Head & Shoulders pattern 🦅
👉 Price already broke down the black neckline ⚠️
👉 Until $310 is broken to the upside, AAVE is not bullish yet.
⚡ Stay cautious — manage risk before entering.

AAVE Market Update📊 CRYPTOCAP:AAVE Market Update
CRYPTOCAP:AAVE trading around $303 💵
👉 If you want to enter or accumulate more, better to wait for retracement into green zone before long entry 🟢🚀
⚡ Trade smarter, not hope 🔑
