Trade ideas

Key AAVE Price Indicators Still Point To $430AAVE has slipped to $325, flipping the $339 zone from support into near-term resistance. The cost-basis heatmap confirms heavy clusters between $337–$339, with about 279,000 AAVE held there, which explains why this area is difficult to reclaim. Immediate upside also faces resistance at $352–$371, while a confirmed daily close above could reopen the path to the Fibonacci extension target of $430.
On-chain context supports the overall trend. Exchange reserves have declined 4.33% in 30 days to 5.4 million AAVE, with 244,000 tokens ($79 million) pulled from exchanges. Meanwhile, whale holdings rose 13.5%, adding 2,320 tokens (~$750,000). Sellers have also eased: spent coins dropped from 46,600 on Aug 23 to 15,230, a 67% decline, showing long-term holders are not rushing out.
For now, $323 is acting as fragile support. Holding this band could keep the bullish case alive, but failure below $275 risks flipping AAVE’s structure bearish.

aave short to $335Just recently opened up a short position on aave. Aiming for $335. Weekly is bullish and likely to push for new highs this week but at the moment its quite high on the daily and likely to correct before continuation
sl: 355.5
Tp: 335
2RR

AAVEBluechip ethereum coin
With eth pushing to highs is this the future world lending markets final breakout?
14% to local highs
600$ ath is alot more
Defi is pursuing its modular course with further integration, staking on metamask via aave
Perps on phantom via hyperliquid
The future of finance is modular defi apps
It appears the backbone of these is already built and things will be built on top of them or they will be integrated.

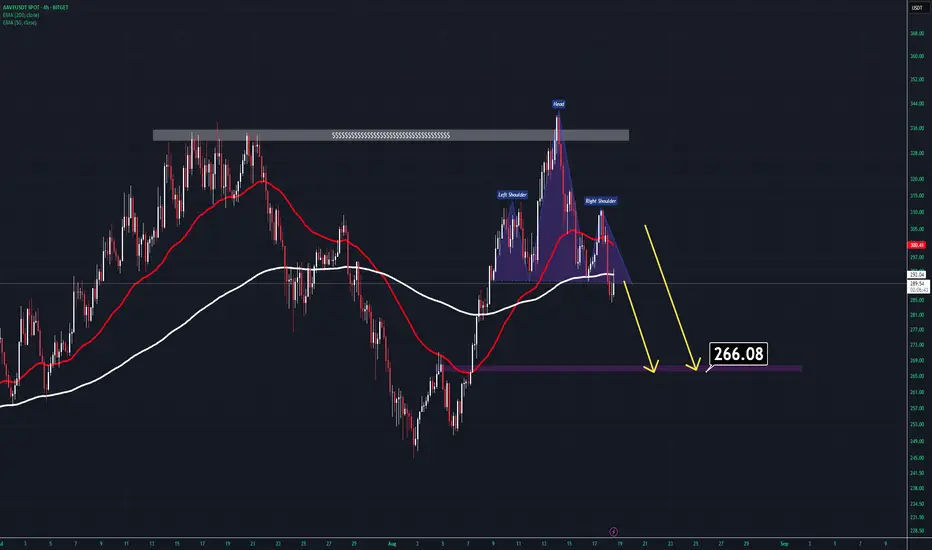
AAVE ANALYSIS (4H)After grabbing the upper liquidity pool, AAVE has shifted into a bearish structure.
Currently, the price is trading below both the 50 EMA and the 200 EMA.
Additionally, we can clearly identify a textbook Head & Shoulders pattern on the chart.
With these confirmations, AAVE remains bearish, and the downside target should be around $270 – $266.
Thanks for reading.
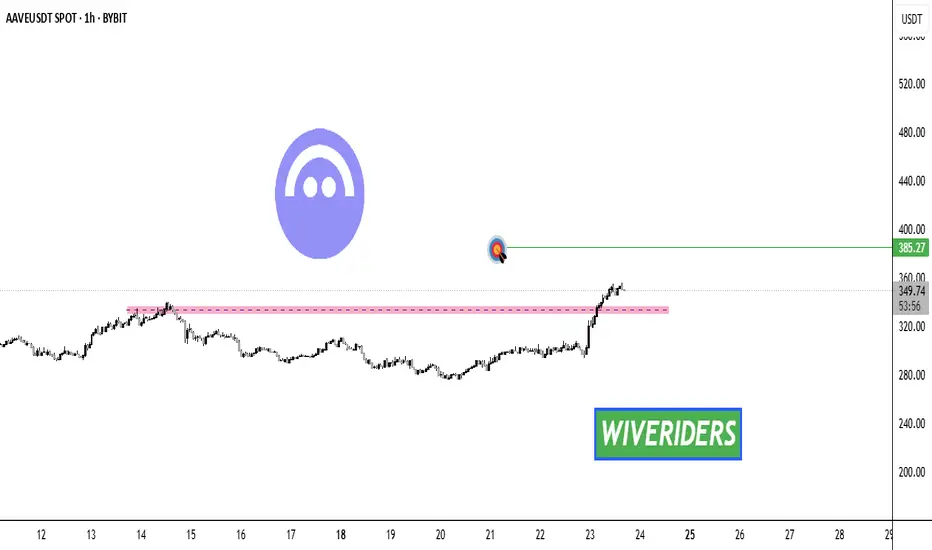
AAVE Breakout Alert! 🚨 CRYPTOCAP:AAVE Breakout Alert! 🚨
CRYPTOCAP:AAVE has broken out of the red resistance zone 🔴✅
The first target is the green line level 🎯
This breakout confirms bullish momentum and could drive further upside if buyers maintain control 💪
Ultra-Bullish Aave Reveals Altcoins Market Next MoveAAVE is up 210% since its 7-April market bottom. Wow, a strong rise. The bullish move started to lose momentum after 11-June. At this point, a bullish consolidation pattern showed up on the chart. AAVEUSDT moved within a rising triangle for 74 days.
Today, the action is full green above this 2.5 months old resistance. The upper boundary of the triangular pattern. As the current session (candle) is trading above the highs all these months—AAVE just hit the highest price since Jan. 2025—this confirms a bullish bias.
Since Aave has been straight up; Growing and then some more growth; moving ahead. We can use it when the market shows any type of doubt. Is the current bullish breakout a real move or just a fakeout, a bull trap? This is the question that AAVEUSDT daily can answer.
Seeing how AAVE is full green and moving higher, we can expect the rest of the market to do the same. It is still early in the current move, but we have full blown confirmation. All-in now or tomorrow might already be too late.
Thanks a lot for your continued support.
Namaste.

AAVE 4H – FVG Re-Test Setting Up Liquidity Sweep?AAVE is trading around 300 after a sharp impulse and retrace, leaving behind a clear 4H FVG at 315–320. Price action suggests a likely re-test of imbalance before choosing direction.
FVG (315–320): Main rejection zone above.
Liquidity Above: 334 remains the upside target if reclaimed.
Liquidity Below: 249 is the primary downside liquidity pool.
Momentum: Stoch RSI maxed out, pointing toward exhaustion.
Unless bulls reclaim and hold above the FVG, bias favors a sweep into 249 liquidity after re-test.

Aave Wave Analysis – 19 August 2025- Aave falling inside impulse wave (1)
- Likely to fall to support level 248.5
Aave cryptocurrency continues to fall inside the impulse wave (1), which started earlier from the resistance zone between the multi-month resistance level 335.00 (which has been reversing the price from January) and the upper daily Bollinger Band.
The downward reversal from this resistance zone created the daily Japanese candlesticks reversal pattern Bearish Engulfing, which started the active intermediate wave (1).
Aave cryptocurrency can be expected to fall to the next support level 248.5 (which stopped the previous wave 4).

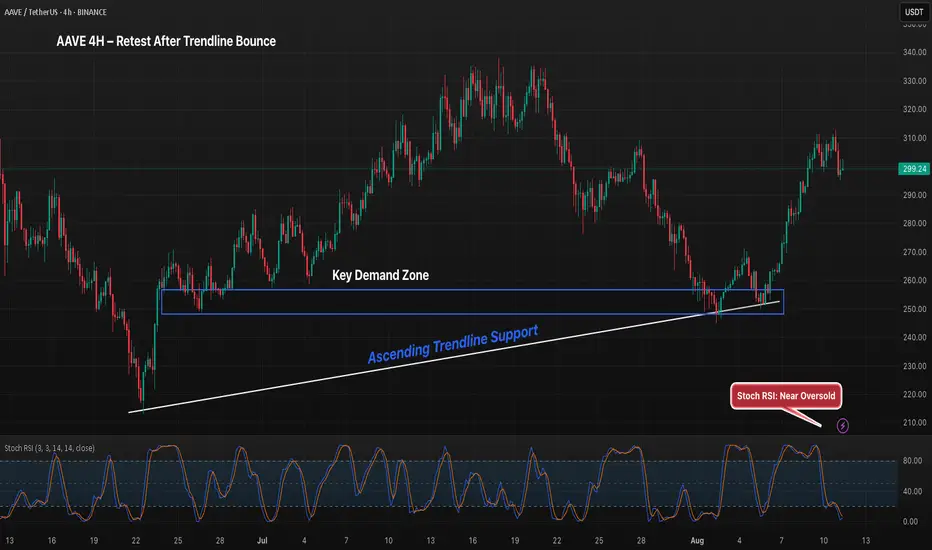
AAVE 8H – Will Trendline Support Fuel Another Run?AAVE is pulling back from the 330–345 resistance zone, currently trading near 294. Price remains above the long-term ascending trendline (~260), which has supported the uptrend since April.
Bull case: If the trendline holds and Stoch RSI turns up from oversold, a bounce toward 330–345 is likely, setting up another breakout attempt.
Bear case: A breakdown below 260 would invalidate the ascending structure and risk deeper correction toward 220.
Momentum is oversold, suggesting a rebound is possible, but confirmation requires holding the trendline and reclaiming 300+.

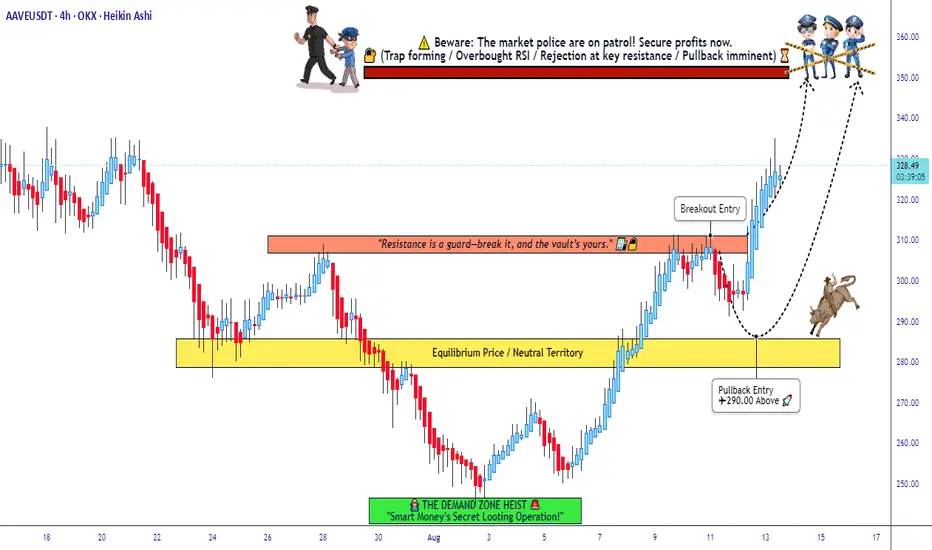
"The AAVE Heist Plan – Stealthy Entries, Big Exit!"🔥🤑 THIEF TRADER’S AAVE/USDT HEIST PLAN 🚀💰
Asset: AAVE/USDT
Plan: BULLISH HEIST 🚀📈
🎯 ENTRY STRATEGY (THIEF STYLE):
✔ BREAKOUT ENTRY: 310.00 (Aggressive heist!)
✔ PULLBACK ENTRY: 290.00 (Safe & sneaky!)
💎 THIEF’S LAYERING STRATEGY (MULTIPLE LIMIT ORDERS):
🔹 295.00 (First dip grab!)
🔹 290.00 (Second loot!)
🔹 288.00 (Third steal!)
🔹 282.00 (Final robbery!)
(Add more layers if you're a PRO thief!)
⛔ STOP LOSS (THIEF’S SAFE ESCAPE):
📍 266.00 (OG Thief SL!)
⚠ LADIES & GENTLEMEN THIEVES: Adjust SL based on your risk & strategy!
🎯 TARGET: 350.00 (Time to escape with the loot!)
🔥 WHY THIS HEIST WILL WORK?
✅ BULLISH BREAKOUT – Price ready to explode!
✅ SMART PULLBACKS – Sneaky entries for max gains!
✅ LAYERED LIMITS – Lower average cost, bigger profits!
✅ THIEF’S RISK MANAGEMENT – SL protects your bag!
⚠ THIEF’S ALERT:
📉 NEWS CAN TRAP YOU! – Avoid trading during high-impact news!
🔒 USE TRAILING SL! – Lock profits & run before the cops (bears) come!
💥 BOOST THIS TRADE & JOIN THE HEIST!
👉 LIKE 👍 | 🔄 SHARE 🔗 | 💬 COMMENT 🚀
💖 SUPPORT THE THIEF SQUAD – MORE HEISTS COMING!
🤑 SEE YOU AT THE TARGET, FELLOW THIEVES! 🏴☠️💰
AVVE IS TIME TO BUYHello friends🙌
Given the good growth we had, now in a correction there is a good opportunity for the price to reach our high volume range or even lower and we can buy in steps and with risk and capital management.
🔥Follow us for more signals🔥
*Trade safely with us*

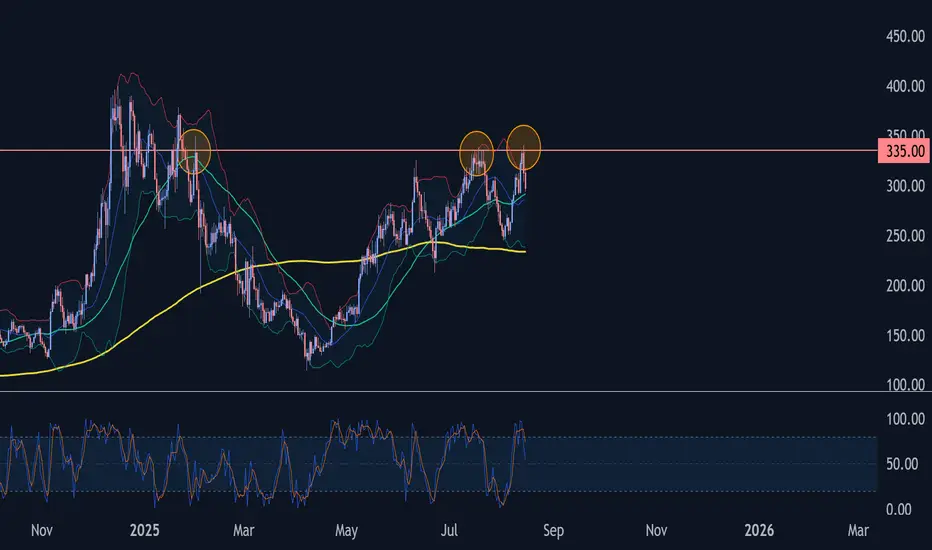
AAVE Wave Analysis – 15 August 2025- AAVE reversed from a strong resistance level 335.00
- Likely to fall to support level 280.00
AAVE cryptocurrency recently reversed from a strong resistance level 335.00 (which stopped all upward impulses from February), standing near the upper daily Bollinger Band.
The downward reversal from the resistance level 335.00 created the daily Japanese candlesticks reversal pattern Shooting Star –followed by Bearish Engulfing.
Given the strength of the resistance level 335.00 and the overbought daily Stochastic, AAVE cryptocurrency can be expected to fall to the next support level 280.00.
AAVE 8H – Pullback From Local HighsAAVE’s 8H chart shows rejection near $340, triggering a -1.66% pullback. Price remains above the long-term trendline from April, with the next key supports at $260 and the Fibonacci retracement zone between $227–$162. Stoch RSI sits mid-range, leaving room for momentum to shift either way. A rebound above $320 could re-target recent highs, while a breakdown risks testing the Fib support area.

aave short to new daily low $288.5Just hopped into aave short. Let's hope it prints as clear as it looks.
Sl: 302.39
Tp1: 291
Exit: 288.5
My entry is a bit aggressive without confirmation as I believe this is a nice area to short if its that the market actually wants to go down.

$AAVE / 1H Trade plan CRYPTOCAP:AAVE / 1H Trade plan 📊
Price just broke market structure after forming clean Equal Lows (EQL), signaling bearish intent.
Currently holding below the $296–$297 zone — my eyes are on a retracement into the $303 supply area for a potential short entry.
🛑 Bearish Plan:
🟢 Pullback Zone: $302–304
✅ Main Target: $269–272 📉
⛔ Invalidation: Above $313
If the 1H candle gives a strong close above $303, I won’t take the entry. But if it gets rejected, I’ll enter.
The game plan stays simple — execute the setup, ignore the noise. The chart is telling the story; we just need to follow the script.
CRYPTOCAP:AAVE

AAVE 4H – Trendline Bounce Into $300 Resistance, Break or RejectAAVE rallied sharply after defending its ascending trendline and key demand zone near $255. Price is now consolidating around the psychological $300 level, which has acted as resistance in the past. Stoch RSI is approaching oversold, hinting that buyers may attempt another push. A breakout above $310 could target $325+, while losing $290 risks a pullback toward the $260–$255 zone.
AAVEUSDTlet see what will happen my expactation it is. it is doing w and high. there is idm level and below of it exist fvg and order block when you check daily and weekly you will see the level which i mention. There is just one thing it they want to decide this pull back into deeply then right side one tool will be active and i expect that it will make new high for aave

aave extended pump to $310.8I hopped into this long position a while ago on aave. Time sensitive
Anticipating an impulsive push up to $310.8 before correction again
Sl: 298.96
Will be monitoring closely to potentially exit earlier as its quite high and can reverse soon

AAVE 1H – Trendline Intact, But Will 271 Support Hold?AAVE has been climbing steadily along its ascending trendline, breaking through key resistance levels and tapping 281+. Price is now pulling back toward the 271–272 support zone, which aligns with the first structural retest and sits just above EMA support.
If buyers defend this area, continuation toward the highs remains likely, keeping the uptrend structure intact. A deeper pullback into the 260 zone would still preserve the broader bullish outlook, but could delay momentum.
Key watchpoints:
– Holding 271–272 for immediate continuation
– Trendline + EMA confluence as strong support
– Stoch RSI reset could fuel next bullish leg

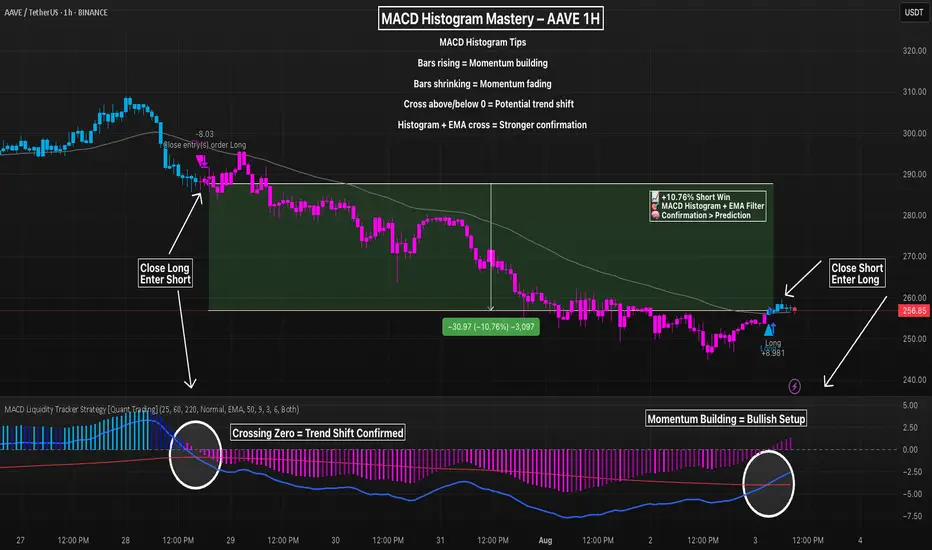
Master MACD Histogram + EMA Filter To Filter Out NoiseThe MACD histogram isn’t just noise — it’s a leading signal for momentum shifts when interpreted correctly. On this AAVE 1H chart, a textbook transition plays out:
– Rising histogram fades → crosses below 0
– EMA filter confirms trend shift
– Strategy flips short at the peak, locks in a +10.76% move
The recent long trigger occurs only after the histogram begins rising, crosses above zero, and price breaks back above the 50/9/3 EMA filter.
💡 Histogram Tips:
– Rising bars = bullish momentum building
– Shrinking bars = momentum weakening
– Crossing the zero line = potential trend reversal
– Best results come when histogram + EMAs align
⚙️ Settings Used:
MACD: 25 / 60 / 220
EMA Filter: 50 / 9 / 3
Entry Mode: Both (Histogram + Crossover Confluence)
📈 Use histogram transitions as an early signal — but always confirm with trend filters to avoid fakeouts.
AAVE Daily Chart – Key Buy Zone & Two ScenariosAAVE is currently moving within a well-defined ascending channel on the daily timeframe. The last major bullish leg began from the $120 support and surged nearly +180% to a local high near $330.
Now, after a 25% pullback, price is consolidating around the midline of the channel near $250. More importantly, there’s a strong bullish order block sitting between $220–230, making this a low-risk buy zone with a stop below the order block.
🔸 Scenario 1 (bullish preferred):
Price dips into the $220 OB zone, completes a possible ABC correction, and launches a new bullish leg targeting the channel top above $500.
🔸 Scenario 2 (bearish alternate):
If the $220 order block fails, deeper correction could follow toward the channel bottom near $135.
⏳ This is a critical area to watch for reaction – Smart Money will likely show its hand soon.
🔗 Analysis by CryptoPilot

Aave shor to $276 todayAAVE Short Setup (Limit Order) just filled
Entry: $288.89
SL: $293.15+
TP: $276.00
