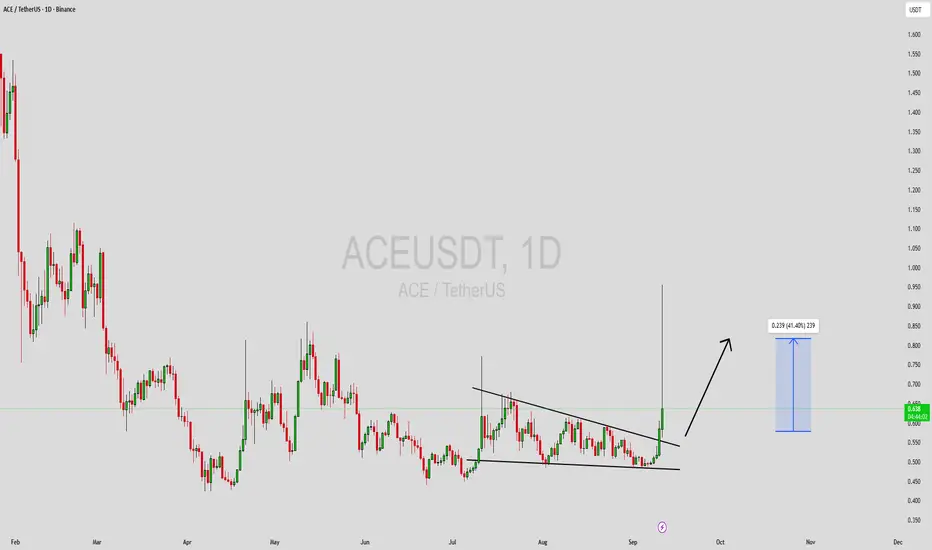
ACEUSDT Forming Falling WedgeACEUSDT is currently trading within a falling wedge pattern, a bullish technical setup that often precedes a reversal to the upside. This pattern forms as the price consolidates with lower highs and lower lows, but with diminishing bearish pressure. The narrowing price action signals that sellers ar
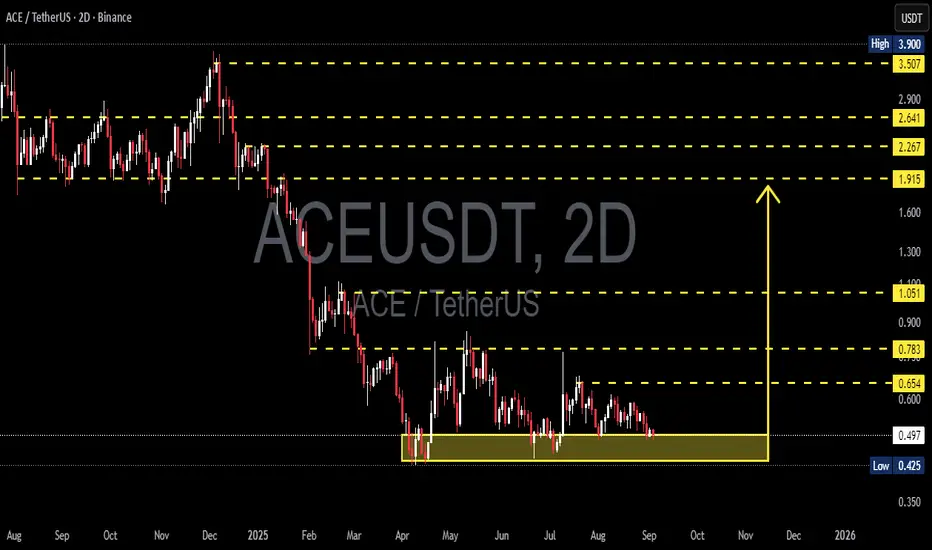
ACE/USDT – Between Critical Support and Potential Rebound🔎 Overview
ACE/USDT is currently sitting at a make-or-break zone. After a prolonged decline from the $3.9 peak, the price has been consolidating for months inside the demand zone $0.425–$0.496.
This area has been tested multiple times since April 2025, making it a key historical support. The mid-t
ACEUSDT Forming Falling WedgeACEUSDT is currently trading within a falling wedge pattern, a bullish technical setup that often precedes a reversal to the upside. This pattern forms as the price consolidates with lower highs and lower lows, but with diminishing bearish pressure. The narrowing price action signals that sellers ar
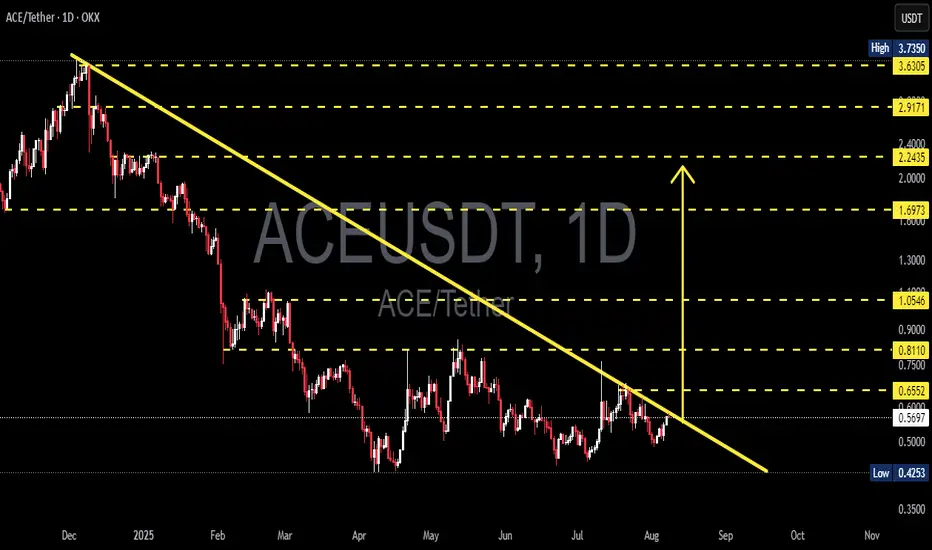
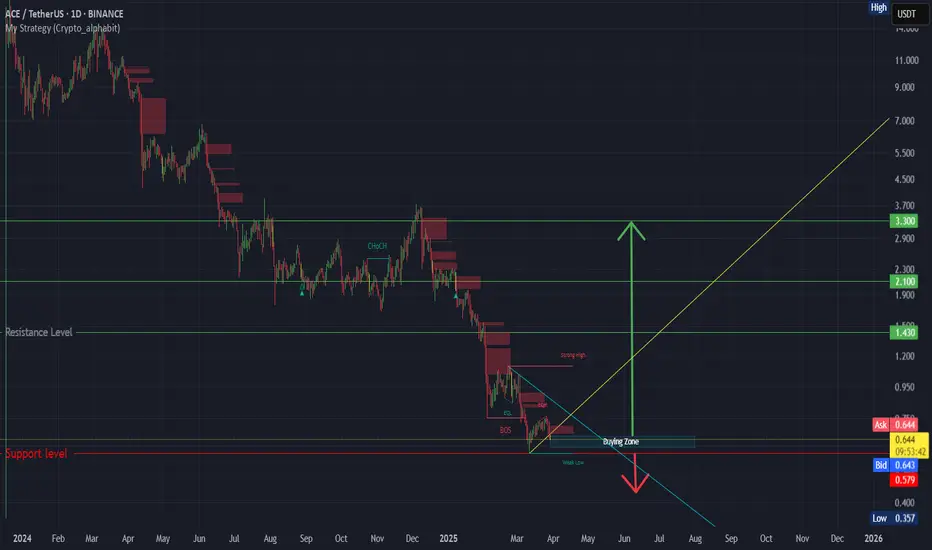
ACE/USDT Testing Long-Term Downtrend – Will It Break Out?Chart Overview:
The ACE/USDT pair on the 1D (Daily) timeframe is currently in a prolonged downtrend that has persisted since early 2025. The price has consistently formed lower highs, and it's been contained under a well-respected descending trendline (yellow line).
Currently, ACE is approaching a
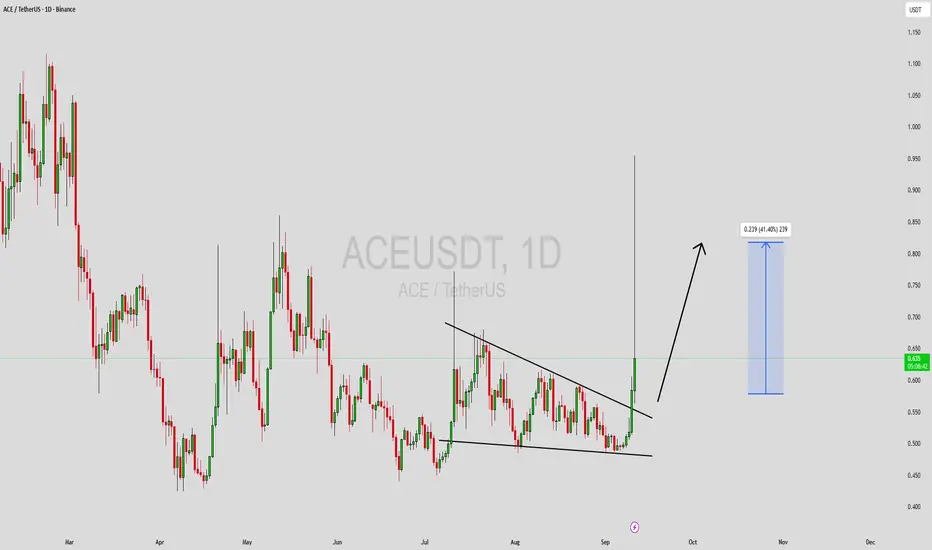
ACEUSDT Breakout and Retested ready to go longACEUSDT was trading within a wedge-like channel pattern, but has now broken above the resistance, retested the breakout level as support, and is showing signs of a potential move for a new long-term uptrend

ACEUSDT 1D#ACE has broken above the descending triangle and the EMA100 on the daily chart. If the price holds above the breakout level, the potential targets are:
🎯 $0.818
🎯 $0.939
🎯 $1.060
🎯 $1.233
🎯 $1.453
⚠️ Always use a tight stop-loss and practice proper risk management.

ACE/USDT – Breaking Out of the Falling Wedge? Potential Reversal📝 Technical Analysis Overview:
The ACE/USDT pair on the daily timeframe (1D – Binance) is showing signs of a potential breakout from a long-standing falling wedge pattern, suggesting a possible trend reversal to the upside.
🔍 Key Technical Highlights:
1. Falling Wedge Pattern:
A clearly defined

ACEUSDT UPDATEACE/USDT Technical Setup
Pattern: Falling Wedge Breakout
Current Price: $0.635
Target Price: $1.714
Target % Gain: 250.34%
Technical Analysis: ACE has broken out of a long-term falling wedge pattern on the 1D chart with strong bullish momentum. Volume has increased significantly, confirming the br

ACEUSDT 1D AnalysisACE ~ 1D Analysis
#ACE is attempting to break through this resistance line. A full-body candle close above this resistance line will confirm a continued bullish trend with a minimum target of 10%+.

ACE (SPOT - INVEST )BINANCE:ACEUSDT
ACE / USDT
(4H + 1D) time frames
analysis tools
____________
SMC
FVG
Trend lines
Fibonacci
Support & resistance
MACD Cross
EMA Cross
______________________________________________________________
Golden Advices.
********************
* Please calculate your losses before any ent
See all ideas
Summarizing what the indicators are suggesting.
Oscillators
Neutral
SellBuy
Strong sellStrong buy
Strong sellSellNeutralBuyStrong buy
Oscillators
Neutral
SellBuy
Strong sellStrong buy
Strong sellSellNeutralBuyStrong buy
Summary
Neutral
SellBuy
Strong sellStrong buy
Strong sellSellNeutralBuyStrong buy
Summary
Neutral
SellBuy
Strong sellStrong buy
Strong sellSellNeutralBuyStrong buy
Summary
Neutral
SellBuy
Strong sellStrong buy
Strong sellSellNeutralBuyStrong buy
Moving Averages
Neutral
SellBuy
Strong sellStrong buy
Strong sellSellNeutralBuyStrong buy
Moving Averages
Neutral
SellBuy
Strong sellStrong buy
Strong sellSellNeutralBuyStrong buy
Displays a symbol's price movements over previous years to identify recurring trends.