$ACH is Going Parabolic Soon! ALCHEMY PAYFWB:ACH repeating history again. It had a break of structure in July and has consolidated since.
From these lows we will easily break out towards $0.06 (300% gains).
This will probably be followed by a break of the multi-year trendline towards $1+ depending on recognition and hype

ACH - LongWeekly Chart Pattern: Ascending Triangle
An ascending triangle does not guarantee that the stock will enter bearish territory, it can go either way.
ACH is a bit lagging coin comparing to other mainstream cryptos. I have played it twice to the big resistance at ~0.058
PT1: ~.058
PT2: After retes

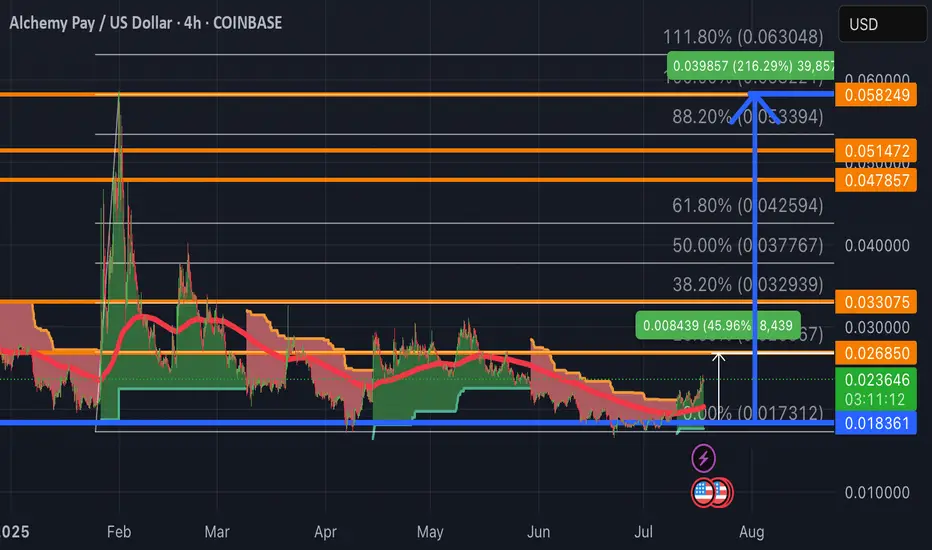
ACH - Bullish confirmation on a macro swing playACH is setup nicely for a bullish swing. Apologies for the delay in posting. Was waiting for a bullish confirmation first. My entry is $0.018361.
I plotted 5 targets for us.
SuperTrend on 4 Hour TF signaling green. As you can see the reliability of previous SuperTrend flips to green.
Alchemy Pay
ACH incoming reversal?ACH had strong impulse and correction back to golden pocket (fibb 0.618 range). From there it started ranging in ascending triangle pattern. We have seen similar pattern on XRP back in 2014-2017 period which resulted in breakout of triangle and push to new ATH.
As ACH is oversold and sitting at RSI

ACH back to bearmarket lows?After deviating his range highs 2 times without being able to stay above, ACH has the risk to visit his bearmarket lows.

ACHUSD My prediction is $1.0-1.50 this bull runI made this chart roughly 3 years ago and I took my time doing research on ach and on historical runs on alt coins and BTC and came to the conclusion we should run up to $1.0 but this is just a guess. I have been holding ACH for 3 years now and I don't plan on selling grill I see $7.00 plus

ALCHEMY pay to 10 CentsNice set up on #ACH
series of higher lows
periods of deep corrections as S coins are prone to do
YET this is the type of setup you should be looking for in your Altcoins
I believe accumulating this S coin over they next few weeks could give some nice returns.
Stop dreaming about 50 and 100X's

$ACH/USDT AnalysisFWB:ACH is testing the red resistance zone.
🎯 Targets if breakout occurs:
1️⃣ First Target: Green line level
2️⃣ Second Target: Blue line level


Strong reversalDescending Channel Breakout: ACH has smashed through a long-term descending trend line, signaling a strong reversal in play. 📉➡️📈
Higher Highs: Consecutive HH formations are fueling bullish momentum—classic trend reversal confirmation! 🔄
Target Resistance: Eyes on the key Fib zone at $0.03765 for th

See all ideas
Summarizing what the indicators are suggesting.
Oscillators
Neutral
SellBuy
Strong sellStrong buy
Strong sellSellNeutralBuyStrong buy
Oscillators
Neutral
SellBuy
Strong sellStrong buy
Strong sellSellNeutralBuyStrong buy
Summary
Neutral
SellBuy
Strong sellStrong buy
Strong sellSellNeutralBuyStrong buy
Summary
Neutral
SellBuy
Strong sellStrong buy
Strong sellSellNeutralBuyStrong buy
Summary
Neutral
SellBuy
Strong sellStrong buy
Strong sellSellNeutralBuyStrong buy
Moving Averages
Neutral
SellBuy
Strong sellStrong buy
Strong sellSellNeutralBuyStrong buy
Moving Averages
Neutral
SellBuy
Strong sellStrong buy
Strong sellSellNeutralBuyStrong buy
Displays a symbol's price movements over previous years to identify recurring trends.