Market insights

Us100 correction on progress Super low risk, as we already dipped enough. I can’t say it will work for sure, but it makes sense

$BTC - $DXY -$SPX - $NDX - $GOLD 11/12/2025 forecastWhile the past days saw a fairly moderate negative energy across an index at a time, things will now complicate. As we're looking for both CRYPTOCAP:BTC , TVC:GOLD and NASDAQ:NDX (the latter still waiting to properly discount the incoming negative days) to witness huge peaks of negative energy, at 3:49 am UTC and particularly at 7:50 am UTC being the hardest one, volatility will further increase as we get towards 12/12/2025.

US100 SELL📊 US100 Elliott Wave Setup & Historical Context
This chart outlines a potential (A)-(B)-(C) corrective wave within a long-term bullish channel on the US100 (Nasdaq 100). The current price action suggests wave (B) may have peaked, and wave (C) could now be unfolding toward key Fibonacci zones—100%, 161.8%, and 200%—which historically act as strong support during corrections.
🔍 Why a 30% Drop Isn’t Unusual
Corrections of 20–35% are not only common in the Nasdaq 100—they're part of its growth DNA.

NAS100 CeillingSupport levels from pivot points and multiple moving averages create a technical base that reduces downside risk in the short term.
Volume remains steady, which confirms the reliability of the ongoing trend.
These combined technical factors typically precede price appreciation in the Nasdaq 100 , suggesting the index will likely continue to Declines hortly based on trend-following and momentum-based trading strategies with limited immediate overbought risk.

NAS100 Trade Set Up Dec 15 2025Price has broke structure to the downside on friday making a LL and is currently trading at a 4h FVG with a 4h supply above and has already swept BSL and London highs so i will look for internal 1m-5m IFVG/CISD to sell down to Asia low and PDL

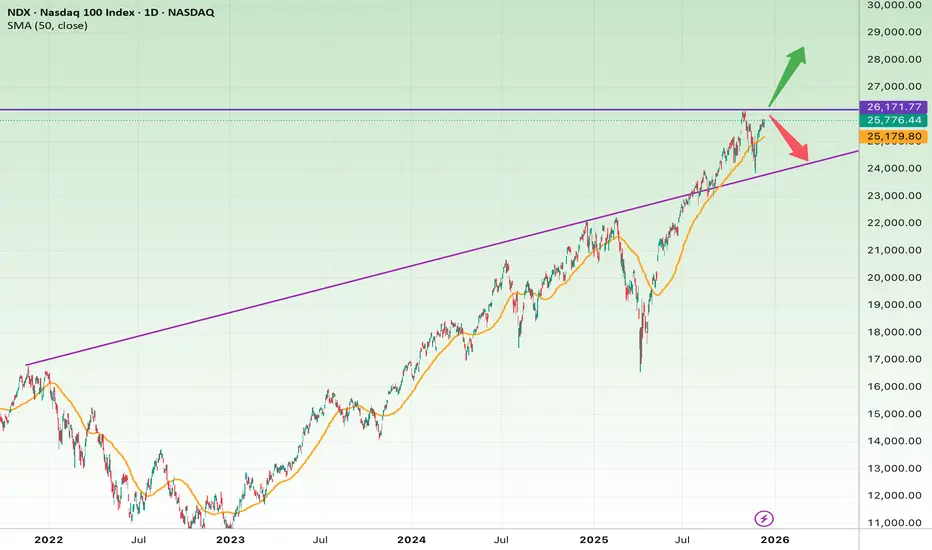
Nasdaq at a Make-or-Break Level: Breakout or Breakdown?Price is trapped between a major historical resistance and a long-term ascending trendline — a critical decision zone.
Bullish Scenario
If price breaks and holds above 26,300:
• Target 1: 27,500
• Target 2: 28,500–29,000
• Stop-loss: Close back below 25,800
Bearish Scenario
If price loses 25,200, and especially 24,800 (trendline):
• Target 1: 23,500
• Target 2: 21,800
• Stop-loss: Reclaiming 25,500
Short Fundamental View
• Tech giants continue to drive market momentum.
• Valuations are elevated, leaving room for correction.
• Fed policy and macro data will heavily influence future price action.
NAS100 H1 | Bearish Reaction Off Pullback ResistanceMomentum: Bearish
Price is currently below the ichimoku cloud.
Sell entry: 25,147
- Strong pullback resistance
- 50% Fib retracement
- 100% Fib projection
Stop Loss: 25,372.80
- Overlap resistance
Take Profit: 24,913.79
- Overlap support
High Risk Investment Warning
Stratos Markets Limited (tradu.com/uk ), Stratos Europe Ltd (tradu.com/eu ):
CFDs are complex instruments and come with a high risk of losing money rapidly due to leverage. 70% of retail investor accounts lose money when trading CFDs with this provider. You should consider whether you understand how CFDs work and whether you can afford to take the high risk of losing your money.
Stratos Global LLC (tradu.com/en ): Losses can exceed deposits.
Please be advised that the information presented on TradingView is provided to Tradu (‘Company’, ‘we’) by a third-party provider (‘TFA Global Pte Ltd’). Please be reminded that you are solely responsible for the trading decisions on your account. Any information and/or content is intended entirely for research, educational and informational purposes only and does not constitute investment or consultation advice or investment strategy. The information is not tailored to the investment needs of any specific person and therefore does not involve a consideration of any of the investment objectives, financial situation or needs of any viewer that may receive it. Past performance is not a reliable indicator of future results. Actual results may differ materially from those anticipated in forward-looking or past performance statements. We assume no liability as to the accuracy or completeness of any of the information and/or content provided herein and the Company cannot be held responsible for any omission, mistake nor for any loss or damage including without limitation to any loss of profit which may arise from reliance on any information supplied by TFA Global Pte Ltd.

NAS100 M30 | Bearish Reaction Off Pullback ResistanceMomentum: Bearish
Price is currently below the ichimoku cloud.
Sell entry: 25,514.71
- Pullback resistance
- 78.6% Fib retracement
Stop Loss: 25,686.06
- Swing high resistance
Take Profit: 25,271.77
- Pullback support
High Risk Investment Warning
Stratos Markets Limited (tradu.com/uk ), Stratos Europe Ltd (tradu.com/eu ):
CFDs are complex instruments and come with a high risk of losing money rapidly due to leverage. 70% of retail investor accounts lose money when trading CFDs with this provider. You should consider whether you understand how CFDs work and whether you can afford to take the high risk of losing your money.
Stratos Global LLC (tradu.com/en ): Losses can exceed deposits.
Please be advised that the information presented on TradingView is provided to Tradu (‘Company’, ‘we’) by a third-party provider (‘TFA Global Pte Ltd’). Please be reminded that you are solely responsible for the trading decisions on your account. Any information and/or content is intended entirely for research, educational and informational purposes only and does not constitute investment or consultation advice or investment strategy. The information is not tailored to the investment needs of any specific person and therefore does not involve a consideration of any of the investment objectives, financial situation or needs of any viewer that may receive it. Past performance is not a reliable indicator of future results. Actual results may differ materially from those anticipated in forward-looking or past performance statements. We assume no liability as to the accuracy or completeness of any of the information and/or content provided herein and the Company cannot be held responsible for any omission, mistake nor for any loss or damage including without limitation to any loss of profit which may arise from reliance on any information supplied by TFA Global Pte Ltd.

US100 – Bullish Reversal Setup-H4: Turning bullish with a new high at 25,667.
Pullback: Formed a lower high, now H1 shifting bullish again.
Plan: Looking for buys above 25,542, SL below last H1 LH.
Adjustment: If another H1 LH forms and breaks upward, trail SL for tighter risk.
-Fundamental: Shutdown-end hopes , supporting the bullish scenario.

NAS100 Bearish SignsNasdaq is also looking ready to continue to correct to the downside. Price is in resistance and targets are in the open gap zone.

NAS100 Trade Set UP Dec 16 2025Price swept PDL and Asia lows already and has inverted a 1h FVG so i will wait for internal 1m-5m bullish structure to target PDH

Next Nas100 GainThese combined technical factors typically precede price appreciation in the Nasdaq 100 , suggesting the index will likely continue to rise shortly based on trend-following and momentum-based trading strategies with limited immediate overbought risk

Wave 5 in Play: NASDAQ Aiming for New ATHs
The structure PEPPERSTONE:NAS100 OANDA:NAS100USD NASDAQ:NDX remains impulsive. We are currently in wave 5, where waves 1–2 have already formed, and wave 2 is close to completion.
After wave 2 finishes, I expect a continuation higher with a breakout to new highs.
As long as price stays above the POC and the 20-week moving average, the bullish scenario remains in play.
Targets:
26,300
28,000
Bias stays long until key levels are broken.

Nas100 LONG SETUP Price continues to trade within the uptrend amid a week full of data. Mild consolidation is expected above 25.217 before we can go up

US100: Bullish Continuation is Highly Probable! Here is Why:
The recent price action on the US100 pair was keeping me on the fence, however, my bias is slowly but surely changing into the bullish one and I think we will see the price go up.
Disclosure: I am part of Trade Nation's Influencer program and receive a monthly fee for using their TradingView charts in my analysis.
❤️ Please, support our work with like & comment! ❤️


NAS100 – Technical & Fundamental Outlook (Short)Technical: NAS100 is trading sideways to bearish on H1, clearly rejecting the 26,000–26,200 supply zone. As long as price remains below this area, a corrective bias is favored, with key support around 25,000–24,800. Upside moves look weak.
Fundamental: The index remains pressured by higher-for-longer rate expectations, USD strength, and rotation out of tech. Markets stay cautious ahead of upcoming macro data and Fed guidance.

US100 trade ideaUS100 in bullish trend, After bull back and fib 0.38 level retract back toward its bullish direction.

US NAS 100DO YOU KNOW WHATS BEHIND THIS OR OTHER IDEAS?? in bio..
Preferably suitable for scalping and accurate as long as you watch carefully the price action with the drawn areas.
With your likes and comments, you give me enough energy to provide the best analysis on an ongoing basis.
And if you needed any analysis that was not on the page, you can ask me with a comment or a personal message.
Enjoy Trading ;)

Stop Loss Killers Completed – Bullish Expansion Ahead?After three consecutive Stop-Loss Killers (SLK1, SLK2, SLK3), the market appears to have flushed out remaining buyers and collected liquidity below key lows. This structure often signals the end of a manipulation phase and the beginning of a potential bullish expansion.
With the FOMC rate-cut announcement expected this evening, the market now has both structural and fundamental conditions for an upside move. If the sweep was indeed the final liquidity grab, a rally toward the upper target zone may follow next.

NESDAQ100 - Distribution at the topNESDAQ100 is possibly distributing at the top, with potential HnS pattern in the making, breaking below 24100 will open the door to 22000.
