NSDQ100 renewed cautionThe Nasdaq-100 saw mixed but resilient performance as the index worked through a heavy tech news cycle:
Tech drag early in the session:
The index opened weak after a sharp tech selloff, led by Oracle (-10.83%), which plunged on missed revenue and higher-than-expected capex, stoking concerns about whether AI-related spending is beginning to show fatigue.
Broader tech sentiment remained cautious with Broadcom slipping after underwhelming AI-related expectations.
Recovery driven by macro tailwinds:
Despite early weakness, the broader US market mood improved, helping the Nasdaq-100 stabilise as investors continued to digest the Fed’s rate cut and easing inflation pressures.
2-yr inflation swaps hit a 13-month low, reinforcing the view that the Fed’s easing cycle is intact—supportive for duration-sensitive tech names.
Global backdrop supportive:
European equities rallied strongly as markets pared back the probability of an ECB hike next year, adding to the global risk-on tone.
Global indices moved closer to record highs on confidence that monetary easing will continue through 2025.
Stock-specific movers with Nasdaq implications:
UBS reached a 17-year high (banking sentiment supportive but not directly Nasdaq-linked).
Lululemon surged pre-market on CEO departure news—boosting retail sentiment within the consumer discretionary components of tech-heavy indices.
Dollar outlook: Strategists at Deutsche Bank and Goldman see the USD weakening in 2025 as the Fed cuts further. A softer dollar typically supports large-cap growth and tech.
Geopolitical noise:
Comments from Donald Trump about guaranteeing Ukraine’s security added volatility in the defense complex globally, but impacts on Nasdaq-100 were indirect and limited.
Takeaway for Nasdaq-100 traders
Early tech weakness (Oracle, Broadcom) signalled renewed caution around AI-driven capex trends.
However, macro easing tailwinds dominated, allowing the index to recover from the weak open.
The path of least resistance remains upward as long as the Fed easing narrative holds, though AI-spending scrutiny may introduce pockets of volatility within the megacap tech complex.
Market insights


25.12.12 Nasdaq AnalysisWelcome to Acid Trade.
Hello everyone, as of December 12th, 2025, I will be analyzing the Nasdaq chart today.
This is Acid.
15 Minute Chart Analysis
Let’s first review yesterday’s results.
In the previous video, I mentioned that a long position should be taken once the resistance trendline and the 25,566 level were broken.
That breakout occurred at the white circle, and from that entry, the market climbed approximately 152 points, resulting in a $3,000 profit.
For the short-side opportunity, the entry occurred when the rising trendline after the market opened was broken.
This sell signal appeared at the blue circle and led to a 186-point decline, giving a $3,720 profit.
Therefore, the total profit for December 11th was $6,720.
Daily Chart Analysis
Looking at yesterday’s candle (December 11), the price tapped the daily 20-EMA and bounced back, leaving a long lower wick.
Nasdaq is currently trading inside a previous volume zone, with the downside open toward 25,120 and potentially 24,945 if momentum continues lower.
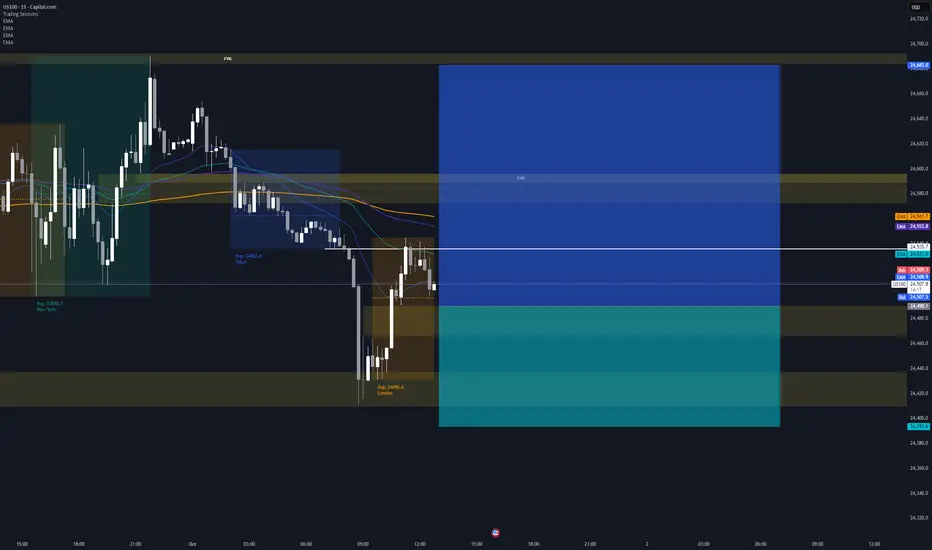
Today’s Strategy
Today, Nasdaq temporarily broke below the short-term rising trendline, but this happened due to a pre-market gap-down, creating the yellow-box gap zone.
Because the sell-off was not strong and price action remains sideways, the market is effectively consolidating.
At the moment, Nasdaq is forming a larger box range:
Top: 25,879 forming a double top
Bottom: 25,400 forming a double bottom
A breakout from either side will likely determine the next major trend direction.
Today’s trading strategy should focus on identifying that breakout level and reacting once confirmation appears.
Conclusion
Nasdaq is moving within a key range between 25,879 and 25,400, and a breakout will define the next major trend direction.
Watch for a confirmed break with supporting volume before taking a position.
Today’s session is all about timing the breakout and reacting quickly.

NAS100 Trade Set Up Dec 10 2025Price is testing 1h FVG so i i see internal 1m-5m IFVG/CISD from here i will target BSL/London highs

Nqz & nas100Price has a potential of slamming lower. Overall it will be good to see price pushing higher tapping into premium arrays and eventually go lower from next week. I will keep an eye on the previous daily high

NasdaqNASDAQ bounced from a strong demand zone, showing bullish momentum, as buyers step in, with key resistance levels ahead to watch for potential continuation.

$BTC - $DXY -$SPX - $NDX - $GOLD 10/12/2025 forecastAs explained,only NASDAQ:NDX should see a corrective day which got skipped on the previous day. Rest is neutral biased. Likely that CRYPTOCAP:BTC mimicks the NASDAQ:NDX price action.

Nasdaq vs Silver RatioNasdaq vs Silver Ratio (Monthly Chart)
The Capital is rotating from riskier markets to hard assets
* The Nasdaq vs Silver Ratio is screaming the above statement strongly
* NASDAQ is in a bear trajectory against silver & expected to further fall 65% priced in SILVER
A further downfall in the ratio (Nasdaq vs Silver), indicating 3 possibilities:
1. Either Silver will rise further, with higher strength than the US stock markets
2. The US stock market will fall or crash
3. Both the above situations simultaneously

NQ is bullish.Let's see if NASDAQ is bullish. Interest rate decision is today (3pm NYT) so NASDAQ is particularly volatile today. If price can break and stay above 25867 then probably it will continue bullish. The volatility after the announcement might add fuel for it to push up further. It's a risk. Happy trading.

NQ 100 Direction and indicationsWaiting for another indication or reversal from NQ.
Key Levels need to be broken or rejected to tell direction. Generally it is looking like NQ is bearish. Just need to wait for the right time to enter. No trading NQ for the rest of the week due to holidays and lack of Gov data.

Chasing the last train: how late entries ruin good trendsChasing the last train: how late entries ruin good trends
The picture is familiar.
The asset has already made a strong move, candles line up in one direction, chats are full of profit screenshots.
Inside there is only one thought: "I am late".
The buy or sell button is pressed not from a plan, but from fear of missing out.
This is how a classic "last train" entry is born.
This text breaks down how to spot that moment and how to stop turning each impulse into an expensive ticket without a seat.
How the last train looks on a chart
This situation has clear signs.
Long sequence of candles in one direction with no healthy pullback.
Acceleration of price and volatility compared to previous swings.
Entry happens closer to a local high or low than to any level.
Stop is placed "somewhere below" or moved again and again.
The mind focuses on other people’s profit, not on the original plan.
In that state the trader reacts to what already happened instead of trading a prepared setup.
Why chasing the move hurts the account
The problem is not just "bad luck".
Poor risk-reward .
Entry sits near an extreme. Upside or downside left in the move is small, while a normal stop needs wide distance. In response there is a temptation to push the stop further just to stay in.
Large players often exit there .
For them the trend started earlier. Where retail opens first positions, they scale out or close a part of the move.
Strategy statistics get distorted .
A system can work well when entries come from levels and follow a plan. Once late emotional trades appear in the mix, the math changes even if the historical chart still looks nice.
How to notice that the hand reaches for the last train
Knowing your own triggers helps.
This symbol was not in the morning watchlist, attention appeared only after a sharp spike.
The decision comes from news or chat messages, not from calm chart work.
There is no clear invalidation level, the stop sits "somewhere here".
Many timeframes blink at once, the view jumps from 1 minute to 15 minutes and back.
Inner talk sounds like "everyone is already in, I am the only one outside".
If at least two of these points match, the trade is most likely not part of the core system.
Simple rules against FOMO
Work goes not with the emotion itself, but with the frame around trades.
No plan, no trade .
A position opens only if the scenario existed before the spike. Fresh "brilliant" ideas during the impulse are placed into the journal, not into the order book.
Move distance limit .
Decide in advance after what percentage move from a key zone the setup becomes invalid.
For example: "if price travels more than 3–4 percent away from the level without a retest, the scenario is cancelled, next entry only after a pause and new base".
Trade from zones, not from the middle of the impulse .
Plans are built around areas where a decision makes sense, not around the fastest part of a candle.
Time filter .
After a sharp move, add a small pause.
Five to fifteen minutes with no new orders, only observation and notes.
What to do when the move has already gone
The smart choice is not "grab at least something".
Better to:
save a screenshot of the move;
mark where the trend started to speed up;
write down whether this symbol was in the plan and why;
prepare a setup for a pullback or the next phase, where entry comes from a level, not from the middle of noise.
Then the missed move turns into material for the system instead of three revenge trades in a row.
A short checklist before pressing the button
Was this symbol in the plan before the run started.
Do I see the exact point where the idea breaks and is the stop parked there.
Is the loss size acceptable if this trade repeats many times.
Can I repeat the same entry one hundred times with the same rules.
If any line sounds weak, skipping this "train" often saves both money and nerves.
The market will send new ones. The task is not to jump into every car, but to board the ones that match the timetable of the trading plan.

NQ TOWARDS ALL TIME HIGHS Technical Analysis (Bullish Bias With Key Levels)
Nasdaq-100 futures (NQ) continue to show a bullish structure as long as price holds above the 25539 support zone. The market has been forming higher lows on the intraday timeframes, signaling continued buyer interest near liquidity pockets. Your bullish target at 25822 aligns with the current momentum, as price has been respecting trendline support and rotating upward from demand zones created during previous New York sessions. A clean break and hold above 25822 could open the door for an extension into the next liquidity cluster, allowing buyers to push toward psychological levels above 25900.
However, despite the bullish bias, the 25539 support remains the critical line in the sand. If this level fails, it would signal that the market has accepted lower pricing and that sellers have absorbed buy-side liquidity. A decisive break below 25539—especially accompanied by high volume—would likely trigger short-term momentum shorts targeting the imbalance zones created during the last leg up. This shift would invalidate the bullish structure and potentially initiate a deeper retracement toward the previous week’s value area. Until then, bulls remain in control, but the reaction at 25539 will determine whether the trend continues or flips.
Fundamental Analysis
From a macro perspective, NQ remains supported by strong fundamentals driven primarily by the performance of large-cap tech companies, resilient corporate earnings, and ongoing investor expectations for future rate cuts. The Federal Reserve’s tone has recently shifted more dovish, indicating that although inflation remains sticky, monetary easing is still on the table for the upcoming quarters. This keeps growth sectors—especially technology—attractive, as lower interest rates improve future earnings projections and strengthen valuation models for high-beta stocks.
At the same time, markets remain sensitive to macroeconomic data releases such as CPI, PCE, and labor-market readings. Any upside surprise in inflation or stronger-than-expected employment data could temporarily pressure NQ, as it may delay the Fed’s easing timeline. Additionally, geopolitical tensions and shifts in semiconductor policy remain potential sources of volatility. Overall, while short-term fluctuations are expected, the fundamental backdrop continues to favor higher prices for Nasdaq-focused assets, supporting your bullish outlook until key support levels fail.

Will NAS100 Sustain Its Bullish Momentum After the Pullback?NAS100 🚀 Bullish Swing Setup | SuperTrend Pullback & Layered Entry Strategy
🎯 TRADE IDEA: NAS100 (US100) BULLISH SWING
Capitalize on a structured pullback in the NASDAQ 100! This plan leverages a proven indicator confluence for a high-probability long opportunity.
📊 ANALYSIS & CONFIRMATION:
Trend: Primary Bullish Trend is intact. ✅
Trigger: Price is pulling back into a demand zone, offering a favorable risk-to-reward entry.
Indicator: The SuperTrend ATR Line is acting as dynamic support on the 4H/Daily timeframe. A bounce from this level confirms our bullish bias.
⚡ STRATEGY: "THE THIEF" LAYERED ENTRY
This method uses multiple limit orders to average into a position, perfect for volatile markets like the NASDAQ.
Entry Zone: Look for entries between 25,200 - 25,600
Layer Example:
🟢 Limit Order 1: 25,600
🟢 Limit Order 2: 25,400
🟢 Limit Order 3: 25,200
👉 You can adjust the number of layers and prices based on your capital and risk appetite.
❗ RISK MANAGEMENT:
Stop Loss (SL): A decisive break below 24,800 would invalidate the bullish structure.
⚠️ IMPORTANT NOTE: This is MY protective stop. Dear Thief OG's 👑, you MUST adjust your position size and SL based on your personal risk management strategy. Protect your capital first!
🎯 PROFIT TARGETS:
Primary Target: 25,600 (Initial resistance & profit-taking zone).
Key Reasoning: We anticipate a reaction here due to:
Moving Average resistance.
Potential overbought conditions on lower timeframes.
A "trap" for late buyers.
👉 Smart Move: Consider taking partial profits at 25,600 and trailing your stop for the remainder. Escape the trap with your profits! 💰
⚠️ REMINDER: Dear Thief OG's 👑, your Take Profit (TP) is your own decision. Secure gains based on your trading plan and market behavior.
🔍 RELATED ASSETS & MARKET CORRELATION:
Watching these related instruments can provide confirmation and a broader market view.
TVC:DXY (U.S. Dollar Index): 🟡 NEGATIVE CORRELATION
A weakening Dollar ( TVC:DXY DOWN) is generally bullish for Nasdaq. If the Dollar is falling, it adds confidence to this long thesis.
USTECH (CFD on Nasdaq 100): 🟢 DIRECT CORRELATION
Moves in sync with NAS100. Perfect for cross-verifying price action and volume.
NASDAQ:AAPL , NASDAQ:MSFT , NASDAQ:TSLA (Mega-Caps): 🟢 HIGH IMPACT
These heavily weighted Nasdaq components drive the index. Bullish momentum in these stocks supports a rising NAS100.
FOREXCOM:SPX500 (S&P 500): 🟢 POSITIVE CORRELATION
A strong S&P 500 often lifts the Nasdaq. Monitor for overall U.S. market strength.
💬 Let me know your thoughts in the comments!
What's your entry strategy for the NAS100 this week?
#NAS100 #US100 #TradingView #SwingTrading #Bullish #SuperTrend #TradingStrategy #IndexTrading #LayeredEntry #ThiefStrategy

Bullish bias on NAS100This is what I think might happen over the course of next week. I identified a hidden OB at the 25200 area that might get mitigated before it produces the next leg up. Price might break through the OB and tap into the low volume node. The overall trend remains bullish and there is no reason to assume a reversal is incoming.
The formation of a HL would be very welcome before a potential christmas rally starts.
For now, alerts are set

NAS Short/Long 05/12/2025Short DC1 on the M15 after tapping M15 break level, then rejecting back to H1 hold.
Closed the position once realised price was rejecting off M15 hold.
Long once above the daily open upon printing of AS4 on the M1

NSDQ100 positive lead from futures and improving risk sentimentUS markets saw a modest risk-on tone yesterday as stronger-than-expected labour data pushed investors to price in fewer Fed rate cuts for next year. That supported equities, with the S&P 500 extending its winning streak, and futures are pointing to further upside this morning. This provides a supportive near-term backdrop for the Nasdaq 100 into today’s session.
However, the hawkish repricing in rates is a growing headwind for tech. The 10-year Treasury yield rose to a two-week high of 4.10%, and global bond yields continued to climb, amplified by renewed expectations of a Bank of Japan rate hike. Rising long-end yields typically pressure rate-sensitive growth stocks, which could cap upside in the Nasdaq despite positive futures.
The drop in jobless claims to 191k reinforces the view that the US labour market remains resilient, supporting risk appetite but also reducing the urgency for Fed easing. That combination often favours cyclicals over long-duration tech when yields are rising.
On the corporate side, Netflix is in focus following reports of exclusive talks to acquire Warner Bros. Discovery’s studios and HBO Max. This could drive sector-specific volatility across streaming and media names, with potential spillovers into Nasdaq sentiment.
Broader risk sentiment remains constructive, with the VIX slipping to a two-month low, and the continued rally in US transport stocks signalling confidence in economic momentum. That supports equities overall, but the Nasdaq’s direction today is likely to hinge on bond yields:
Stable or lower yields would allow tech to participate in the broader rally.
Further yield upside risks triggering profit-taking in mega-cap growth.
Bottom line: The Nasdaq 100 opens with a positive lead from futures and improving risk sentiment, but rising global bond yields remain the key short-term risk to sustained upside. Streaming and large-cap tech could see elevated volatility today.
This communication is for informational purposes only and should not be viewed as any form of recommendation as to a particular course of action or as investment advice. It is not intended as an offer or solicitation for the purchase or sale of any financial instrument or as an official confirmation of any transaction. Opinions, estimates and assumptions expressed herein are made as of the date of this communication and are subject to change without notice. This communication has been prepared based upon information, including market prices, data and other information, believed to be reliable; however, Trade Nation does not warrant its completeness or accuracy. All market prices and market data contained in or attached to this communication are indicative and subject to change without notice.

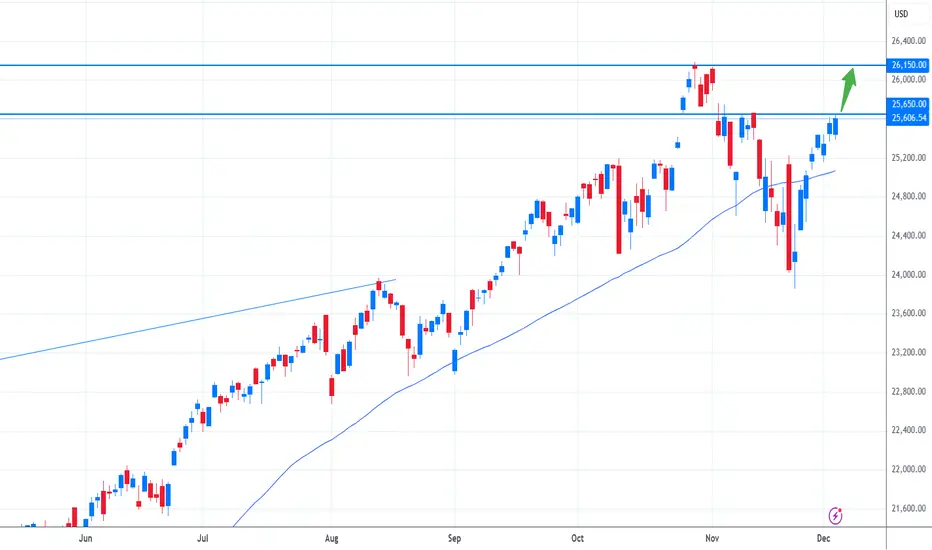
Buy Tech100 Futures for a swing long. Nasdaq is on the way UP and here is a pullback where you can enter for a 1:3 RR. I believe Tech100 is gunning for 26000, so I will be sitting on this position for the whole next week (hopefully). Probably adding to it if it moves in my favor with a clear bull signal.
NAS100 Trade Set Up Dec 5 2025Price has shifted to bearish structure and is targeting SSL and PDL but first i will wait for more internal structure on the 15m-5m to continue lower

Nasdaq shorts pendingOkay okay 👌🏽
$25k FLAT is what she’s hunting.
In a crucial handle as we speak and I am personally looking for some work into $26,970 early next week before bleeding this thing off into target..
Nothing more to say, keep it simple. Same goes for us30, she’s in the same boat for shorts 🩳 …
Tab up 650-690 and hopefully we can see her make a move upside to set it up?!
If not. Flip the script and play this in reverse.. ⏮️
Profile be up on next week. Watch people….
LFG 👽 🫶🏽

Nq longIf price goes back down, i'll likely take this trade. seems strong volume here, plus Japan likely to buy NQ too in their morning.
if price goes back all the way all time high, cancel this trade.

Nasdaq breakout around the corner?The Nasdaq is pushing higher as weaker US employment data boosts risk sentiment and fuels expectations that the Fed will move ahead with rate cuts. With softer labor figures reducing pressure on monetary policy, investors are rotating back into growth and tech names, supporting the broader index. The year-end rally narrative is strengthening as well, with many market participants positioning early for seasonal upside.
Lower Treasury yields are adding momentum, making equities relatively more attractive and encouraging capital to flow back into high-beta sectors. Corporate earnings remain solid in key industries, which helps stabilise sentiment after recent volatility. On top of that, easing geopolitical tensions and improved liquidity conditions are giving markets another tailwind. Market breadth has been expanding too, indicating that the upside is supported by more than just a handful of mega-caps.
From a technical perspective, the critical level to watch is the 25,700 zone. A clean break above this resistance could trigger further upside and potentially send the index toward its old all-time high. Until that breakout occurs, short-term pullbacks are still possible, but the broader setup continues to point toward a constructive outlook as long as the index holds above key support areas.
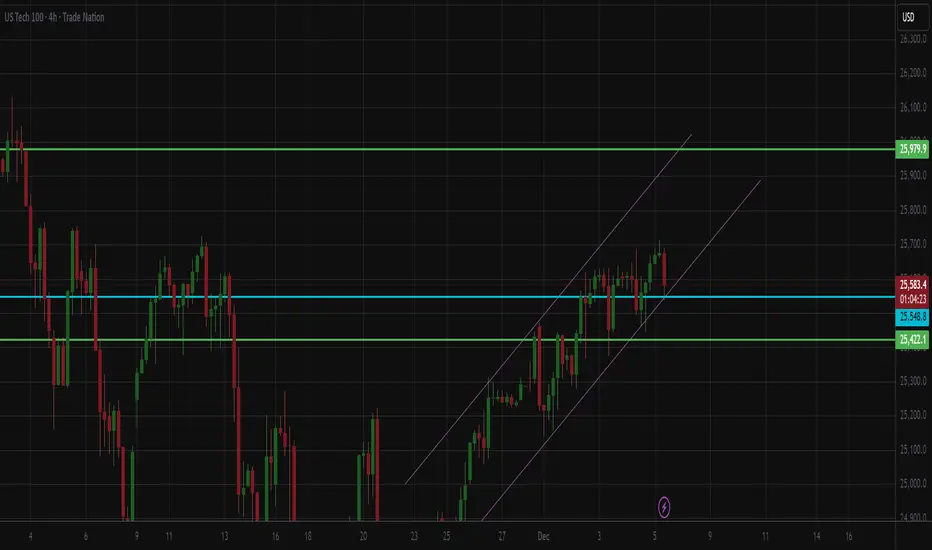
NAS100 – Riding the Channel: Will Price Respect the MidlinePrice continues to move cleanly inside the long-term ascending channel, with the midline acting as dynamic support throughout the past week. Each retest of the dashed median line has produced bullish continuation, but momentum is starting to flatten at the upper boundary.
Key Observations:
Price is currently hovering near the upper half of the channel, showing signs of exhaustion.
The dashed median line has been respected repeatedly — a key structure level to watch.
Bullish structure remains intact as long as price stays above the recent internal higher-low zones (highlighted in green).
MACD shows slowing momentum despite higher prices, signalling a possible pullback into channel support before continuation.
Levels to Watch:
Bullish continuation: If price holds above the midline, we could see another leg into the upper boundary of the channel.
Pullback zone: Watch for a corrective move into the lower channel support if buyers fail to sustain momentum.
Invalidation: A clean break below the channel would shift bias to short-term bearish retracement.
This structure is still very clean — waiting for either a respectful retest or a decisive breakout.
📌 Bias
Bullish overall structure, but expecting a short-term pullback before continuation.
