NAS100 4H🔹 Overall Outlook and Potential Price Movements
In the charts above, we have outlined the overall outlook and possible price movement paths.
As shown, each analysis highlights a key support or resistance zone near the current market price. The market’s reaction to these zones — whether a breakout or rejection — will likely determine the next direction of the price toward the specified levels.
⚠️ Important Note:
The purpose of these trading perspectives is to identify key upcoming price levels and assess potential market reactions. The provided analyses are not trading signals in any way.
✅ Recommendation for Use:
To make effective use of these analyses, it is advised to manually draw the marked zones on your chart. Then, on the 15-minute time frame, monitor the candlestick behavior and look for valid entry triggers before making any trading decisions.
USATEC trade ideas

Nas100 Trading ZonesZone 1 – Shallow Overhead Supply
This area has acted as resistance, but with limited data at all-time highs, its reliability is questionable. Sellers may step in here, yet it should be treated as a soft reference point rather than a strong supply zone. Any breakout could easily invalidate it.
Zone 2 – Fragile Support / Momentum Pivot
This level has shown price reactions, but lacks the characteristics of a strong buy zone. It’s better viewed as a short-term pivot area. If broken, it could attract further selling pressure, but traders should avoid relying on it as solid support.
Zone 3 – Yesterday’s Low / Liquidity Pocket
Yesterday’s low provides a natural liquidity zone where buyers may attempt to step in. Still, the strength of this level is limited. Reactions may be sharp but unstable, and a clean break lower could fuel further downside momentum.
The sharp pullback in the Nas100 yesterday looks to be driven by profit-taking after the Fed’s rate cut, combined with Powell’s cautious tone on inflation and growth. With the index trading at record highs, volatility was elevated and many traders used the news as an opportunity to lock in gains. For now, the move appears more like a healthy correction within an uptrend, but key support zones will need to hold to prevent a deeper reversal.

NasdaqToday's price action can tell us a lot about the trend and future movements. After the drop to 24200, an uptrend line formed and resistance at 24470. If this trend continues, we can expect a breakout of this resistance and the key 24500 level. After confirmation, the Nasdaq could reach its highs again. Remember that on the daily chart, we are still in a strong bullish trend. Happy trading!

Nas100 Trade Set Up Sep 25 2025Price is clearing in a bearish trend now with price breaking PDL, SSL and daily FVG so i will look for sells from the 1h FVG towards lower SSL
www.tradingview.com

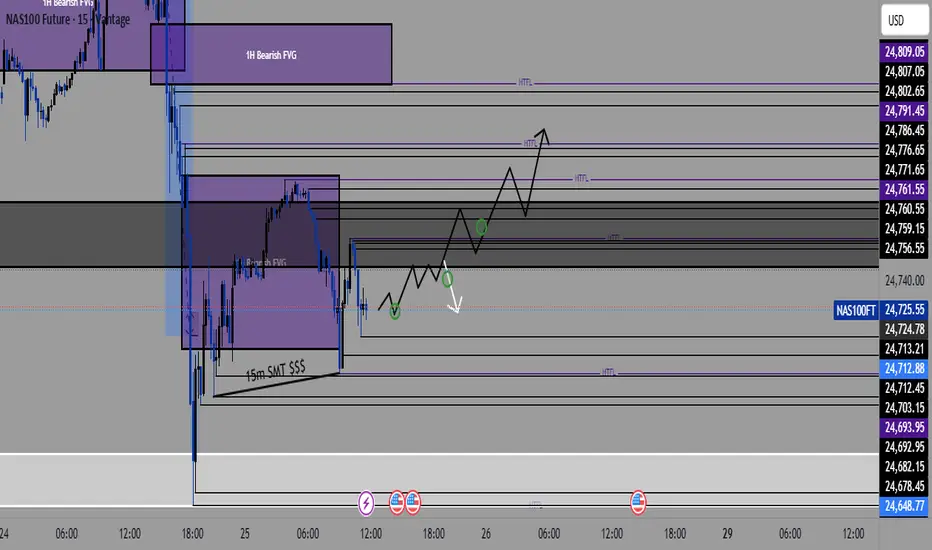
NAS100 (15-Minute Timeframe)🔍 Key Levels to Watch:
Bullish Setup 👇: After a dip in price, we've seen potential accumulation at the 15-minute FVG (Fair Value Gap), setting up for a possible bounce. 🟢
Bearish Resistance ⬆️: Price is currently interacting with a 1-hour Bearish FVG, with potential for further downside if resistance holds. ⛔️
🔵 Potential Trade Plan:
Look for a Pullback: Price could retrace to the higher time-frame resistance zones around 24,791.45 (HTFL) or 24,786.45.
Key Entry Points: Focus on price action near the 15-minute FVG, which may give us a clearer bullish confirmation. 🟢
Target Zones: Aiming for 24,791.45 and higher based on overall momentum.
🔥 Stay alert and trade wisely! Always use proper risk management.
Greetings,
MrYounity
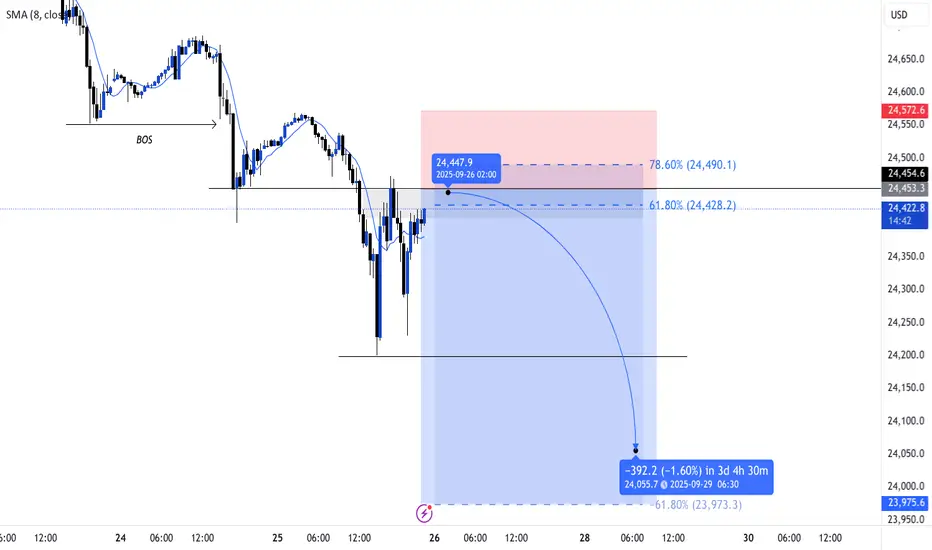
RR=2.5 Sell ideaBearish butterfly pattern + RSI divergence + PRice bounced back on resistance
: Expecting the price to correct , potential target 61.8% fib retracement
PS : never risk more than 2% of your capital per trade


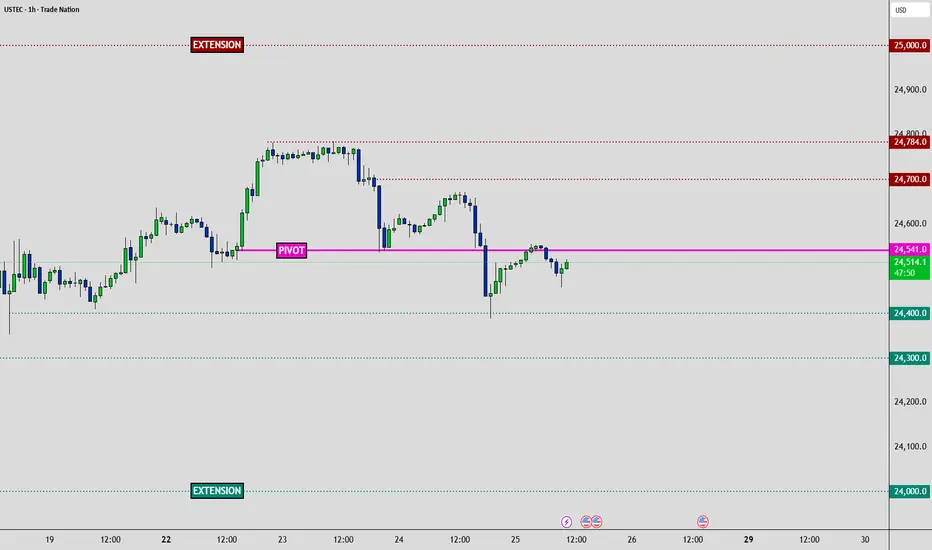
USTEC - 2 Day Traders Edge📈Technical:
MARKET BIAS: Neutral (consolidating at HVN pivot, high-rate sensitivity)
PIVOT ZONE: 24,541 (Exact HVN level)
🥇 Traders Edge - Actionable & Tactical
TRADE SETUPS:
🟧 Risk Warning: Core PCE surprise = 200+ point moves
🟧 Special Risk: High beta to rate moves via PCE
↕️ Bias Flip: Break below 24,400 (bearish) | above 24,700 (bullish)
🟢Long Setup:
• Entry above Pivot | Stop 24,450 | TP: 24,650 | 24,750 | 24,850 - Extended Breakout
🔴Short Setup:
• Entry below 24,400| Stop Above Pivot | TP: 24,300 | 24,000 - Extended Breakdown
🎯KEY LEVELS:
• Strong Resistance: 24,700 | 24,784
• Strong Support: 24,400 | 24,300 | 24,100 | 24,000
🎯PRICE TARGETS:
• Bullish Path: 24,700 → 24,784 → 25,000 (Extended breakout)
• Bearish Path: 24,400 → 24,300 → 24,000 (Extended breakdown)
🚨HIGH-IMPACT EVENTS (48H): (NY Time Zone)
• Sep 25 | 08:30 GDP Q2 Final: 3.3% vs -0.5% → Growth supports tech multiples
• Sep 26 | 08:30 Core PCE MoM: 0.2% vs 0.3% → TECH RATE SENSITIVITY
• Sep 26 | 08:30 Personal Spending: 0.5% vs 0.5% → Tech demand proxy
• Sep 26 | 10:00 Michigan Sentiment: 55.4 → Growth stock appetite
🛑 MASTER RISK EVENT
🟧Friday September 26 | 08:30 (NY Time Zone)
🟧 Core PCE Price Index (MoM) - Forecast: 0.2% vs Previous: 0.3%
🟧 Critical Impact: Fed's preferred inflation gauge determines rate path and USD strength
• Gold: Collapse risk if hot print
• Equities: Rate repricing volatility
• Sectors: Tech rotation sensitivity
⚠️ RISK MANAGEMENT PROTOCOL
• Reduce position sizes before Friday 08:30 EDT
• USD strength reversals impact Gold heavily
• Tech high beta to rate repricing
• Month-end flows amplify volatility
________________________________________
Analysis based on Session Volume POC clusters and HVN methodology

Nas100 Trade Set Up Sep 24 2025I will want to see price sweep SSL followed by a 1m IFVG/CISD to take higher to 4h FVG/Supply
www.tradingview.com

Nasdaq slipped as investors balanced Fed signalsThe Nasdaq 100 (-0.87%) fell as tech stocks weakened. Uncertainty around Nvidia’s $100bn OpenAI deal led the reversal after Monday’s gains.
Powell’s comments added to caution: he repeated that risks remain on both inflation and jobs, but also admitted to “meaningful weakness” in the labour market. This helped bonds rally, but not equities.
Extra pressure came from US government shutdown concerns, while gold hit a record high ($3,764/oz) as investors shifted to a defensive.
Tech momentum cooled, and the Nasdaq slipped as investors balanced Fed signals, policy risks, and stretched valuations.
Key Support and Resistance Levels
Resistance Level 1: 24830
Resistance Level 2: 24950
Resistance Level 3: 25055
Support Level 1: 24412
Support Level 2: 24300
Support Level 3: 24190
This communication is for informational purposes only and should not be viewed as any form of recommendation as to a particular course of action or as investment advice. It is not intended as an offer or solicitation for the purchase or sale of any financial instrument or as an official confirmation of any transaction. Opinions, estimates and assumptions expressed herein are made as of the date of this communication and are subject to change without notice. This communication has been prepared based upon information, including market prices, data and other information, believed to be reliable; however, Trade Nation does not warrant its completeness or accuracy. All market prices and market data contained in or attached to this communication are indicative and subject to change without notice.

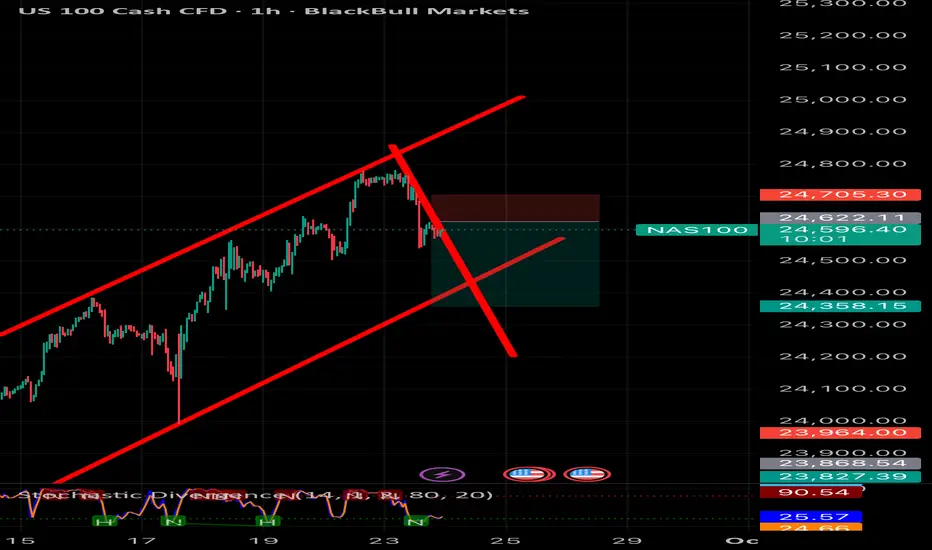
US100 – Bearish Pressure Below 24,768 | Targeting 24,600US100 is showing downside momentum after rejecting the 24,768 zone.
Bears are pushing price lower, with immediate support seen at 24,700.
A clean break below this level could extend the move toward 24,600, which is my near-term target.
If buyers manage to defend 24,700, a short-term bounce is possible, but overall sentiment remains weak.
👉 Do you expect US100 to hit 24,600 this week, or will bulls defend the zone? Share your thoughts below.

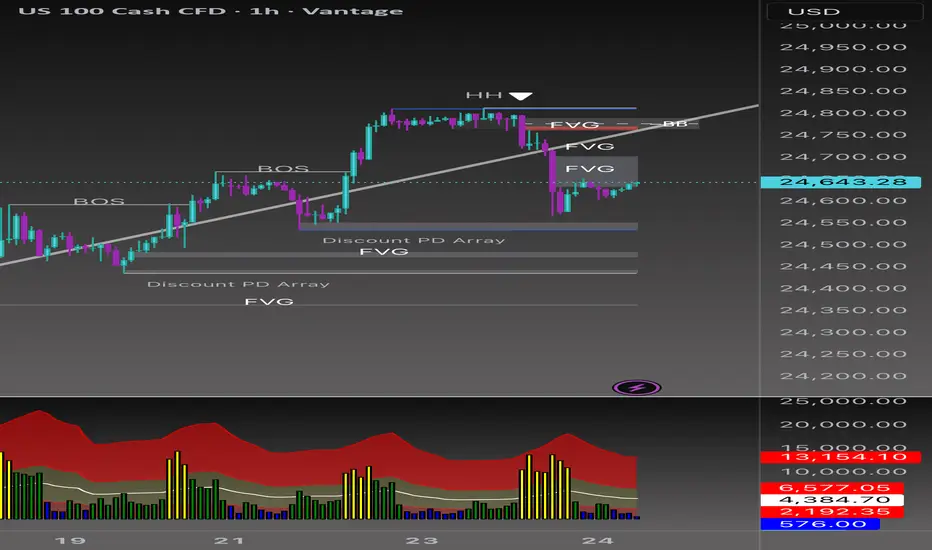
Beyond the Chart - NAS100 Through Technicals & Fundamentals📉 NAS100 VANTAGE:NAS100
Short Bias Analysis (1H Chart)
The market recently formed a Higher High (HH) followed by a Break of Structure (BOS) to the downside, suggesting a potential bearish shift. This move left behind multiple Fair Value Gaps (FVGs), now acting as supply zones.
Key Points
• Liquidity grab above the HH, followed by strong bearish momentum.
• Two FVGs aligning with short bias.
• Current retracement into inefficiencies offers a potential short entry.
• Downside targets: Discount PD Array and lower FVGs (24,480–24,440).
Trade Idea
• Entry Zone: 24,700–24,750 (upper FVG)
• Stop Loss (SL): Above 24,800 (invalidates bearish idea)
• Take Profit 1 (TP1): 24,560
• Take Profit 2 (TP2): 24,440
Risk management remains key 🔑 if price closes above the upper FVG/BB zone, short bias is invalidated.
NAS100 rising wedge breakdown short setup The NAS100 recently broke down from a rising wedge formation on the 1H chart, signaling potential bearish momentum. After failing to hold above 24,700, price rejected the upper channel and is now trading below the wedge support.
Here’s my thought process:
• Pattern: Rising wedge, a bearish reversal pattern.
• Rejection Zone: Price failed at 24,705 resistance, confirming sellers stepped in.
• Breakdown Confirmation: A clean break below wedge support increases bearish bias.
NAS100 ShortElite Analysis
Price accumulation
Asian liquidity was taken out
Price action in lower time frames read as bearish
Targeting lower liquidity pools

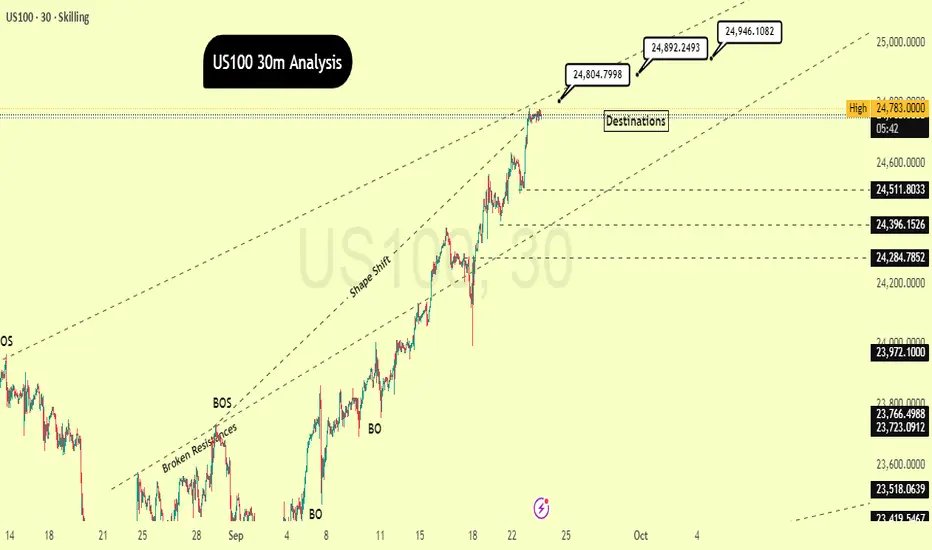
"Reaching Our First Target: What's the Next Step?"By scrutinizing the US100 chart on the30-minutes timeframe, it's evident that the price has initiated a powerful uptrend after surmounting several resistance zones. This is substantiated by the explicit "BOS" (Break of Structure) points, signaling that the market is consistently forging new, higher peaks. The "Shape Shift" noted on the chart indicates a transformation in market character, transitioning from a period of consolidation or a downtrend into a fresh, vigorous bullish impulse.
The price is currently nearing a pivotal resistance point around 24,783.0000. Should the price manage to breach and maintain a position above this threshold, we can anticipate a continuation of the upward trajectory. The prospective targets, labeled as "Destinations," are, 24804.7998, 24,892.2493 and , with an additional high-level objective at 24,946.1082.
I'd appreciate it if you could show your support through likes and comments to encourage me to share more analysis with you, and please share your perspective on the potential direction of this chart with me!
With Respect:
SimarEdgeTrading
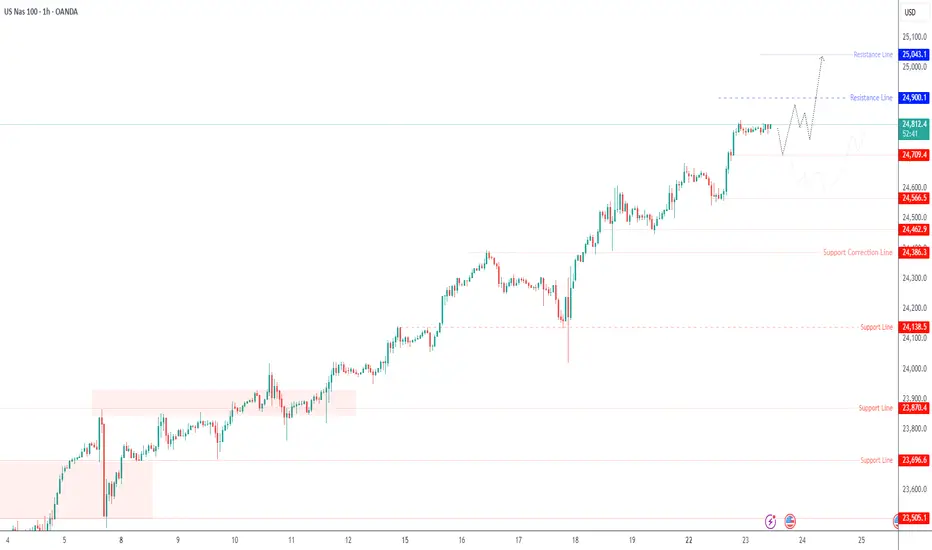
USNAS100 – New All-Time High as Tech Headlines Fuel MomentumUSNAS100 – Overview
The Nasdaq 100 recorded a new all-time high (ATH) near 24,820, extending its bullish run as markets continue to digest upbeat tech headlines.
Investor sentiment remains supported by Nvidia’s plan to invest up to $100 billion in OpenAI, with the first data-center gear expected in 2026, and by anticipation of September flash PMIs, which will test U.S. economic resilience amid tariffs and ongoing Fed commentary.
Bullish Scenario
The index maintains strong bullish momentum while trading above the 24,780 – 24,710 pivot zone.
Targets: A sustained move above current highs could drive price toward 24,900 → 25,045.
An hourly close above 24,900 would reinforce upside momentum, potentially opening the way to fresh highs beyond 25,045 if tech sentiment strengthens.
Bearish Scenario
A confirmed 1H close below 24,710 would signal the start of a corrective move.
Targets: 24,570 → 24,460, with deeper losses possible if profit-taking accelerates after recent ATHs.
Key Levels
Pivot Zone: 24,780 – 24,710
Resistance: 24,900 – 25,045
Support: 24,570 – 24,470

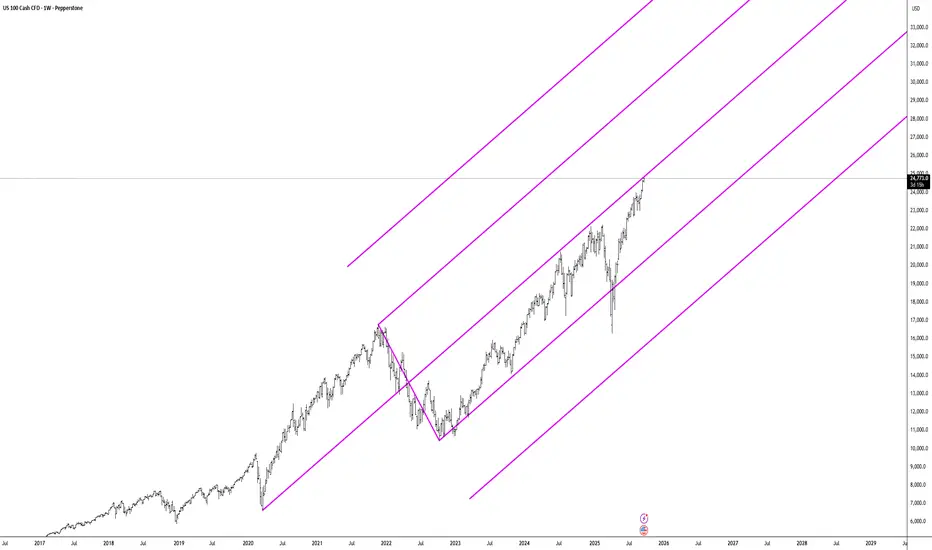
Tech Done?A Lot of rampant speculation is taking place in markets and people seem to think they can't lose - hype is flooding many sectors and valuations are becoming quite unjustified - Looks like we're going to see a decent downturn in the near future.
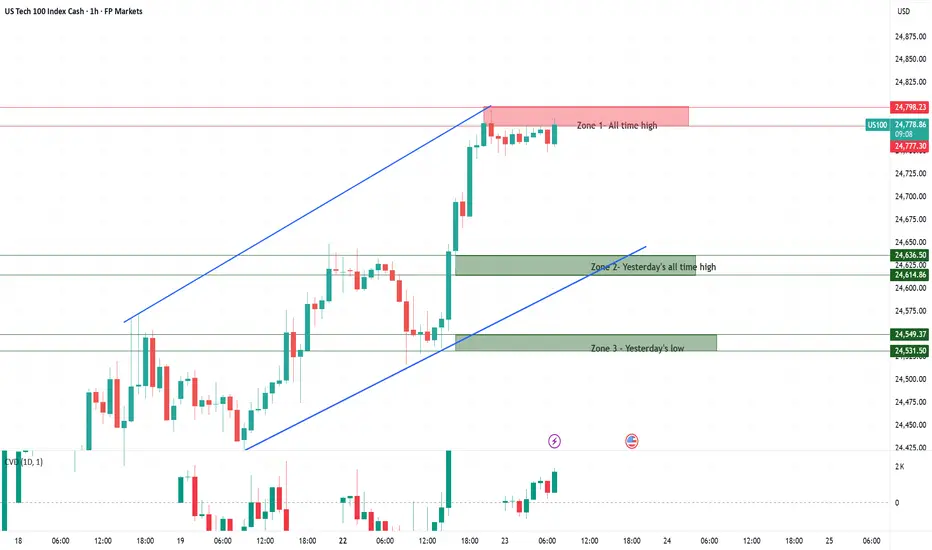
Trading Nas100 at Record Highs The Nasdaq-100 is currently trading at fresh all-time highs, which naturally makes it more difficult to identify strong, well-tested support and resistance levels. With limited historical price action to lean on, these zones should be viewed as guidelines rather than exact buy or sell levels. Traders should remain cautious and flexible in their execution.
Zone 1 – All-time high & yesterday’s high:
This area represents the current record high and the most immediate point of resistance. Price action here is uncharted territory, so reactions can be volatile. A breakout above this zone would confirm continued strength, while rejection could trigger short-term pullbacks.
Zone 2 – Yesterday’s all-time high:
This former high now acts as a potential reference support. If tested, it may attract buyers looking to defend the trend, but given the lack of historical confirmation, reliability remains limited.
Zone 3 – Yesterday’s low:
This marks the lower boundary of recent price action and serves as the next potential support area. If broken decisively, it could indicate fading momentum and open the door for a deeper retracement.
Nas100 is trading near record highs with strong momentum driven by the tech sector, especially AI leaders like Nvidia. The overall sentiment remains bullish, but traders should watch for potential consolidation as the index approaches resistance and technical indicators signal overbought conditions. Regulatory headlines and Fed rate-cut expectations could act as key catalysts for volatility.
USTEC - Trading Edge TodayDear Friends in Trading,
🎯Trading Edge:
Tech leading breakout momentum with institutional accumulation above POC
Key Level: 24,800 (volume gap fill)
Pivot: 24,650 – 24,700
Bias: Bullish above pivot
Bull target: 24,800 → 25,000
Bear target: 24,600 → 24,400
Correlation: +88% with US30, +52% with Gold (Fed trade)
Risk Assets Alignment:
GOLD🔄USTEC🔄US30
✅Gold + USTEC + US30 all bullish above pivots = Fed dovish trade confirmed
✅Unusual Gold/equity positive correlation suggests monetary policy driving both higher
Assets Overbought:
🔴USTEC - 4HR Overbought Divergence Detected
I sincerely hope my point of view offers a valued insight.
Thank you for taking the time study my analysis.

NasdaqNasdaq consolidated another support level at 24740 in today's session. If the price remains above this support, buyers remain in control, and we could reach 25000, an important level that could signal the end of the bullish rally. An H1 candlestick closing above 24800 could confirm continuation.
