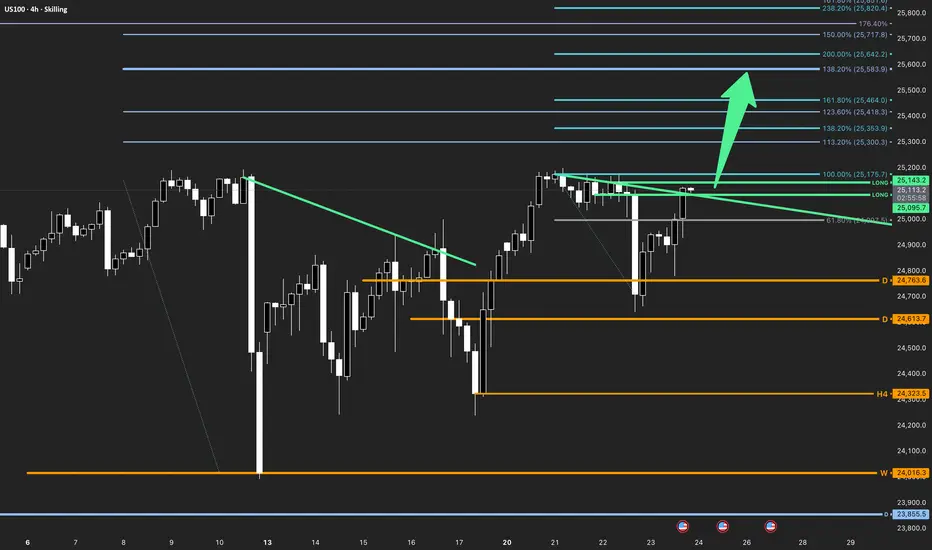
US100 | Expansion Phase Alignment
The Market Flow | Oct 23, 2025
Technical Overview
• Price confirms a breakout above the active countertrend trigger (green).
• All observed timeframes are in bullish alignment — wave structure expanding higher.
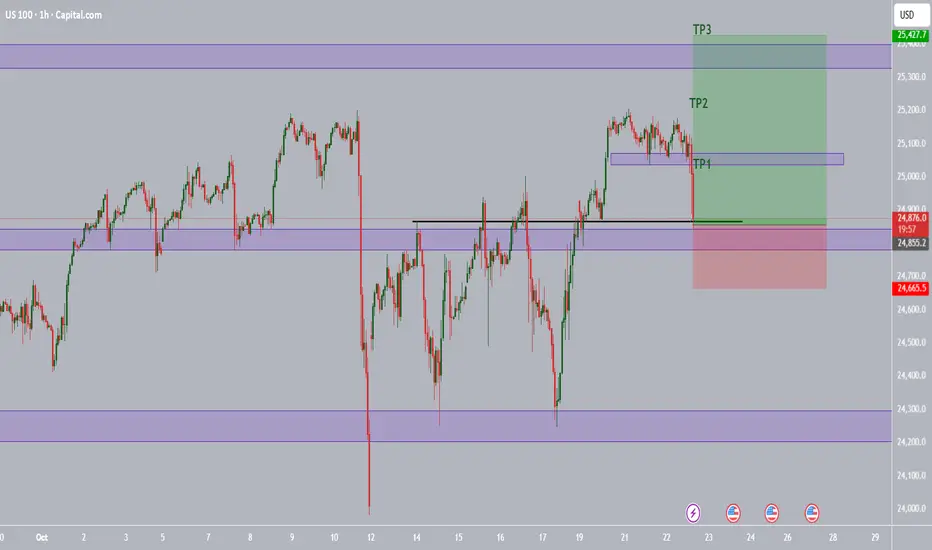
• Immediate resistance lies near 25,175 , where the 100% Fibonacci projection aligns.
• Clearing this zone opens continuation toward higher Fibonacci extensions — 25,353 , 25,418 , 25,464 , and 25,583+ .
• Structural pivots remain supportive above 24,763 and 24,613.7 (daily pivot zone).
Trade Structure & Levels
• Bias: Long above 24,613.7
• Trigger = 25,095–25,143 breakout zone
• Primary Invalidation = 24,613.7 (daily pivot)
• Secondary Invalidation = 24,323.5 (H4 pivot)
• Targets → Fibonacci extensions: 25,353 → 25,418 → 25,464 → 25,583
• Phase: Expansion
Risk & Event Context
• Focus remains on U.S. macro data and yield repricing.
• Short-term volatility expected around key data prints; sustained closes above the trigger confirm momentum continuation.
Conclusion
The US100 shows multi-timeframe bullish alignment, initiating an expansion phase above the countertrend trigger. As long as price holds above the daily pivot at 24,613.7, the structure supports progressive upside toward the Fibonacci expansion cluster.
Disclaimer
This analysis is for informational purposes only and does not constitute investment advice, an offer, or a recommendation. Market conditions and price behavior may change without notice. Past performance is not indicative of future results. Always conduct your own research or consult a licensed financial advisor before making investment decisions.
Trade ideas
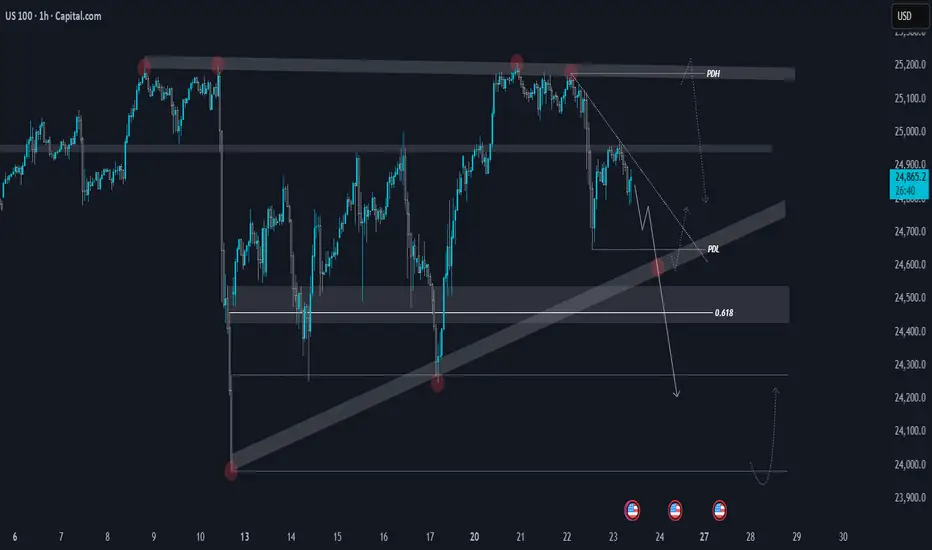
NASDAQ | Daily TF - Bearish Divergence with Double TopCAPITALCOM:US100 NASDAQ continues to hold a bearish tone on the 1-hour chart, with a clear bearish divergence confirming weakness in momentum. Price is respecting lower highs and lower lows, keeping the short-term structure bearish.
On the 4H timeframe, the index is approaching the trendline support around 24,600, which marks the third touch of this level. If this zone fails to hold, we could see an extended move toward the 24,000 area.
From a broader view, the daily chart shows a double top pattern along with a strong bearish divergence — both supporting a deeper pullback. However, a daily close above 25,220 would invalidate this view and could shift momentum back to the upside.
📰 With the ongoing U.S. government shutdown and heightened market uncertainty, sentiment remains mixed. Volatility is expected to stay elevated, so it’s best to wait for clear confirmation around key levels before taking any positions.
Nas100 Trade Set Up Oct 23 2025Price is highly bearish and has filled a 4h FVG already and swept SSL/Asia lows so i will want to see price come up to sweep 15m BSL/Equal highs before making internal structure making 1m-5m IFVG/CISD to target PDL

Nas100 Trade Secured 1500 PipsPrice closed under daily highs and swept daily BSL so i knew lower levels were the target so i waited to 15m BSL to be swept before taking sells to lower levels. Price ended up coming all the way down to fill 4h FVG

USNAS100 | Bearish Momentum After Tesla Earnings MissUSNAS100 | Bearish Momentum After Tesla Earnings Miss ⚠️
The index dropped sharply by 1.5% (~500 points), exactly as projected.
Currently, the bias remains bearish while trading below 24860, with the next downside targets at 24760 → 24510.
Key Levels:
Pivot: 24,860
Resistance: 24,960 · 25,035 · 25,200
Support: 24,760 · 24,510 · 24,350
Trading Plan:
Sell Setup: Shorts remain valid below 24,860, targeting 24,760 / 24,510 / 24,350.
Buy Setup: Longs active only above 24,860, with confirmation toward 25,035 / 25,200.
Premium Takeaway
USNAS100 maintains a bearish bias below 24,860, with room to extend toward 24,510–24,350.
Only a confirmed 1H close above 25,035 would shift momentum bullish, signaling recovery toward 25,200.
previous idea:

NQ Vision for the next daysWe swept 4h candles low. Shifted structure, I'm expecting the price to go into discount and to my enhanced OTE zone and reverse. If the price doesn't get accepted there and supply exceeds demand I expect further down movements.

NASDAQ100 HIGH PROBABILITY SETUPS SOON!!!🚨 NAS100 HIGH PROBABILITY BUY SETUP 🚨
* Here We Can See Clearly The Next Potential Moves For US100 Coming Hours/Days.
* Keep Your Eyes Close On Your Trading Positions.
* Happy PIP Hunting Traders.
FXKILLA.

22 OCT 2025: MARKET RECAP WITHIN DAILY PROFILEObserve how price delivered according to 20 OCT WEEKLY OUTLOOK
DISCLAIMER:
The owner of this page is an authorised Representative under supervision of TD MARKETS (PTY) LTD, an authorised Financial Services Provider (FSP No. 49128) licensed by the Financial Sector Conduct Authority (FSCA) under the Financial Advisory and Intermediary Services Act (FAIS).
The FSP is licensed to provide advice and intermediary services in respect of Category I financial products, including but not limited to derivative instruments, long-term deposits, and short-term deposits.
All investment ideas are provided in accordance with the scope of the FSP's license and applicable regulatory requirements. Derivative instruments is a leveraged products that carry high risks and could result in losing all of your capital, and past performance is not indicative of future results.
This idea and any attachments are informational/education and does not constitute a recommendation to buy/sell.
No guarantee is made regarding the accuracy or outcome of this trade idea.
If you choose to accept this idea, please do so at your own risk.

USNASDEQ100 currently showing bearish momentumThe US NASDAQ 100 is currently showing bearish momentum after recent downside consolidation. The index remains under selling pressure following disappointing earnings reports particularly from Netflix — which dampened risk sentiment.
Additionally, reports suggesting that the Trump administration is considering new export restrictions on China involving U.S. software have further weighed on market confidence may price test the Around 25,000, where reactions could occur. If selling pressure continues, the next major support could be near 24,500.
You may find more details in the chart.
Trade wisely best of Luck Buddies.
Ps; Support with like and comments for better analysis Thanks for Suppooritng.

23 OCT 2025: MARKET OUTLOOK FOR THE DAYUpdate to 20 OCT 2025 Weekly Outlook
The devil is in the detail...
DISCLAIMER:
The owner of this page is an authorised Representative under supervision of TD MARKETS (PTY) LTD, an authorised Financial Services Provider (FSP No. 49128) licensed by the Financial Sector Conduct Authority (FSCA) under the Financial Advisory and Intermediary Services Act (FAIS).
The FSP is licensed to provide advice and intermediary services in respect of Category I financial products, including but not limited to derivative instruments, long-term deposits, and short-term deposits.
All investment ideas are provided in accordance with the scope of the FSP's license and applicable regulatory requirements. Derivative instruments is a leveraged products that carry high risks and could result in losing all of your capital, and past performance is not indicative of future results.
This idea and any attachments are informational/education and does not constitute a recommendation to buy/sell.
No guarantee is made regarding the accuracy or outcome of this trade idea.
If you choose to accept this idea, please do so at your own risk.

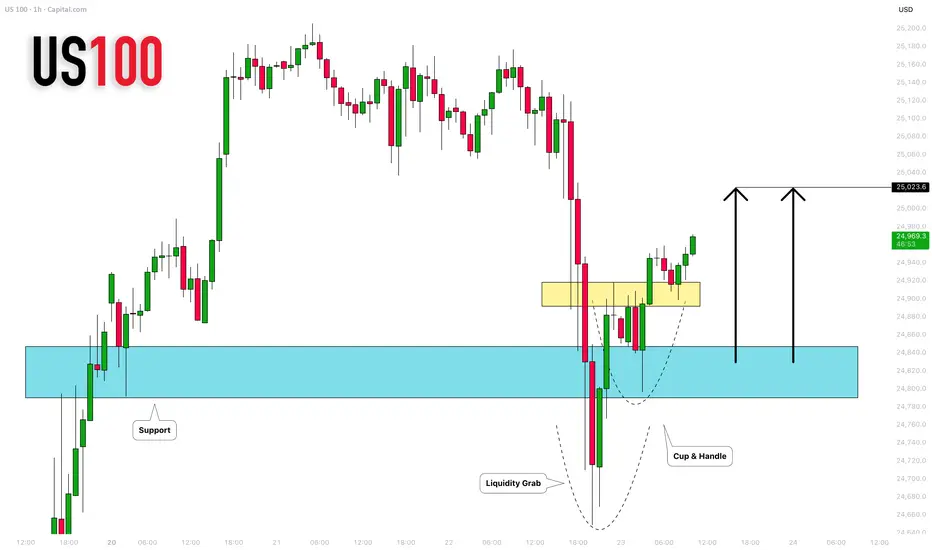
NASDAQ INDEX (US100): Bullish Move After the Trap
I see a confirmed liquidity grab below a key horizontal support
on an hourly time frame.
A formation of a cup & handle pattern and a breakout of its neckline
afterward suggest a strong buygin interest.
The market will rise more and reach at least 25023 level.
❤️Please, support my work with like, thank you!❤️
I am part of Trade Nation's Influencer program and receive a monthly fee for using their TradingView charts in my analysis.
NAS100 short (quick trade) learningNAS100 looks stuck on the 25,150 range it will fall a bit lower and regain the strength to push above the resistance.

Nas100 caught in the crossfire – US–China trade fears returnToday's sentiment
After Tuesday’s pullback, the Nas100 is trading with a tone of cautious defensiveness. Yesterday’s decline was driven by renewed fears of US–China trade tensions after reports suggested Washington may impose new export restrictions on software-related products, sparking concern over supply-chain disruptions and rekindling risk aversion across global markets.
Today, sentiment remains fragile. Investors are still broadly optimistic about tech and AI-driven growth, but the willingness to chase the market higher has faded with the index sitting near record highs. The lack of new macro data due to the ongoing US government shutdown adds to uncertainty, leaving traders highly reactive to headlines.
Overall, the Nas100’s tone is structurally bullish but tactically cautious, the broader uptrend remains intact, yet momentum is vulnerable to any fresh trade-war headlines or disappointing corporate results.
4H Technical Zone Analysis
Zone 1: All-Time High
This is the current all-time high region and the market’s strongest resistance. Price has tested this area several times but failed to sustain a breakout, indicating that sellers remain active and liquidity is being absorbed here. Until buyers manage to close decisively above this zone with strong volume, it remains a heavy supply level likely to trigger short-term rejections or liquidity grabs.
Zone 2: Intraday Supply / Seller Reaction Zone
This zone represents the area where sellers stepped in yesterday, driving the market lower from its upper range. It acts as a short-term resistance and could serve as a retest level if the price attempts another push higher. If buyers reclaim this zone with momentum, it would open the door for another test of the all-time high (Zone 1). However, repeated failures here could confirm seller strength and reinforce the current consolidation phase.
Zone 3: Asia Session Low
This area was defended during the Asian session and marks a near-term demand pocket. The strong rebound from this level shows that buyers are still willing to step in aggressively on dips. Holding above Zone 3 keeps the short-term structure bullish. If it breaks, however, the next area of interest lies at Zone 4.
Zone 4: Yesterday’s Low
This zone represents the lower boundary of the current structure — yesterday’s low and the last significant area of demand before a deeper retracement. It’s a strong liquidity zone where buyers previously absorbed selling pressure. A break below would signal a shift in sentiment and could trigger a move toward 24,500 or lower.

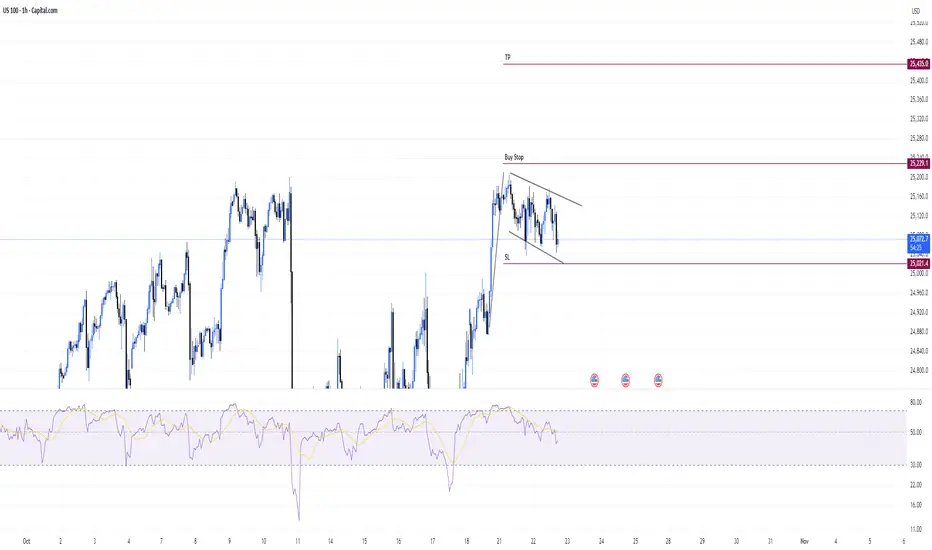
NASDAQ Flag Pattern SetupThe NASDAQ is currently forming a bullish flag pattern. If the price breaks above the flag structure, a Buy Stop order will be placed.
🔹 Entry: On breakout of the flag
🔹 Stop Loss: Below the most recent price low
🔹 Risk to Reward Ratio: 1:1
NAS 100 SHORT TRADEShort Nas100 on 15M TF. Alligator is pointing downwards with all Jaw, Teeth, Lips opened and aligned. Take 1:1 RR trade.


US100 Will Go Down!
HI,Traders !
#US100 has made a retest
Of the horizontal resistance
Of 25169.1 and we are already
Seeing a bearish reaction so
We are bearish biased and
Therefore a local bearish
Pullback is to be expected !
Comment and subscribe to help us grow !

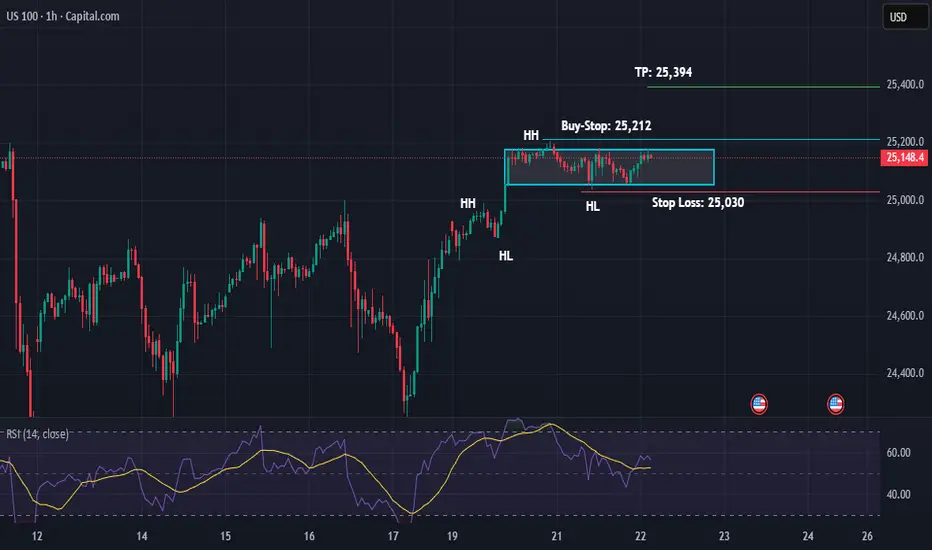
US100 To Make New ATH, Breakout From Range Expected on 1HUS100 can make a new All-Time-High if it breaks from this small range formed on 1H timeframe.
Nasdaq is in Bullish Momentum, and it looks like this new ATH is quite possible.
Let's take a 1:1 Buy-Stop trade here.
Scenario 2Scenario 2: Sideways 1H LTF, Bullish 4H HTF
Buy stop @ cambist red above (25208.8)
Risk 0.4%
R:R 1:1

US100 - LONG POSSIBILITYPrice is curently at at crucial point since it's sitting on a broke previous resistence zone which have a very high chance of being use as a support zone. This is purely ideas purpose only and should not be used alone to take on a trade. Good profits traders.
US NAS 100Preferably suitable for scalping and accurate as long as you watch carefully the price action with the drawn areas.
With your likes and comments, you give me enough energy to provide the best analysis on an ongoing basis.
And if you needed any analysis that was not on the page, you can ask me with a comment or a personal message.
Enjoy Trading ;)

Nas100 Trade Set Up Oct 22 2025Price has swept PDH and a daily BSL with a closure under leaving lots of SSL levels and daily FVG that i will target for sells after BSL being swept on the 15m

NQ SHORTShorting NQ from h4 ote anticipating wed reversal, no news today, short before the news , D crt third candle.
