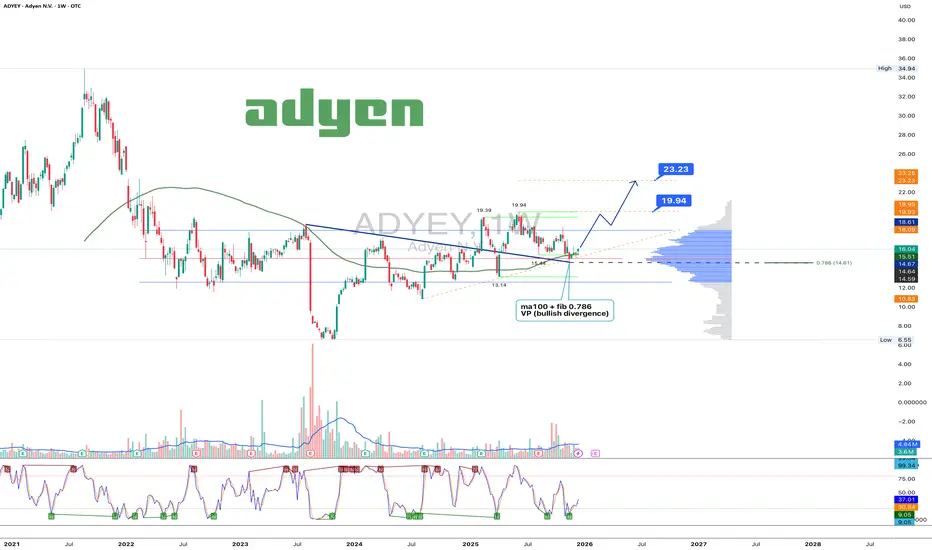
Adyen 1W: The trend broke twice, the market is just catching upOn the weekly chart, Adyen has broken the long term downtrend twice, and price is now performing a controlled pullback retest. The current consolidation holds above the $15.5–16.0 demand zone, where MA100, 0.786 Fibonacci and strong volume profile support align. Selling pressure is fading, volumes
Adyen N.V.
No trades
Next report date
—
Report period
—
EPS estimate
—
Revenue estimate
—
0.35 USD
1.00 B USD
2.44 B USD
3.15 B
About Adyen NV
Sector
Website
Headquarters
Amsterdam
Founded
2006
IPO date
Jun 13, 2018
Identifiers
3
ISIN US00783V1044
Adyen NV engages in the provision of payments platform business. Its products include online payments, point of sale, marketplaces, and unified commerce. The firm operates through the following geographical segments: Europe, the Middle East, and Africa (EMEA); North America, Asia-Pacific, and Latin America. The company was founded by Pieter van der Does and Arnout Diederik Schuijff in 2006 and is headquartered in Amsterdam, the Netherlands.
Related stocks
Adyen's stock price experienced a significant dropAdyen's stock price experienced a significant drop.
ADYEN plunged about 18% the past 24 hours. This decline followed the release of the company's half-year results, which revealed slower revenue growth and a lowered full-year outlook
Looking at the stock technically, I see that it is trading in an
Adyen Margin ExpansionExpecting salary expenses to flatten more + payoffs from investments made in 2023-2024 to have a positive payout

Adyen (ADYEN) – Technical Analysis and 1W OutlookTechnical Analysis
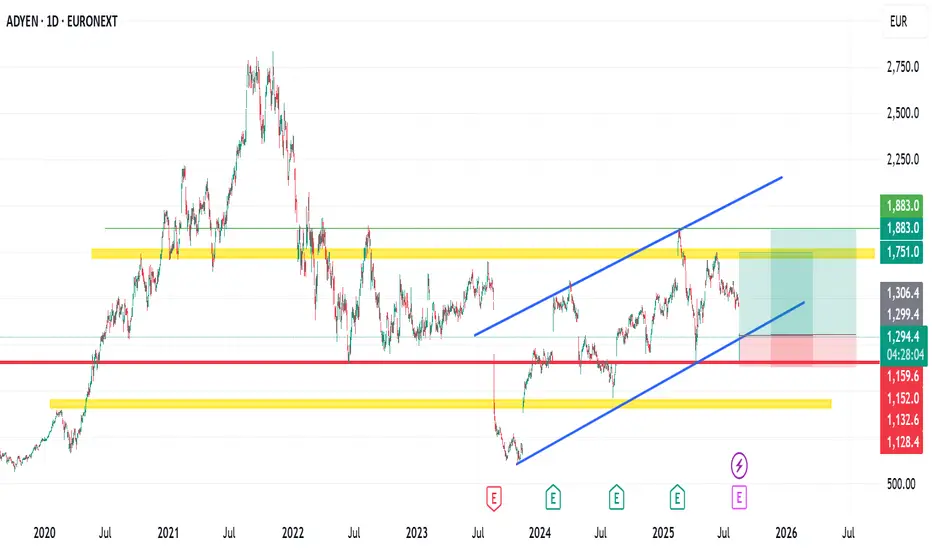
Adyen's stock is forming a symmetrical triangle, indicating a potential breakout. The recent price surge confirmed the pattern's breakout, but a correction toward the 0.618 Fibonacci level (1457.2 EUR) is possible, acting as a key buying zone.
Key Levels:
Resistance: 1720.8 E

Adyen a thing of beauty Downward channel, inverted head and shoulders, level to level mate. Trades done.

ADYEN : Many patterns and Divergence ROCADYEN : Many patterns and Divergence ROC
On the Rise : Detection of :
- 2 Falling Wedges
-Gaps to Monitor
On the decline :
-FLAG ( H1)
- Divergence ROC
-ADX and Di bearish signal
-GAPS to monitor

Another perfect adyen buy?I think this flashcrash has hit the bottom. I bought some shorttime call options. Worth a try

Target 1192Following weekly chart.
I think chart says it's a perfect place to collect some Adyen shares.
Yesterday I bought from 381 and planning to hold them till 1192.
I'll hold if it still remains above 650 weekly close.

$ADYEN breaking ~900 support, heading to ~725 support
Breaking current minor support ~€900.
Heading to next major support level ~€725. Possible relief rally there.
EURONEXT:ADYEN

Adyen to the moonIf you followed my ex idea, we acctually find the bottom at POC, in my opinion, we have all the way free until in the end of imbalance, where i will look for short.

See all ideas
Summarizing what the indicators are suggesting.
Neutral
SellBuy
Strong sellStrong buy
Strong sellSellNeutralBuyStrong buy
Neutral
SellBuy
Strong sellStrong buy
Strong sellSellNeutralBuyStrong buy
Neutral
SellBuy
Strong sellStrong buy
Strong sellSellNeutralBuyStrong buy
An aggregate view of professional's ratings.
Neutral
SellBuy
Strong sellStrong buy
Strong sellSellNeutralBuyStrong buy
Neutral
SellBuy
Strong sellStrong buy
Strong sellSellNeutralBuyStrong buy
Neutral
SellBuy
Strong sellStrong buy
Strong sellSellNeutralBuyStrong buy
Displays a symbol's price movements over previous years to identify recurring trends.