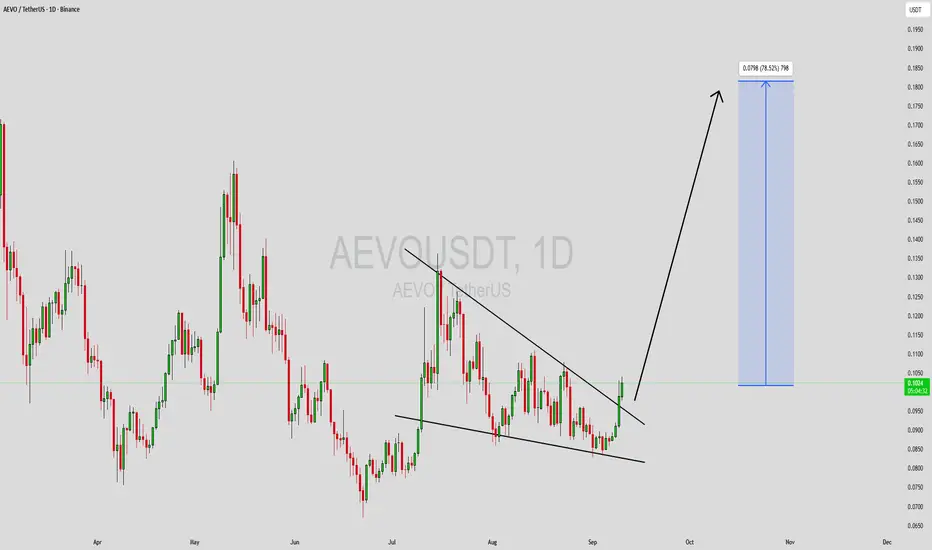
AEVOUSDT Forming Falling WedgeAEVOUSDT is displaying a strong technical setup with the formation of a classic falling wedge pattern. This is widely recognized as a bullish reversal signal, especially when combined with healthy trading volume. The price action has been consolidating within this structure, gradually squeezing and
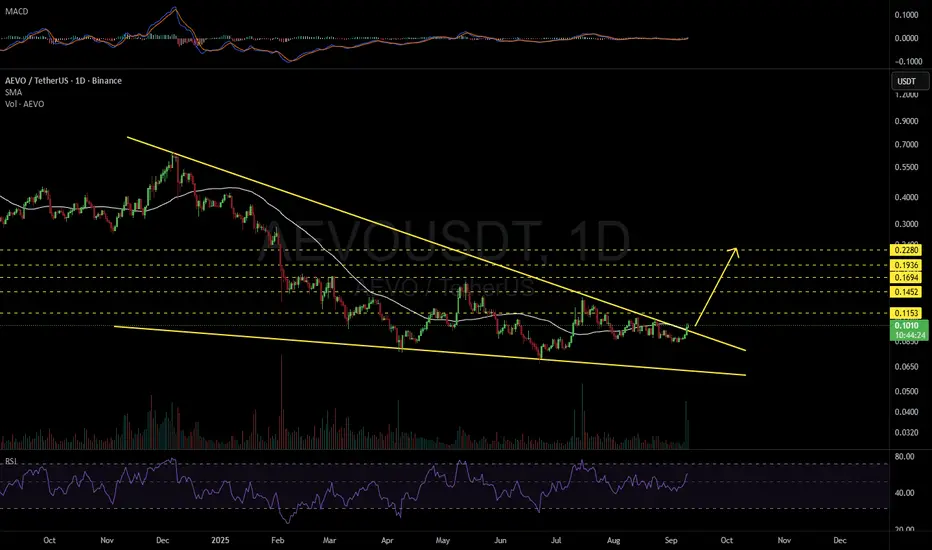
AEVOUSDT 1D#AEVO has broken above the falling wedge resistance and the SMA50 on the daily chart. In case of a successful retest, the targets are:
🎯 $0.1153
🎯 $0.1452
🎯 $0.1694
🎯 $0.1936
🎯 $0.2280
⚠️ Always remember to use a tight stop-loss and follow proper risk management.
AEVO Main Trend DEX L2 Listing 212 X !) Decrease -98% 06 25Logarithm. Term 3 days.
Asset super hype in the past, listing with overly positive and aggressive marketing at 212X!
1️⃣Q1 2023 Private Seed $0.0185 / $1.85 million
2️⃣10 05 2023 Private Series A $0.13 / $6.01 million
3️⃣Q4 2023 Private Series A+ $0.25 / $8.75 million
4️⃣13 03 2024 Listing on the

AEVO/USDT – Major Trendline Breakout! Is This the Beginning?🔍 Chart Overview & Pattern Analysis
The AEVO/USDT daily chart reveals a significant breakout from a long-term descending trendline that has been intact since November 2024. This trendline acted as a strong dynamic resistance, suppressing every bullish attempt—until now.
A clear multi-month accumul
AEVO double bottom 250%AEVO/USDT has seen a ~98% drop from its all-time high, now potentially forming a double bottom pattern in the current accumulation zone. This structure, combined with flattening volume and emerging bullish divergence, suggests a possible trend reversal in the making.
Buy Setup :Risk/Reward :9
Entr

AEVO/USDT — A Classic Altcoin Bottom Structure🧠 Context:
Another chart showing a typical altcoin structure near the bottom. Price has dropped over 98% from the all-time high. The concept of a "bottom" here is highly abstract — risk remains elevated, and liquidity is thin.
📉 Chart Highlights:
▪️ Price is still moving within a descending channel

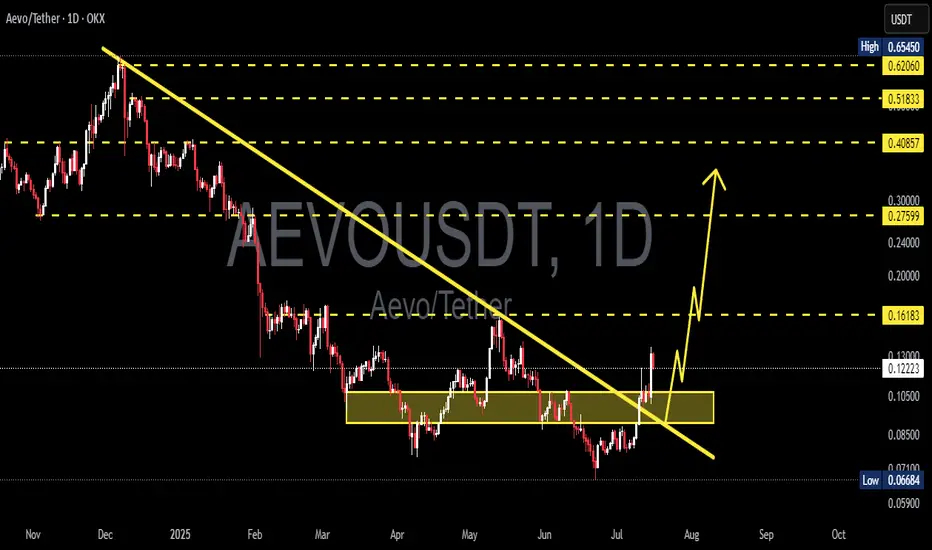
What's coming up for AEVO?Aevo has to break $0.13-14. If its bullish enough to break $0.16 it may also break the resistance line and we can expect $0.25 short-term and higher targets like $0.50 in the long run.
But
If its bearish and fails at breaking the resistance the price can fall back to $0.07 or even $0.04 in the worst


#AEVO/USDT#AEVO
The price is moving in a descending channel on the 1-hour frame and is expected to continue upwards
We have a trend to stabilize above the moving average 100 again
We have a descending trend on the RSI indicator that supports the rise by breaking it upwards
We have a support area at the lo

See all ideas
Summarizing what the indicators are suggesting.
Oscillators
Neutral
SellBuy
Strong sellStrong buy
Strong sellSellNeutralBuyStrong buy
Oscillators
Neutral
SellBuy
Strong sellStrong buy
Strong sellSellNeutralBuyStrong buy
Summary
Neutral
SellBuy
Strong sellStrong buy
Strong sellSellNeutralBuyStrong buy
Summary
Neutral
SellBuy
Strong sellStrong buy
Strong sellSellNeutralBuyStrong buy
Summary
Neutral
SellBuy
Strong sellStrong buy
Strong sellSellNeutralBuyStrong buy
Moving Averages
Neutral
SellBuy
Strong sellStrong buy
Strong sellSellNeutralBuyStrong buy
Moving Averages
Neutral
SellBuy
Strong sellStrong buy
Strong sellSellNeutralBuyStrong buy
Displays a symbol's price movements over previous years to identify recurring trends.