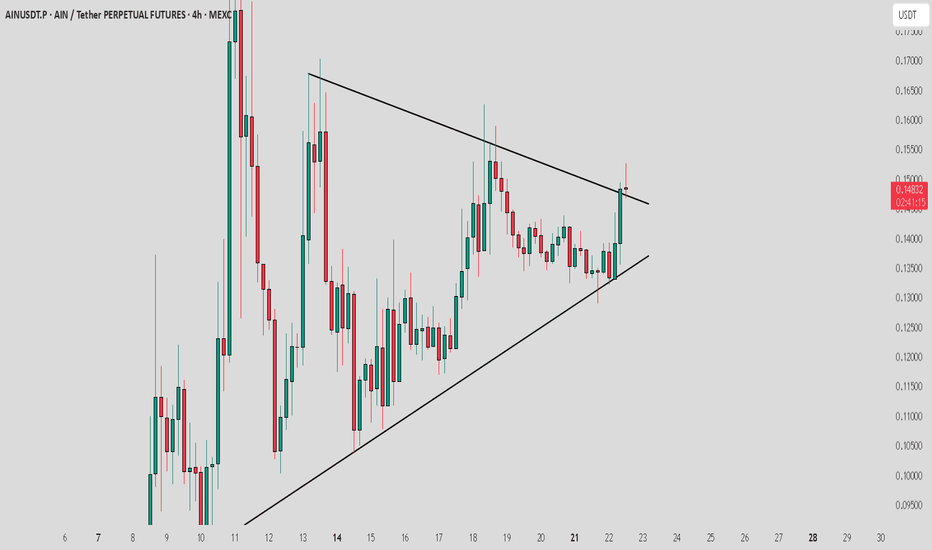
AINUSDT – Watching for a Trend ReversalAINUSDT has been trading inside a descending channel, showing consistent lower highs and lower lows. Price is now testing the upper boundary, and a breakout could open the way for a strong move higher.
- Descending Channel: Clear channel structure since mid-July.
- Current Price Action: Price is
AIN ANALYSIS (12H)Before anything else, note that this is a small market cap altcoin, and if you are a swing trader, you should only trade within the red and green zones.
From the point marked with the red arrow and labeled *start* on the chart, the correction of AINUSDT has begun.
It seems to be engaged in a Diame
AIN / USDT retesting Trendline..Should enter now ? details belowAIN/USDT broke out from trendline resistance and is now retesting the breakout zone. For a safer entry, wait for a clear bullish candle on the 1H timeframe with strong volume. Without confirmation, there's a high chance the retest could fail.
Pro Tips:
– Always wait for confirmation before entering
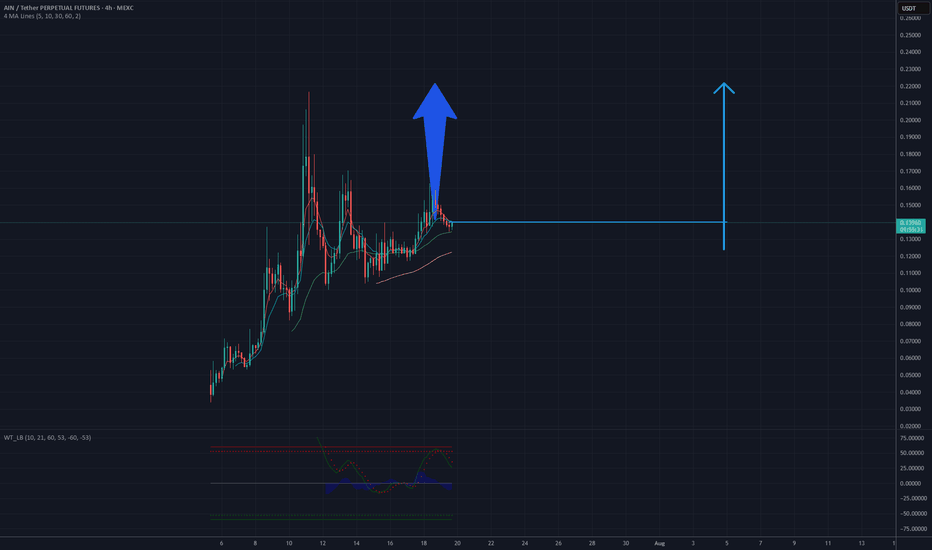
It's a time for AINUSDT! 0.22 USD will be soonAnalysis of the AINUSDT chart on a 4-hour timeframe suggests potential for an upward move. The current price is near a support level around 0.13 USD, where consolidation is observed after a previous decline. The upward price movement from the lows, supported by an ascending trendline and a break abo
See all ideas
Summarizing what the indicators are suggesting.
Oscillators
Neutral
SellBuy
Strong sellStrong buy
Strong sellSellNeutralBuyStrong buy
Oscillators
Neutral
SellBuy
Strong sellStrong buy
Strong sellSellNeutralBuyStrong buy
Summary
Neutral
SellBuy
Strong sellStrong buy
Strong sellSellNeutralBuyStrong buy
Summary
Neutral
SellBuy
Strong sellStrong buy
Strong sellSellNeutralBuyStrong buy
Summary
Neutral
SellBuy
Strong sellStrong buy
Strong sellSellNeutralBuyStrong buy
Moving Averages
Neutral
SellBuy
Strong sellStrong buy
Strong sellSellNeutralBuyStrong buy
Moving Averages
Neutral
SellBuy
Strong sellStrong buy
Strong sellSellNeutralBuyStrong buy


