AIUSDT – Consolidation at Demand Zone: Accumulation or Bearish?⏳ Current Market Context
AIUSDT is at a critical juncture, consolidating within the demand zone of $0.096 – $0.124 (yellow box). This zone has been repeatedly tested since June 2025, making it a last line of defense for buyers before a potential deeper drop.
While the macro structure remains bearis

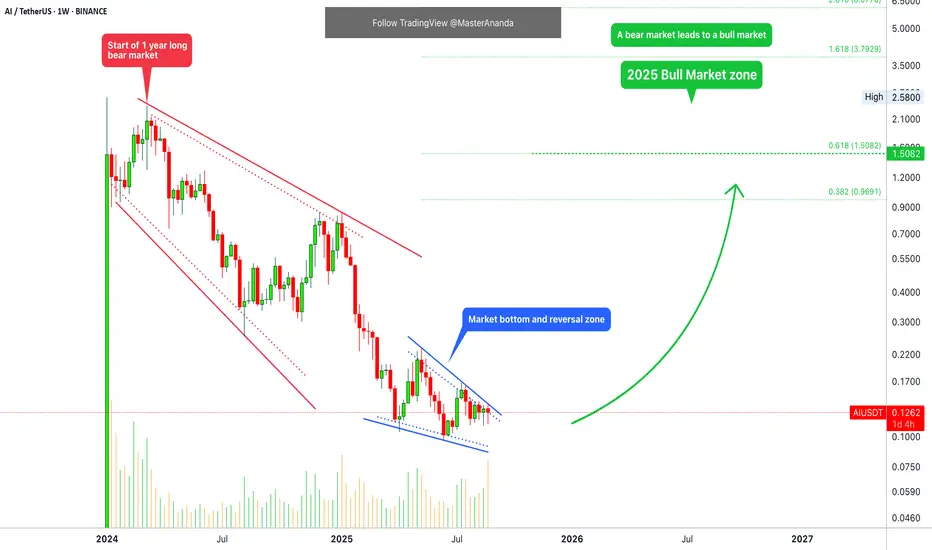
Sleepless AI · It is all in your mindSee here the chart for Sleepless AI (AIUSDT). This is long-term.
Notice the volume this week. Really high bearish volume and a red candle. Why isn't this considered a bearish signal? Because the wick low this week is higher compared to the main low in June and the previous low in April. It can also
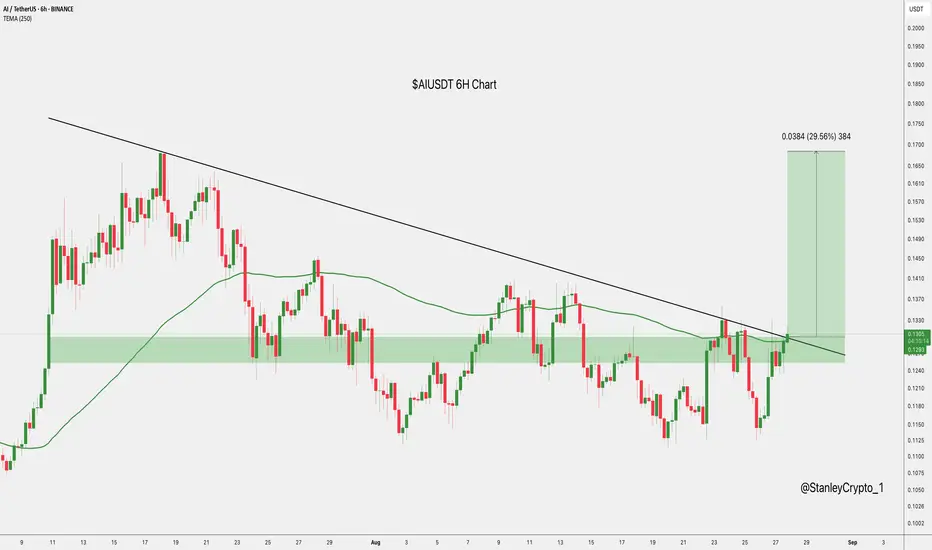
$AIUSDT Breakout: Eyeing $0.1754 NextNYSE:AI is breaking out on the 6H chart, holding steady around $0.1313 after pushing above the trendline.
If buyers keep the momentum, it could climb toward $0.1754 for a solid 30% move.
But if it slips back below $0.127, the setup could lose steam.
DYOR, NFA
$AI - LONG SETUPBINANCE:AIUSDT.P
NYSE:AI
⚠️ HIGH RISK TRADE
Recommended Leverage: 25x
🟢 LONG
Expecting the price to bounce from the white lines support.
📈 ENTRY: If 4H CC above (0.11880), DCA (0.11752)
🎯 TAKE PROFIT: Yellow Lines
🛑 STOP LOSS: 0.11616 (📊 4H Candle Close Below)
⚠️ High Risk – Manage You

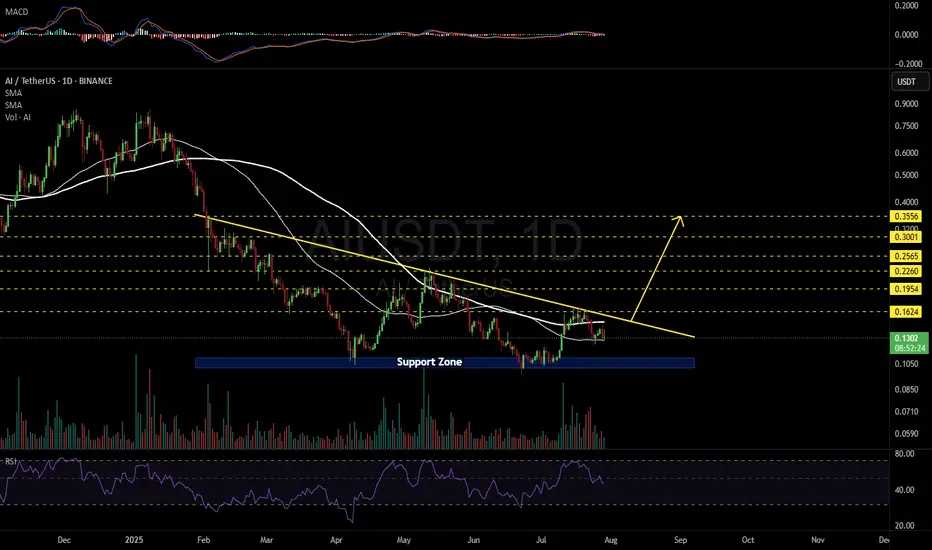
AIUSDT 1D#AI is moving inside a descending triangle pattern on the daily chart and is currently holding above the daily SMA50.
📌 Consider buying at the current level and again near the support zone if the SMA50 is lost and a daily candle closes below it.
In case of a breakout above the triangle resistance
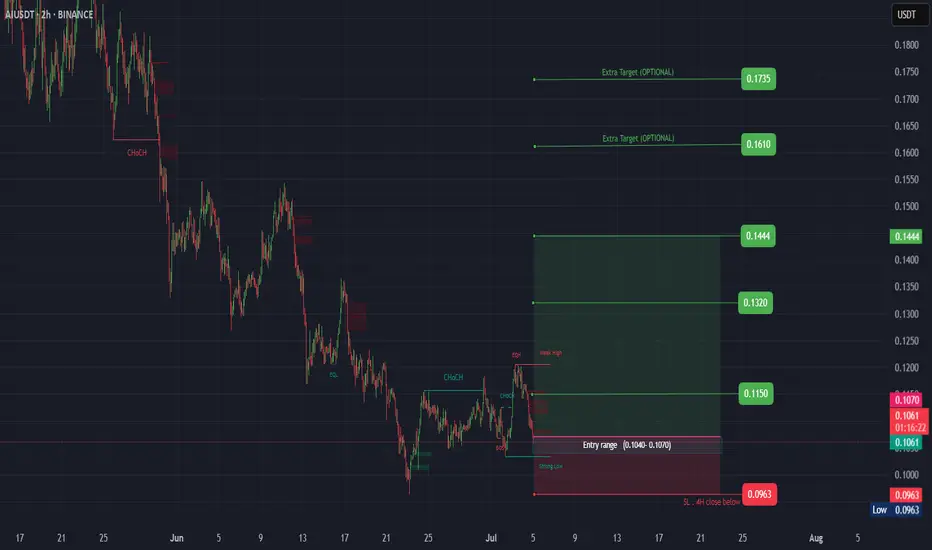
AI ( SPOT )BINANCE:AIUSDT
#AI/ USDT
Entry( 0.1040- 0.1070)
SL 4H close below 0.0963
T1 0.1150
T2 0.1320
T3 0.1444
_______________________________________________________
Golden Advices.
********************
* collect the coin slowly in the entry range.
* Please calculate your losses before the entry.
* Do
AI Looks Bullish (12H)The AI correction has started from the point marked as "start" on the chart.
It seems that wave C has completed, as its time cycle has finished and the price has reclaimed key levels.
As long as the green zone holds, the price can move toward the targets and the red box.
The targets are marked on

AIUSDT Forming Falling ChannelAIUSDT is capturing trader interest with a well-defined falling wedge pattern, a strong technical signal that often precedes a major bullish reversal. This setup shows the price compressing within converging trendlines while volume remains supportive, hinting at an upcoming breakout. With expectatio

AI (SPOT ) 15min Time frameBINANCE:AIUSDT
#AI/ USDT
Entry same as chart
SL 15MIN close below (Same as chart)
Target same as chart
_______________________________________________________
Golden Advices.
********************
* collect the coin slowly in the entry range.
* Please calculate your losses before the entry.
* D

Buy### Important and main block order ### can cause a return and reaction to the level. ### In the low time frame, wait for the first ceiling to break and trade when hitting the block!!!! ###buy ###choch

See all ideas
Summarizing what the indicators are suggesting.
Oscillators
Neutral
SellBuy
Strong sellStrong buy
Strong sellSellNeutralBuyStrong buy
Oscillators
Neutral
SellBuy
Strong sellStrong buy
Strong sellSellNeutralBuyStrong buy
Summary
Neutral
SellBuy
Strong sellStrong buy
Strong sellSellNeutralBuyStrong buy
Summary
Neutral
SellBuy
Strong sellStrong buy
Strong sellSellNeutralBuyStrong buy
Summary
Neutral
SellBuy
Strong sellStrong buy
Strong sellSellNeutralBuyStrong buy
Moving Averages
Neutral
SellBuy
Strong sellStrong buy
Strong sellSellNeutralBuyStrong buy
Moving Averages
Neutral
SellBuy
Strong sellStrong buy
Strong sellSellNeutralBuyStrong buy
Displays a symbol's price movements over previous years to identify recurring trends.