AIXBT Technical & Market OutlookAIXBT is gaining traction in the digital asset space, positioning itself as an emerging player in blockchain-powered trading solutions. While still a relatively new project, its focus on liquidity efficiency and user adoption makes it noteworthy for investors monitoring early-stage assets.
From a t

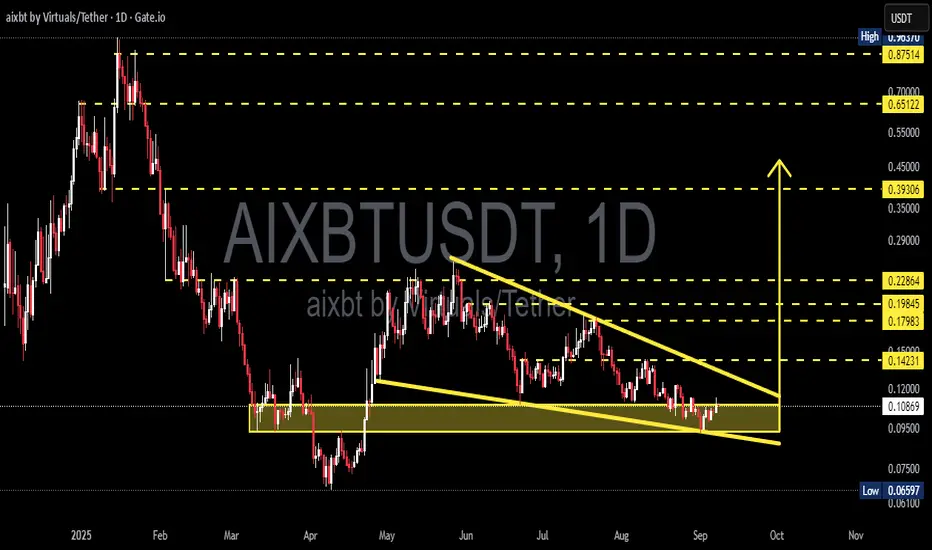
AIXBT/USDT — Decision Point! Falling Wedge in Accumulation ZoneThe price of AIXBT/USDT is currently trading inside a critical accumulation zone (0.085 – 0.110). Recent price action has formed a Falling Wedge, a pattern often seen as a bullish reversal signal. However, the structure also resembles a Descending Triangle, which could trigger a bearish continuation
AIXBT / USDT : Attempting breakoutAIXBT/USDT is testing its trendline resistance and attempting a breakout. If this breakout confirms with strong momentum, we could see a rally toward $0.13 – $0.15 soon.
Best approach: Always wait for clear confirmation before entering. Manage risk properly and trade smart.
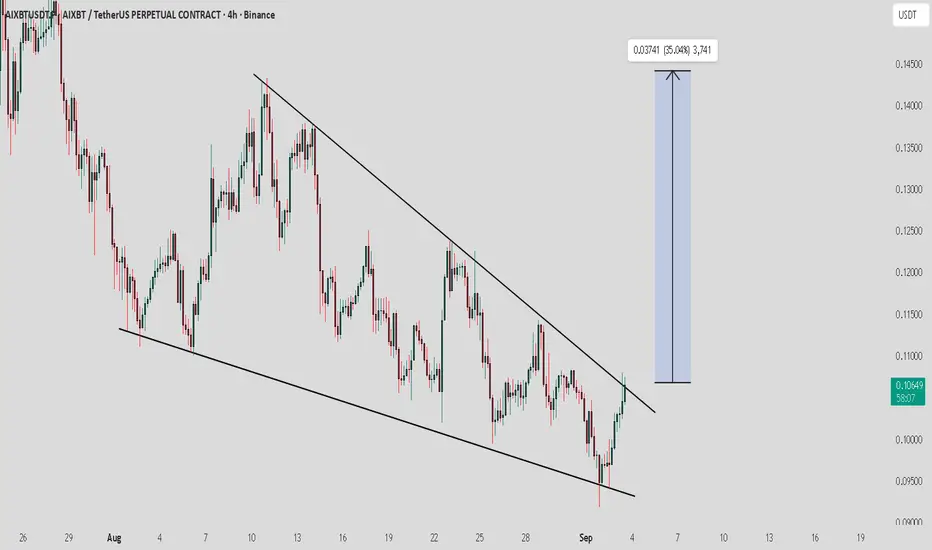
$AIXBT Performing falling wedge pattern Trading strategy
Identify and Confirm: Look for the two converging, downward-sloping trendlines with at least two touches on each. Volume should ideally decrease as the pattern develops.
Wait for Breakout: A bullish signal occurs when the price breaks above the upper trendline.
Confirm Breakou

AIXBTUSDT.P - LONG POSITION SETUP
Timeframe: 4-Hour (4H)
Analysis: Multiple signals on the price chart and oscillators indicate the potential for a strong bullish reversal.
1. Technical Analysis Confirmations:
Harmonic Pattern: The chart shows the D point of the Anti-Cypher Harmonic Pattern, which signals a bullish signal. This

Aixbt Bearish 1 hour📊 Timeframe: 1H
📉 Pattern: Bearish Cup and Handle
💡 Bias: Bearish
💱 Pair: AIXBT
🕵️♂️ Trigger: Breakdown below handle

AIXBT/USDT — Final Battleground Before the Next Major Trend?📌 Overview
AIXBT is currently at a trend crossroads. After months of persistent selling pressure forming a medium-term downtrend channel and being capped by a descending trendline (yellow), the price finally broke above this dynamic resistance in early August.
However, it is now retesting the critic

AIXBT Swing Trade Buy / Long SetupMarket is taking some good correction, Also It has cleared almost all liquidity below side, Now It can move towards upside. Must wait for the entry. It's a swing trade so it can take time on entry and tp. Best Of Luck.

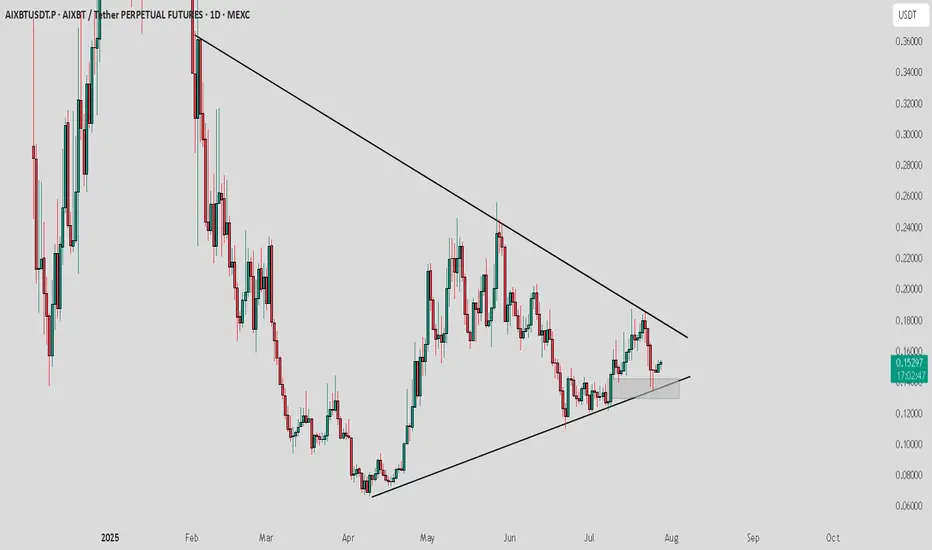
AIXBT / USDT : Getting support and moving towards resistance AIXBT/USDT is currently forming a symmetrical triangle pattern and testing a key support zone. A short-term rally of around 10% towards the upper resistance is expected, leading to a potential breakout.
Bullish Scenario:
A solid breakout above the upper trendline could initiate a major rally, targ
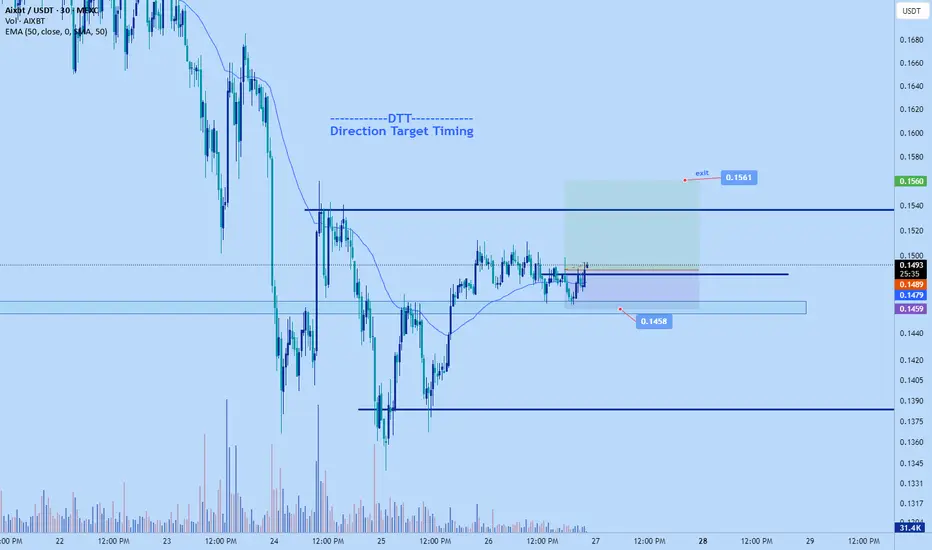
Aixbt long to $01561Just now opened up a long position on aixbt.
sl: $0.1458
TP: $0.1561
Roughly 2.4RR
See all ideas
Summarizing what the indicators are suggesting.
Oscillators
Neutral
SellBuy
Strong sellStrong buy
Strong sellSellNeutralBuyStrong buy
Oscillators
Neutral
SellBuy
Strong sellStrong buy
Strong sellSellNeutralBuyStrong buy
Summary
Neutral
SellBuy
Strong sellStrong buy
Strong sellSellNeutralBuyStrong buy
Summary
Neutral
SellBuy
Strong sellStrong buy
Strong sellSellNeutralBuyStrong buy
Summary
Neutral
SellBuy
Strong sellStrong buy
Strong sellSellNeutralBuyStrong buy
Moving Averages
Neutral
SellBuy
Strong sellStrong buy
Strong sellSellNeutralBuyStrong buy
Moving Averages
Neutral
SellBuy
Strong sellStrong buy
Strong sellSellNeutralBuyStrong buy
Displays a symbol's price movements over previous years to identify recurring trends.