#AIXBTUSDT #4h (ByBit) Descending trendline breakout$AIXBT just regained 100EMA support and looks ready for short-term recovery.
BYBIT:AIXBTUSDT.P aixbt.tech
Trade ideas

AIXBT/USDT – Symmetrical Triangle Squeeze! A Major Move is Brewi🔍 Market Structure Overview
AIXBT/USDT is currently forming a well-defined Symmetrical Triangle pattern on the 1D timeframe, signaling a tightening consolidation between lower highs and higher lows.
Price is consolidating just above a strong demand zone between $0.1200–$0.1350, suggesting accumulation by smart money. This triangle formation represents a classic volatility squeeze, where price coils before a significant breakout or breakdown.
These setups are often the calm before the storm—and they typically lead to explosive moves once price escapes the pattern.
✅ Bullish Scenario (Breakout Upwards)
If price breaks above the descending trendline and clears the $0.1664 horizontal resistance level, it could ignite a powerful bullish run toward the following targets:
1. 🎯 Target 1: $0.2255 – Previous swing high & structural resistance.
2. 🎯 Target 2: $0.3942 – Strong horizontal resistance from historical price action.
3. 🎯 Target 3: $0.5982 – Mid-term Fibonacci/volume confluence level.
4. 🚀 Ultimate Target: $0.8763 – Psychological level and former macro resistance.
> Breakout Confirmation: Look for a daily candle close above the triangle with a surge in volume for confirmation.
❌ Bearish Scenario (Breakdown)
If bulls fail to break out and the price breaks down below the triangle and loses the $0.1200–$0.1349 support zone, the following downside targets come into play:
1. ⚠️ Support 1: $0.0950 – Previous local low.
2. ⚠️ Support 2: $0.0750 – A historical accumulation zone.
3. ⚠️ Support 3: $0.0590 – Major demand floor and last line of defense.
This would invalidate the current bullish structure and signal a potential mid-term trend reversal.
📐 Pattern Highlight: Symmetrical Triangle
Nature: Neutral continuation/reversal pattern, depending on breakout direction.
Volume Behavior: Typically contracts as price nears the apex, then expands post-breakout.
Strategy: Smart entries usually occur on breakout + retest with volume confirmation.
🧠 Final Thoughts
AIXBT/USDT is reaching a critical inflection point. The symmetrical triangle formation is nearing its apex, suggesting that a large move is imminent. Whether the breakout will be bullish or bearish depends on how price behaves at the key boundaries outlined.
📢 Pro Tip: Watch for breakout direction, volume spikes, and possible retests to position accordingly. Don’t forget to set stop-losses in either scenario to manage risk effectively.
#AIXBT #CryptoBreakout #SymmetricalTriangle #TechnicalAnalysis #AltcoinSetup #ChartPatterns #VolumeAnalysis #SupportAndResistance #CryptoTrading #CryptoTA

AIXBT/USDT next LegAfter forming a local top at $0.25, AIXBT/USDT retraced 55% and is now stabilizing in the $0.12–$0.14 range. This zone aligns with previous resistance, which is now acting as strong support, indicating potential accumulation. If the current structure holds, price action is setting up for a move toward a new local high at $0.30.
Entry Zone: $0.13 – $0.117 (green box)
Target: $0.30
Stop Loss: Below $0.105 (to protect against breakdown)

$AIXBT - Scalp Long IdeaBINANCE:AIXBTUSDT | 4h
Valid retest of previous LTF swing point. Potential trendline break out
Ltf demand: .13 to .125
Stoploss: just below .118
TPs:
.142 to .149
.158 to .165
.176 to .182

AIXBT USDT ready to face the highs The overall sentiment appears bearish, with the price respecting the downward trendline and facing resistance from the rejection zone. A break above the rejection zone and trendline would be necessary to signal a potential reversal. Conversely, a breakdown below the order block could lead to further declines.

$AXIBT Breakout Confirmed – 2x Potential Ahead?$AXIBT just broke above a key accumulation zone after days of consolidation.🚀
Strong volume, bullish Ichimoku support, and a clean breakout above resistance suggest this could be the start of a major move.
If this rally continues, we could see a sharp push toward the $0.50+ zone, nearly 2x from here.
Reclaiming and holding above the $0.22–$0.24 zone is crucial for confirmation.
Eyes on this one.

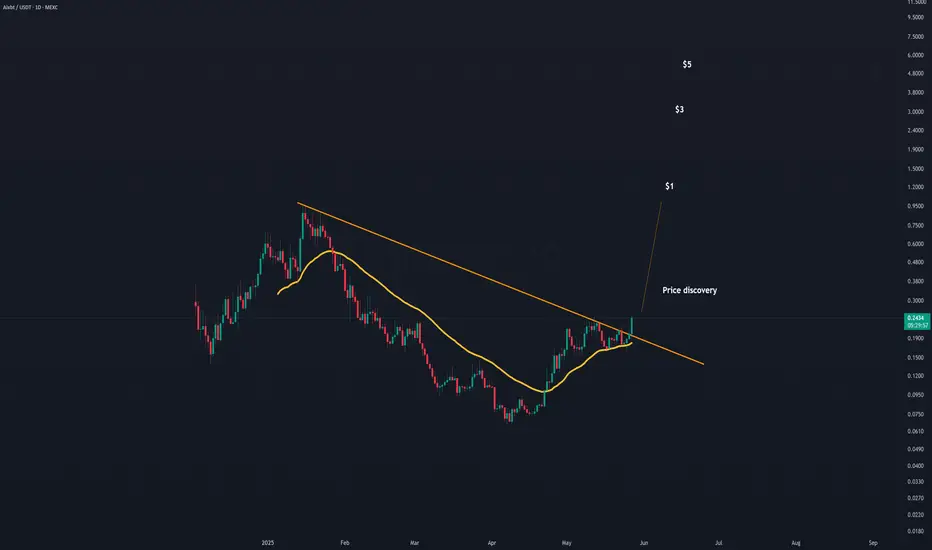
AIXBT Breakout of 5 months trendlineThe big move today was probably due to the breakout from this long trendline. Effectively in 'price discovery' mode and can target $1 and upwards.
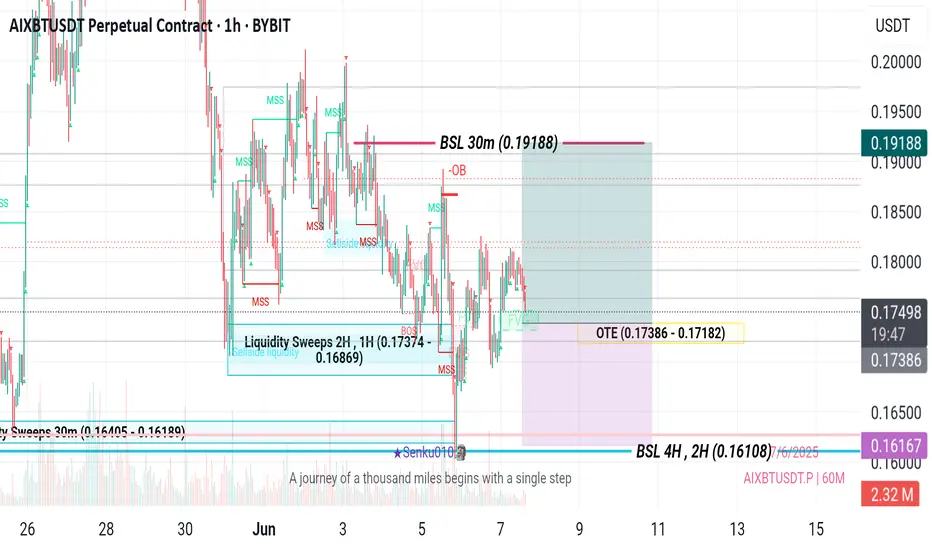
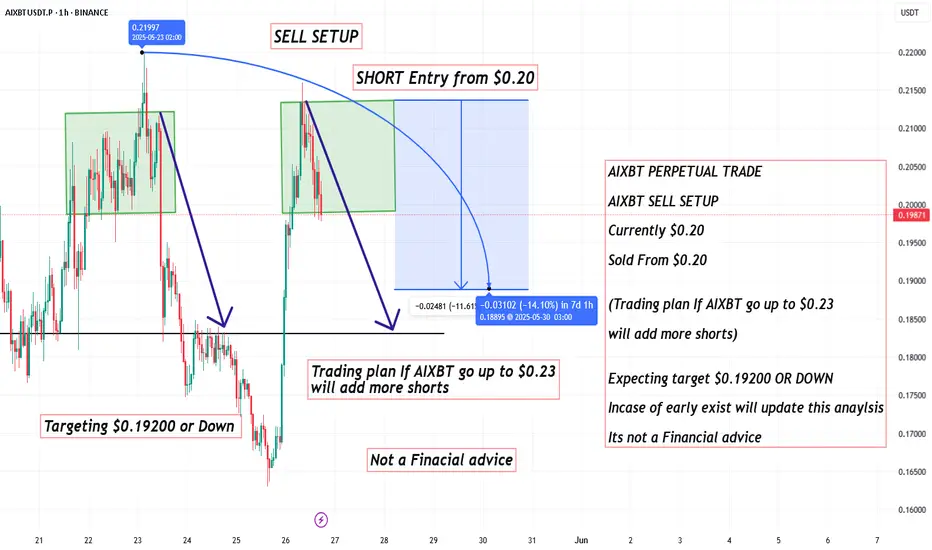
AIXBT PERPETUAL TRADE ,Sold From $0.20AIXBT PERPETUAL TRADE
AIXBT SELL SETUP
Currently $0.20
Sold From $0.20
(Trading plan If AIXBT go up to $0.23
will add more shorts)
Expecting target $0.19200 OR DOWN
Incase of early exist will update this anaylsis
Its not a Financial advice
$AIXBT macro analysis [ ai coin having huge potential ] Hi it's me ur Raj_crypt0
Here is my view on BINANCE:AIXBTUSDT an #ai sector coin .DYOR / NFA
This is low cap high risky coin u may lose 100% before investment check ur self
Entry - $0.25 below
targets ....
¹$0.55
²$1.5
³$3.5
Note - $0.1 below stop buying ( I will update where to avg or wt to do )
If , u are risky taker $1.5 ( get ur liquid there + 1x profit )

AIXBT Forming Cup Pattern – Breakout Potential Ahead
$AIXBT is shaping a bullish cup pattern and is now approaching key resistance. A breakout and hold above this level could trigger strong upside continuation.
📍 Breakout Zone: ~$0.24–$0.25
📈 Bullish Targets:
🎯 Target 1: $0.3123
🎯 Target 2: $0.3553
Watch for volume confirmation and daily close above resistance to confirm momentum.

AIXBTUSDT.P - 1 H Analysis with Our CGI IndicatorAIXBTUSDT.P - 1 H Analysis with Our CGI Indicator
AIXBTUSDT.P Brackout Bearish Double Top Pattern. We are Waiting For OUR CGI Indicator Conformation. Get A Short Position

Alikze »» AIXBT | Formation of the valley pattern - 4H🔍 Technical analysis: Formation of the valley pattern - 4H
📣 BINANCE:AIXBTUSDT currency is moving in an ascending channel on the 4-hour time frame, which is currently in the supply zone and the middle of the ascending channel.
🟢From a classical perspective, a valley has formed that can break the current supply zone in the green box area by removing liquidity under the previous leg and grow to the next supply zone.
💎 Second scenario: The current supply zone break, depending on the number and frequency of hits to the supply level, can break it and continue its growth to the next supply zone, which is also the ceiling of the ascending channel, and then encounter a correction that, after a pullback to the previous supply zone, continues its path to the next target.
»»»«««»»»«««»»»«««
Please support this idea 💡 with a LIKE 👍 and COMMENT 💬 if you find it useful and Click "Follow" on our profile if you'd like these trade ideas delivered straight to your email 📧 in the future.
Thanks for your continued support.🙏
Best Regards,❤️
Alikze.
»»»«««»»»«««»»»«««

$AIXBT - Long Trade Idea$AIXBT | 12h
Price is holding above the previous resistance at 0.13
If it establishes support here, I expect a retest of the 0.25–0.40 zone
Buying zone: .17 to .13
Stop: just below .09
Targets:
.20-.27
.34-.42
.48-.57

Aixbtusdt 11% dump down 0.132 Just shorted aixbtusdt. Anticipating further sell off today down to 0.13159 area.
Doesn't appear to have enough demand to resume prior up trend.
Around 0.13159 daily support might be sufficient

AIXBT/USDT 1H: Markup Phase – Long Setup Above $0.1540AIXBT/USDT 1H: Markup Phase – Long Setup Above $0.1540
🚀 Follow me on TradingView if you respect our charts! 📈 Daily updates!
Current Market Conditions (Confidence Level: 8/10):
Price at $0.1553, showing strong bullish structure after breaking above Fair Value Gap (FVG).
Hidden bullish divergence spotted on RSI, reinforcing bullish continuation potential.
Market Makers completed accumulation phase between $0.0750 – $0.0800, entering markup
phase.
Trade Setup (Long Bias):
Entry: $0.1540 – $0.1555 zone.
Targets:
T1: $0.1650
T2: $0.1700
Stop Loss: $0.1480 (below recent swing low).
Risk Score:
7/10 – Strong breakout supports the setup, though minor pullbacks into FVG retest remain possible.
Key Observations:
Strong support around $0.1300 (equilibrium zone).
Volume profile confirms breakout strength and new bullish order flow.
Break of structure aligns with Smart Money Concepts for continued upward movement.
Price action suggests potential for rapid expansion during markup phase.
Recommendation:
Long positions favored within entry range with tight risk management.
Consider securing partial profits at $0.1650 and trailing stop for potential extension towards $0.1700.
Monitor price action on any pullback into the FVG zone for additional entries.
🚀 Follow me on TradingView if you respect our charts! 📈 Daily updates!

AIXBTUSDT CRYPTOAIXBTUSDT
Crypto again show strength that's why I'm bullish in AIXBTUSDT. It hold good strength to show us upward move. In Crypto, never trade in hurry and always add Qty in layers.
Think about it then make your trade according to your RISK.

Aixbt big short axibt short- Possibly big short
DTT applied. Expecting big sell off.
Trade details on chart, looking to take partials on the way possibly and also possibly scaling in.
Time sensitive


AIXBT: THE PERFECT BULLISH REVERSAL SETUP🔄🚀 for more details FOLLOW ME AND READ BELOW 🚀
📈 Hidden Gem About to Explode
The AIXBT/USDT 1-hour chart reveals a perfectly formed trading range between $0.0780 and $0.0870 - and it's primed for a powerful breakout. After establishing solid support at $0.0780, we're now witnessing early signs of accumulation before what appears to be an imminent bullish reversal.
🎯 Projected Path to $0.1030
The blue projection line shows a clear pathway with three distinctive moves:
1. Initial breakout above $0.0870 resistance
2. Brief pullback to retest support (ideal entry for those who miss the first move)
3. Powerful continuation toward the $0.1030 target (25% gain from current price!)
⚡ Key Technical Triggers
* Price is currently holding above the critical $0.0820 level
* The downtrend line (blue diagonal) is about to be tested
* Volume has been decreasing during consolidation - classic pre-breakout behavior
* Current price ($0.0827) sits at the perfect entry zone before the anticipated move
💎 Why This Setup Is Special
This isn't just any range-bound pattern - it's a textbook accumulation zone following a sharp decline. The steady base-building since April 4th suggests smart money is quietly positioning before the next leg up. The precise horizontal boundaries make this one of the cleanest setups in the market right now.
⏱️ Timing Is Everything
With the hourly chart showing clear consolidation and the projected breakout occurring within the next 48-72 hours, this opportunity presents an ideal risk-reward scenario. The narrow range between current price and invalidation level ($0.0780) means tight stop-losses with massive upside potential.
🧠 Strategic Approach
- Entry : $0.0820-$0.0835 (current zone)
- Stop Loss : $0.0775 (below range support)
- First Target : $0.0900 (psychological level)
- Ultimate Target : $0.1030 (technical projection)
📊 Risk-Reward Analysis
With a potential 25% gain and just 6% risk, this setup offers an exceptional 4:1 risk-reward ratio - the kind of opportunity professional traders wait patiently to find.

AIXBTUSDT 1DAIXBT ~ 1D Analysis
#AIXBT Buy gradually after successfully penetrating this resistant line with a short -term target of at least 15

AIXBTUSDT CHART ANALYSİS - EDUCATIONAL POSTHow NFT Technology Developed
NFT technology was created in 2017 based on Ethereum smart contracts. Since then, we have witnessed many successful NFT projects and deals. Stories like these perfectly describe the current and future possibilities of the technology.
The development of blockchain technology and the emergence of NFT services coincided with other processes in society and the economy. Many new players appeared in the stock markets, including non-professional traders and amateur investors.
The democratization of financial markets coincided with the pandemic: being in self-isolation, alone with their devices, many people began to pay attention to new financial instruments.
The information that arose around them also played a specific role in the “revival” of NFTs. The big names in the news headlines supporting NFTs couldn’t help but draw attention to them. That is one of the reasons why the success of the technology was inevitable.

$AIXBT - Scalp Long Trade $AIXBT | 4h
Looking to tag the mid-range at 0.12 as initial target, next is the bearish order block at 0.15
Entry:
cmp to .108
Stoploss:
just below .103
TPs:
.12 to .125
.148 to .156
