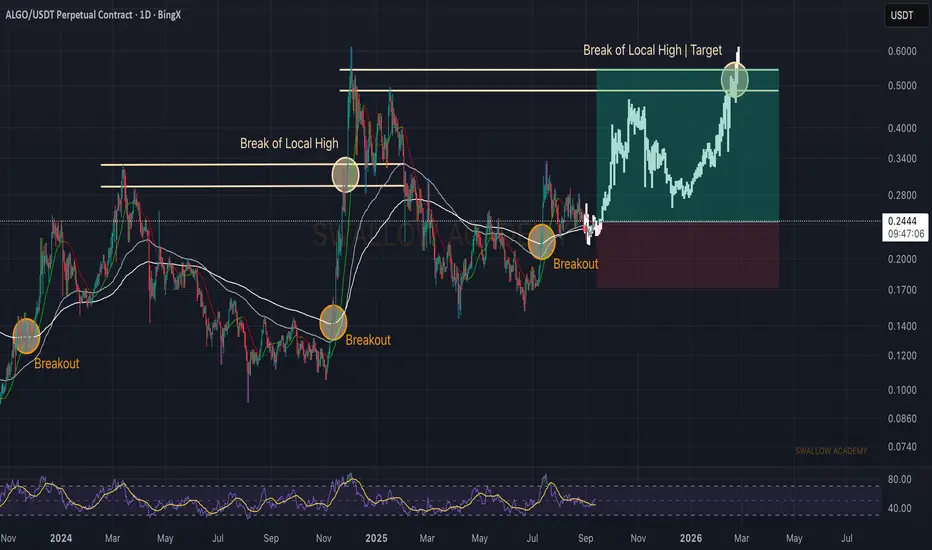
Algorand (ALGO): Expecting Zone From Zone of EMAsEURONEXT:ALGO has shown us once again how strong it reacts to breakouts. Each time we had a clean break, price pushed higher with momentum.
Now we are eyeing the next major move — as soon as the local high gets taken out, we’re looking at continuation toward the $0.50–0.60 zone. As long as buyers
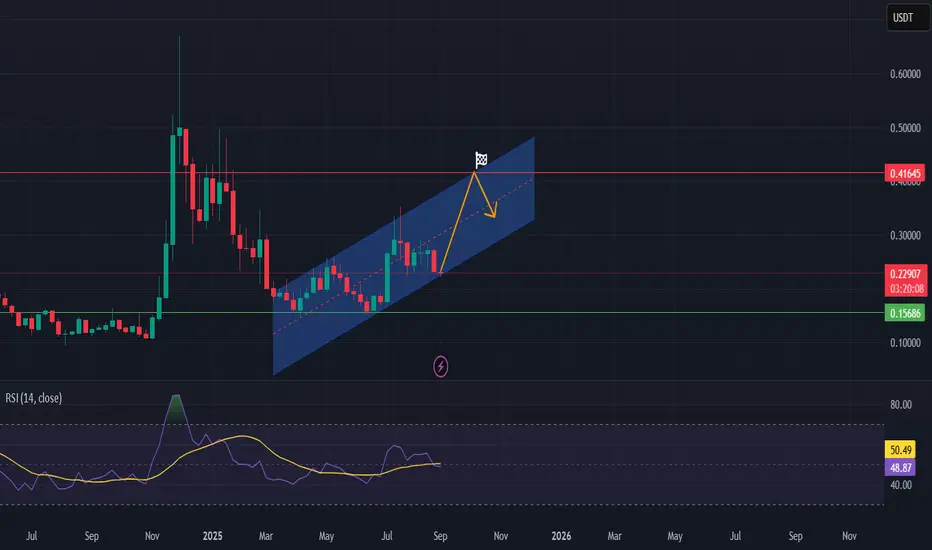
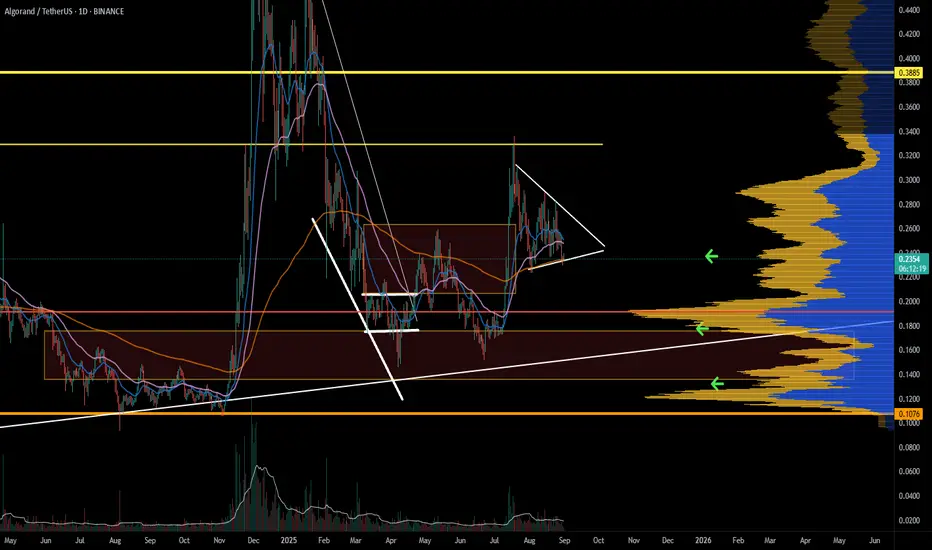
ALGOUSDT (Weekly) – Channel Uptrend with Mid-Term Targethi traders
Let's have a look at Algorand on the weekly time frame.
To be honest, it's not what most traders expected as there's not much going on. After reaching 0,60ish high in December 2024, the price was in a strong downtrend but it's clear that it bottomed out in April 2025, but since then it's
WARNING: NO ALT SEASON YET!!Everyone’s waiting for Alt Season… but I don’t think it’s happening just yet. In this video, I break down the Total Market Cap chart and BTC, to show why the timing isn’t right.
I’ll also reveal the one altcoin I’m watching closely — including exactly where and when I plan to buy it.
📊 In this vid

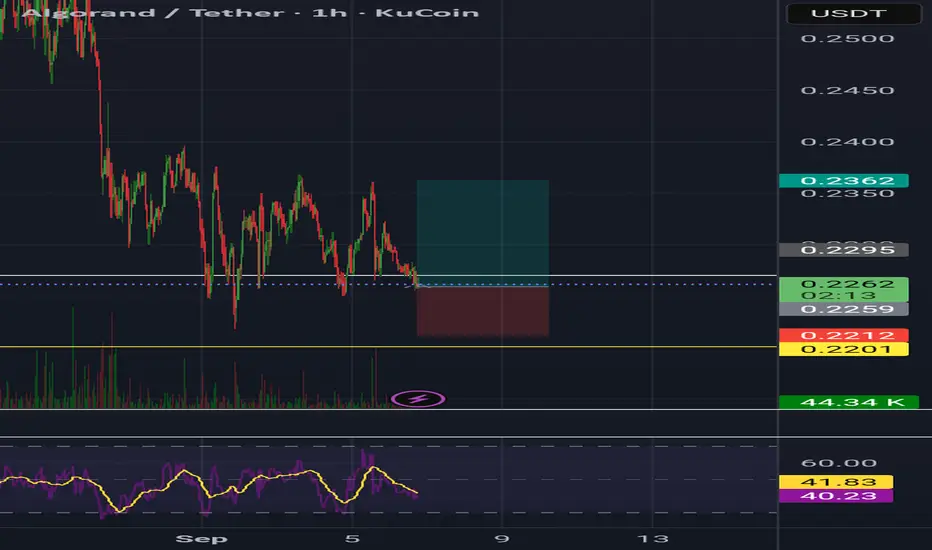
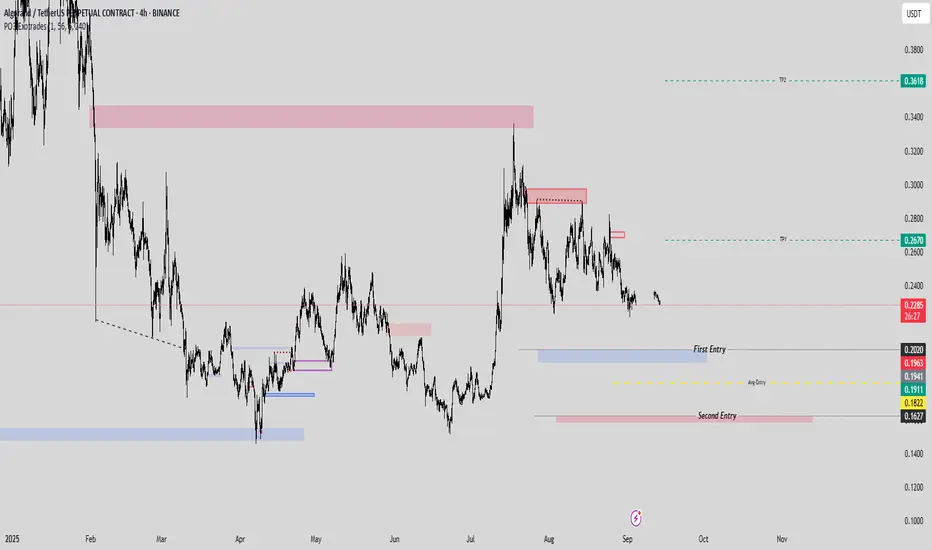
ALGO/USDT Double-Entry Precision Signal with 80% profitHere’s a strategic setup for #ALGOUSDT designed to lock in gains and eliminate downside risk through a two-tiered entry.
- Entry 1: 0.2020
- Entry 2: 0.1627 (purely to reduce overall trade risk; not a profit-seeking leg)
- TP1: 0.2670 (take 50% off the table)
- TP2: 0.1627
---
After TP
ALGO is heating up for an expansionALGO is consolidating, with a bias to the upside. However, we know that market makers like to play games, and the current momentum on LTF is down. Prepare to buy some dips.
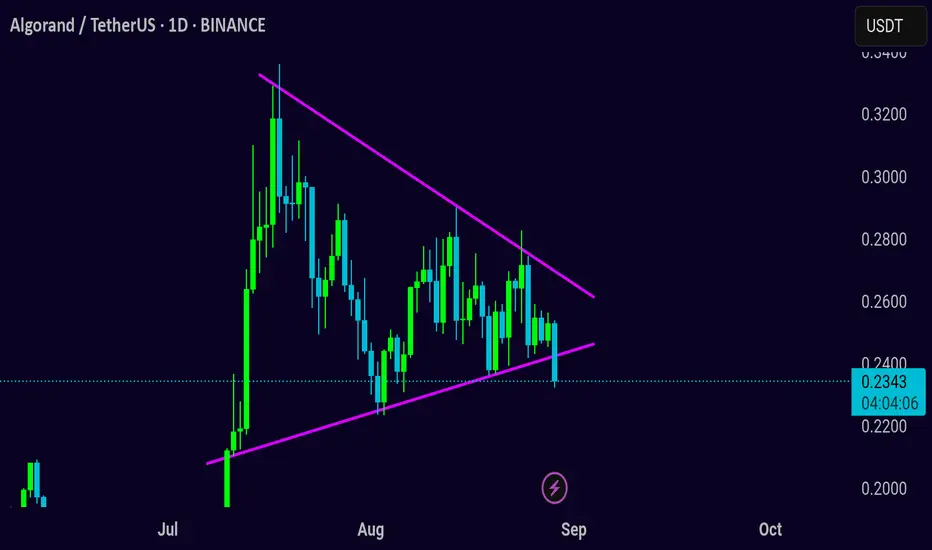
AlgoUsdt IdeaALGOUSDT UPDATE:
ALGO is currently trading around $0.2350. ALGO is breaking down a symmetrical triangle on the daily time frame. The possible scenarios are if the price successfully breaks the triangle and gives a daily close, then we may see bearish momentum in #ALGO. Otherwise, if it pumps from h
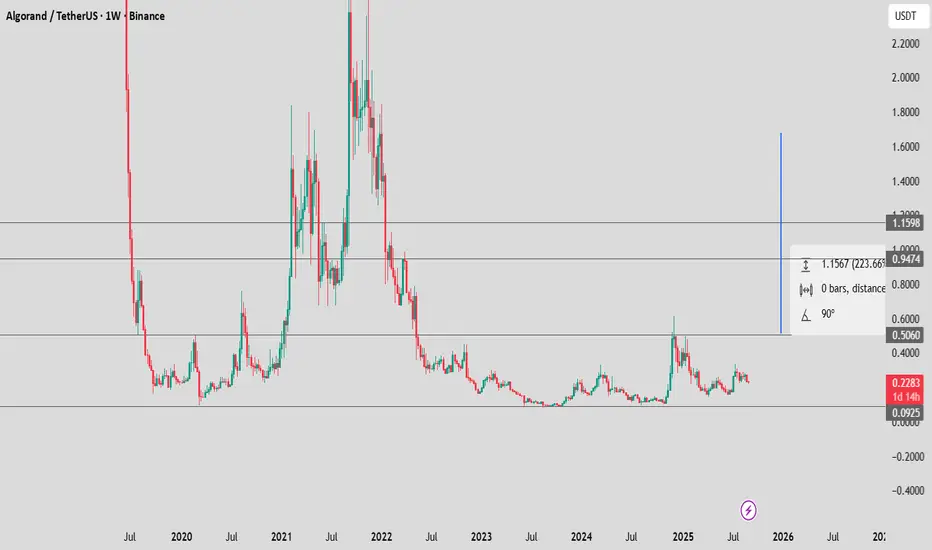
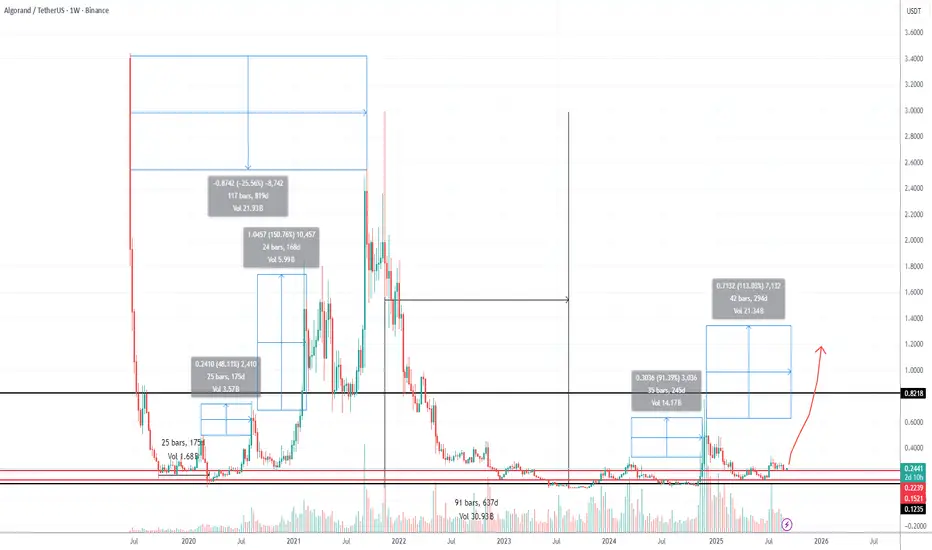
ALGO USDT : Possibility , major break our move aheadALGO been Accumulating for a loong time . as it always has before a strong move
ALGOUSDT – Swing Trade Setup at Key SupportAlgorand (ALGO) recently posted an impressive 29%+ rally, showing renewed strength in the altcoin space. After topping out, price is now pulling back into a significant support zone around $0.23, aligning with previous structure and demand levels.
This retracement could offer a high-probability lon

See all ideas
Summarizing what the indicators are suggesting.
Oscillators
Neutral
SellBuy
Strong sellStrong buy
Strong sellSellNeutralBuyStrong buy
Oscillators
Neutral
SellBuy
Strong sellStrong buy
Strong sellSellNeutralBuyStrong buy
Summary
Neutral
SellBuy
Strong sellStrong buy
Strong sellSellNeutralBuyStrong buy
Summary
Neutral
SellBuy
Strong sellStrong buy
Strong sellSellNeutralBuyStrong buy
Summary
Neutral
SellBuy
Strong sellStrong buy
Strong sellSellNeutralBuyStrong buy
Moving Averages
Neutral
SellBuy
Strong sellStrong buy
Strong sellSellNeutralBuyStrong buy
Moving Averages
Neutral
SellBuy
Strong sellStrong buy
Strong sellSellNeutralBuyStrong buy
Displays a symbol's price movements over previous years to identify recurring trends.