ALGO ... this could be somethingHi guys,
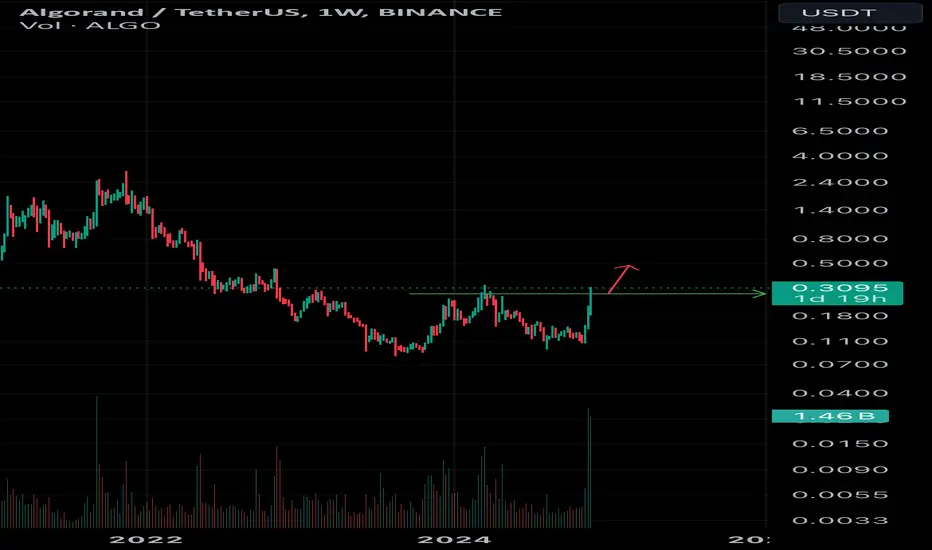
Spotted this setup on ALGO, the target of the cup & handle is situated in the 0,67$ area.
As a "safe" trading setup we still need to wait for a breakout and retest of the 0,23$ area before taking action.
Always take risk management measures while trading ( set stops, maintain risk under 2% etc.).
I hope we all make it !
Trade ideas

ALGO PumpAlgorand is one of the cryptos which has shown bigger gains in this bull pump.
There is a major resistance level in the 0.70 zone, which has been important since 2020. I believe this is the next target to the upside.
In terms of Elliott Waves, my primary count considers we are currently in gray wave 3.
Pullbacks are buying opportunities until we reach gray resistance. At that level I'd be more careful since we could see a deeper correction before continuation.

ALGO LongReason: Break out of Downtrend channel pattern. Above strong resistance zone. Chart looks bullish for it. Worth buy for short-mid term quick profits too.
Entry: 0.1218$ - 0.1170$
Targets: 0.1230$, 0.1260$, 0.1290$, 0.1320$, 0.1380$, 0.1450$, 0.1500$, 0.1550$
Stoploss: 0.1140$

Key Factors Driving ALGO's Potential Rise to $0.70We expect ALGO to continue its upward movement towards the $0.70 level if a combination of positive factors supports its price action. The first of these factors is an increase in buying momentum, which reflects strong demand for the currency driven by new investors or institutions looking to capitalize on the potential of the Algorand network.
Breaking technical resistance is another key factor. The currency needs to surpass the nearby resistance level of $0.50 with a strong close to pave the way towards $0.70. Indicators such as a rise in the Relative Strength Index (RSI) or a positive crossover of moving averages could further confirm this upward trend.
Additionally, support from the broader market is essential. If the cryptocurrency market experiences a general upward trend led by Bitcoin or Ethereum, ALGO could benefit from this momentum to achieve significant gains.
Lastly, positive news or new partnerships could act as a catalyst. Announcements about institutional partnerships or the adoption of Algorand's technologies in major projects could increase investor confidence and boost demand for the currency.
However, it is important to note that reaching the $0.70 level depends on the continuity of these supportive factors. Investors should be cautious of potential risks, such as sudden market fluctuations, and consider monitoring key support levels while employing stop-loss strategies to minimize potential losses.

#ALGOUSDT ( double bottom )According to the kinetic shape of the candles,
can hope for the formation of a double bottom pattern.
The middle line of the green channel at the red flash point
can be the entry boundary to the roof of the green channel.

ALGO/USDT - double bottom - retest and long trade potential
I had planned to enter the trade with a strong breakout and then a retest. Such a strong breakout is a positive indicator for a long trade to be taken. Now it's time to wait for the price to reach the breakout area. If this trade is stopped, I can plan a second long trade from the fibbonacci 0.618 region of the last wave with the 2-618 formation.

ALGOUSDT LONGThis is my random guess for ALGO this cycle. I am predicting a short term high of around $5 by the end of January 2025 and a final blow off top somewhere between $15 and $20 by October/November 2025. The volume for this move is massive and it would be very unwise to fade it IMO. I also don't think this is just old retail coming back. It might be because of the rumour that Trump has said there will be no capital gains on US cryptos (they have all gone parabolic in the last few weeks) or it might be because there is some big news coming. ALGO has been focusing on institutional and government adoption whilst the other L1s have been focusing on retail - maybe it will host a CBDC or something equivalent...

ALGOUSDT (Algorand) Updated till 29-11-24ALGOUSDT (Algorand) Daily timeframe range. its working like absolute beast here. with this volume outperforming many alts out there. pin point close to break 0.4562. a clean close above can push it to 0.6156 and beyond. recent support at 0.3328.

Algorand Undergoing Bearish Pressure; 2025 On Sight (GREEN!)ALGOUSDT (Algorand) has already undergone very strong bearish action, but the bears are not letting go, not yet.
On the 27th of September the chart produced an inverted hammer as a candlestick pattern, a very strong bearish signal. There was an attempt to push prices higher but sellers were ready to exit their positions and a bullish session ended up as bearish, that's the hammer.
Then again on the 21st of October another inverted hammer showed up with a big real body on the candle. A lower high, buyers were trying to produce a relief rally as some other pairs did but sellers were too many and a green session ended up red.
Two attempts at higher prices failed. Now we see how ALGOUSDT is trading at a critical support line, seeing the previous selling pressure, we know this level is more likely than not to break. If it breaks, when it breaks, prices are headed toward next support. There is the chance of a long-term higher low or even a lower low on a wick, this doesn't change the fact that this is the last drop.
2025 is now on sight. The market is going green. The end of the correction is close.
Algorand produced decent growth in late 2023/early 2024, 300%. This is nothing compared to the 2025 bull-market, we will see many times that number so get ready. The low prices that will come in the coming days will be an opportunity, the last chance to buy low before maximum growth.
Thank you for reading.
You are appreciated.
Remember, we all mistakes; we are going through live not knowing who we are or where we come from, but this doesn't stop us from learning, adapting, growing and forging ahead. We learn from these mistakes and grow and this growth will finally lead to the moment when we reach our goals. The realization that we are more than a physical body, we are a manifestation of the living Spirit, an eternally living Soul.
Namaste.

#ALGO: Capitalizing on Scalable Blockchain TechDescription:
This trading idea highlights ALGO, the native cryptocurrency of the Algorand blockchain, a highly scalable and secure network designed for decentralized applications (dApps) and digital economies. ALGO powers a blockchain that achieves high performance with low transaction fees and a commitment to sustainability through its proof-of-stake (PoS) consensus mechanism. Algorand has positioned itself as a leader in enterprise-grade blockchain adoption, forging partnerships with governments, institutions, and developers worldwide. With growing use cases in DeFi, NFTs, and cross-border payments, ALGO is well-poised to benefit from the expanding blockchain ecosystem.
However, like all cryptocurrencies, ALGO is subject to high market volatility, regulatory changes, and fluctuations in global sentiment. Investing in digital assets involves substantial risks, and it is essential to exercise caution and adopt sound risk management strategies when trading ALGO or similar assets.
Disclaimer:
This trading idea is for educational purposes only and does not constitute financial advice. Cryptocurrency investments, including ALGO, carry significant risks, including the possibility of losing your entire investment. Conduct thorough research, consider your financial situation, and consult with a financial advisor before making any investment decisions. Past performance is not indicative of future results.

Here I buy Algorand at $0.35Now I'm buying Algorand at $0.35 cents
And Algorand supply shock is happening here now at $0.35 cents
You know, I'm always two steps ahead of them. On the 6th while they were still discussing the election results, I was already leverage longing bitcoin
And now while they are only watching bitcoin and talking about when it'll hit 100k... If today, tomorrow or next week, I'm always two steps ahead
Buying up altcoins
And when they stop watching bitcoin and start watching altcoins mooning in the middle of the fomo, they'll have to buy them from me at a premium. Then I take their money and they get the technology and innovation they want. A fair trade. Dollar bills for me and technology and innovation for them. That's how it works.
I don't waste my time talking about innovation and technology
I don't waste my time talking about charts, fibs, lines, clouds or whatever crap you learned either.
Now if you want to talk about the best price to make money off this sh NYSE:IT on time, it's here at $0.35. No more talking.
TIME IS MONEY
How is your ROI doing since 6th?
Your family and friends gotta know in the end.
They don't want to know about your fibs, your lines and your technology.
It's 22 days already.
Cheers
Bullshark, the Founder & CEO of the big bull market on november 6th, 2024 at $75,000

ALGO | RoadmapHere I give the possible levels that may occur in case of a dump.
If there is no dump and the order flow continues in a positive direction, the highest level you can enter is the green box. It would be wise to risk a total of 2R, evenly distributed across the three areas.
I don't overcomplicate things and add a ton of dirty crap to my charts, but you can check out the success of my analysis below.
I approach trading with confidence backed by experience and past success in identifying high-probability setups.
While I don’t claim to be the best, my track record speaks for itself, and I strive to let my analysis and results do the talking. Watch these levels closely—markets can confirm what charts already whisper. Let’s see how this plays out together.
My Previous Ideas
DOGEUSDT.P | 4 Reward for 1 Risk much more if you hold it.
RENDERUSDT.P | HTF Accuracy
ETHUSDT.P | Accurate Buyer Zone Identification | High Risk Reward if you hold it.
BNBUSDT.P | Accurate Buyer Zone Identification | High Risk Reward if you hold it.
Bitcoin Dominance | Great Characteristic Detection and Accurate Analysis

Mock Up Price Action for ALGOUSDT | Mid Term (12HR)Mock Up Price Action for BINANCE:ALGOUSDT | Mid Term (12HR)
- Perfect spot now and down to this price point are where for me is now the ideal area to be more heavily accumulating. Likely the very last correction panic volatility low we'll see in 2024 and before 2025 altseason bull runs.

Algo strong possibility of continuation sooner than expectedStop loss: Any M15 close below the entry candle at 0.2833

Algorand testing the 4 Hour Resistance at USDT0.1043, breakout?Take noted the below is not an investment advise, bet at your own risk. I am solely not responsible for any of your loses in money or assets.
The Current Algorand price is USDT0.1004 as of 8 October 2023.
The Algorand have potential to breakout from USDT0.1004 to USDT0.2185 range in the coming 1 to 2 months before the Fed's FOMC in November 2023. This is because the US court has ruled that SEC need to approved Bitcoin ETF from Grayscale. This is a very strong tailwind for the entire cryptocurrency market.
The price will hover between USDT0.1004 to about USDT0.2185 within this period.
The other Potential strong tailwind is the pause of US Fed's rate hike this coming November 2023. This along with the Bitcoin ETF approval will drive and test the resistance level at USDT0.2185. If there is a breakout then the next level of stronger resistance based on the dynamic resistance will be at USDT1.4052.
Currently there is no potential strong headwind in the cryptocurrency space. The only potential strong headwind is the S&P market falling to around 3900 to 3850 because of higher rate for longer by Fed's US. If next 1.5 months down the road if there is other or fews strong headwinds appears then the price might breakout from USDT0.0778 and head much lower maybe even USDT0.01 is possible. This is highly unlikely to happen since everyone is anticipating a positive news of strong tailwind from the Grayscale Bitcoin ETF win over SEC. Currently don't see any much potential of future strong headwind.
USDT0.0778 is not a strong support level based on the 4 hour chart of Algorand. I would only start buying a little at USDT0.0778 and reassess for 2 to 3 weeks before buying more. If by the time Algorand reach USDT0.0778 and the S&P most likely have no reach 3900. The buying scenario above might not happen in this month October 2023 cause everyone will not be selling because of a very potential Bitcoin ETF in the market soon but don't know when only.
Based on current market condition it is highly unlikely to get a low that surpasses last year bottom.

It seems $ALGO wants to correctThe price has reached its highest
It's time to make a price correction
Suggested buying points are indicated on the chart

Algorand (ALGO) Surges 1650% at 10x Leverage!Algorand (ALGO) Trade Overview:
Algorand (ALGOUSDT) delivers an explosive performance, achieving a phenomenal 1650% gain at 10x leverage using the Risological Trading Indicators . The 4-hour timeframe captured this breathtaking rally as ALGO hit all targets and surpassed expectations.
Key Levels:
TP1: 0.1247 ✅
TP2: 0.1364 ✅
TP3: 0.1482 ✅
TP4: 0.1555 ✅
Technical Analysis:
The trade was initiated as ALGO broke past the Risological Green Lines, confirming a strong bullish momentum. The gradual upward curve of these lines provided early indications of sustained buying pressure. The price surged consistently, clearing all the predefined targets with ease.
This move reflects a textbook breakout scenario, powered by volume spikes and an aligned bullish sentiment in the market. Traders leveraging Risological tools were well-positioned to capture this remarkable upside, securing massive profits.

Algousdt idePositional traders will jump in if algo closes the week above 0.28 I think the momentum is strong and the rsi shows strong buying pressure . Buying a small position just because it seems it’s a bit high right now but can always go higher if the weekly closes above resistance .
$Algousdt trade ideahi everyone,
we have seen good rally on EURONEXT:ALGO recently, however Im expecting a pull back till $.16 and than start rising until $.25
you can see my exact enter and exit price on the chart.
** Please LIKE 👍, FOLLOW ✅, SHARE 🙌 and COMMENT ✍ if you enjoy this idea! Also share your ideas and charts in the comments section below! This is best way to keep it relevant, support me, keep the content here free and allow the idea to reach as many people as possible. **
#trading #BTC #bitcoin #coin #scalping #crypto

Just for me - ALGO!ALGO is gonna go strong with the new partnerships HBAR etc.. Good time to fill the bags and ride this train the long way. Shorttermijn 100% / Longterm 1300%+++

ALGO ANALYSIS (update)🔮 #ALGO Analysis
🌟🚀 As we sail earlier, #ALGO performed the soo well & 78% Profit booked. Currently #ALGO is trading around its consolidation point. We could expect a breakout and reach towards resistance 1 zone and could expect a potential bullish move📈 Expect a bullish wave of around 20-25% in the coming days
🔖 Current Price: $0.2254
⏳ Target Price: $0.3200
🏷Remember, the crypto market is dynamic in nature and changes rapidly, so always use stop loss and take proper knowledge before investments.
#ALGO #Cryptocurrency #DYOR

Alikze »» ALGO | Scenario 3 or C bullish - 1W🔍 Technical analysis: Scenario of the first cycle bullish wave 3 or C - 1W
BINANCE:ALGOUSDT In the daily time frame, the ascending channel is moving.
- In the analysis presented in the previous post , after reaching the dynamic trigger, it faced selling pressure and, after a correction of 0.23 Fibo of the previous wave, it was able to continue the upward movement to the supply area.
- Considering the previous movement structure, which had an upward cycle to the 33 cent range, after which it made a three-wave downward correction cycle.
💎After that, by forming a Double Bottom, it was able to touch the middle of the channel and the neckline by creating demand.
💎Considering the momentum, this movement cycle can continue to the ceiling area of the ascending channel and the supply area, and then with a temporary correction in the middle of the channel, it can continue the upward path to the second supply area.
⚠️In addition, if the price enters the Invalidation LVL range during this upward phase, the bullish scenario is invalidated and must be re-examined and updated.⚠️
»»»«««»»»«««»»»«««
Please support this idea with a LIKE and COMMENT if you find it useful and Click "Follow" on our profile if you'd like these trade ideas delivered straight to your email in the future.
Thanks for your continued support.
Best Regards,❤️
Alikze.
»»»«««»»»«««»»»«««

ALGO / USDTALGO / USDT
Everything described in chart
Forming big double bottom and HH and HL in LTF
price is going straight up from bottom
We are on this trade since 0.17$ and i still see potential room for more growth
If you a holder or want to make a new entry see the support and resistance in this chart and keep following it
