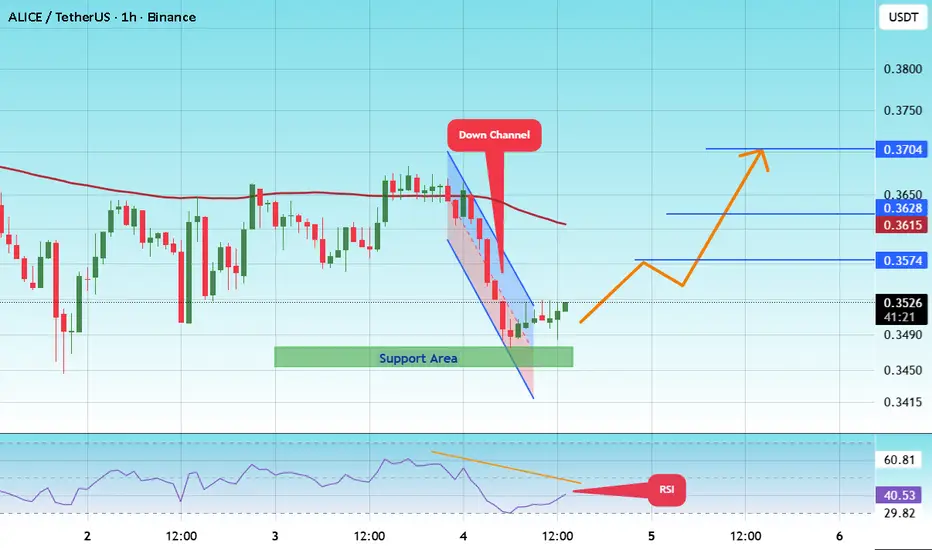
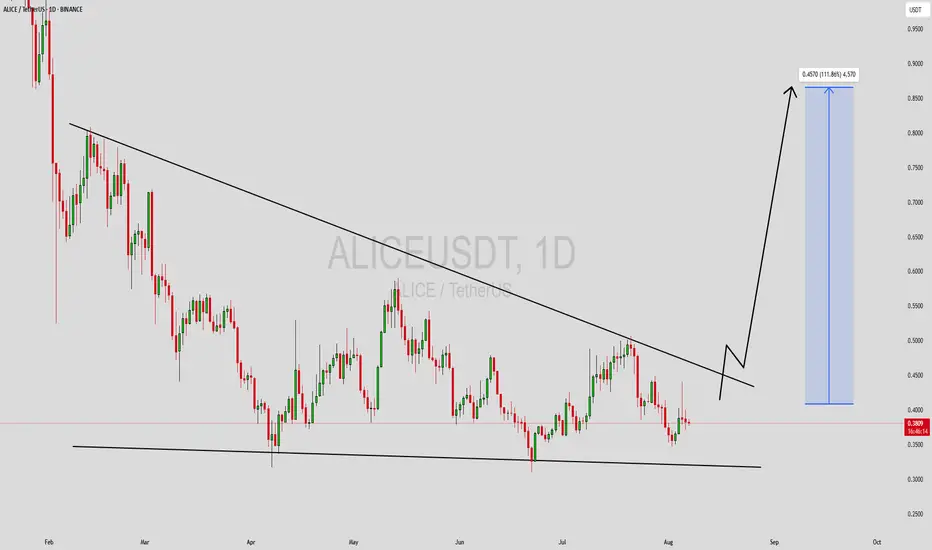
#ALICE/USDT — Descending Triangle at Demand Zone!#ALICE
The price is moving within a descending channel on the 1-hour frame and is expected to break and continue upward.
We have a trend to stabilize above the 100 moving average once again.
We have a downtrend on the RSI indicator that supports the upward move with a breakout.
We have a support
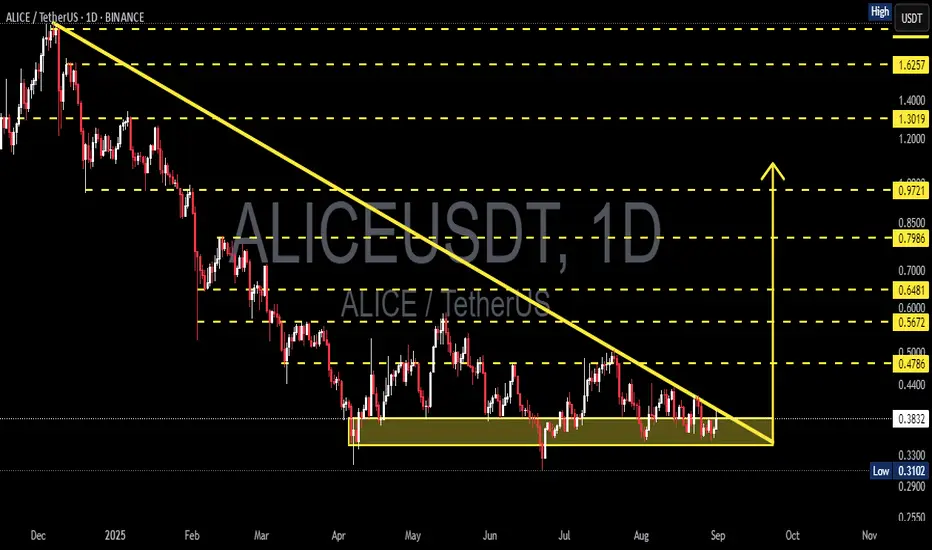
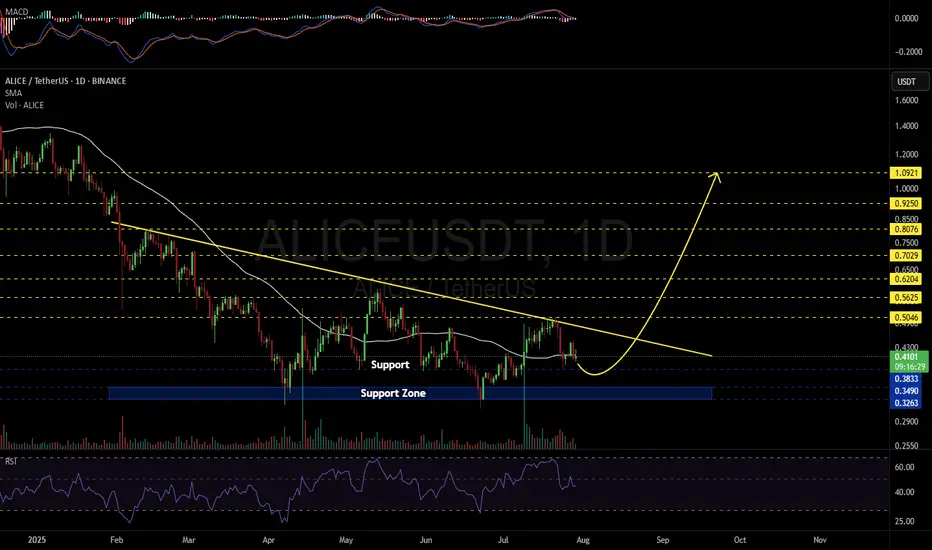
ALICE/USDT — Descending Triangle at Demand Zone!ALICE/USDT has been trapped in a mid-term downtrend since early 2025, consistently forming lower highs along a descending trendline. Despite the bearish pressure, price has repeatedly defended the 0.34–0.39 demand zone (yellow box) since May, creating a strong support base.
This consolidation has n
ALICEBINANCE:ALICEUSDT
#ALICE/ USDT
Entry range (0.3600- 0.3850)
SL 1D close below 0.34
T1 0.44
T2 0.53
T3 0.71
**** This coin has a great targets , but it is only the beginning ****
_______________________________________________________
Golden Advices.
********************
* collect the coin slowl

ALICE MAINNET ON WAY - PRICE CAN MOON TO $1.97ALICE is interesting coin to follow as swing, the price action can show new targets for the upcoming time.

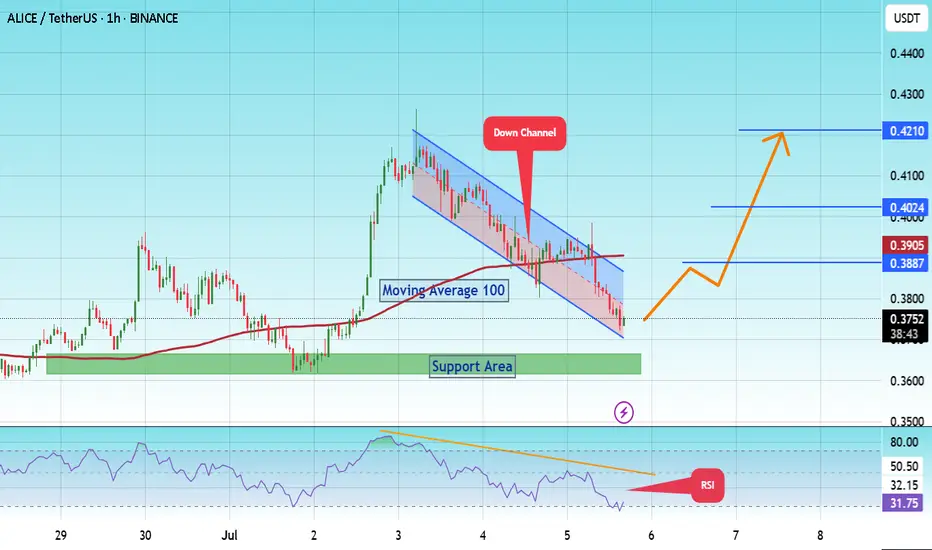
#ALICE/USDT Ready to go higher !#ALICE
The price is moving within an ascending channel on the 1-hour frame, adhering well to it, and is on track to break it strongly upwards and retest it.
We have support from the lower boundary of the ascending channel, at 3888.
We have a downtrend on the RSI indicator that is about to break a
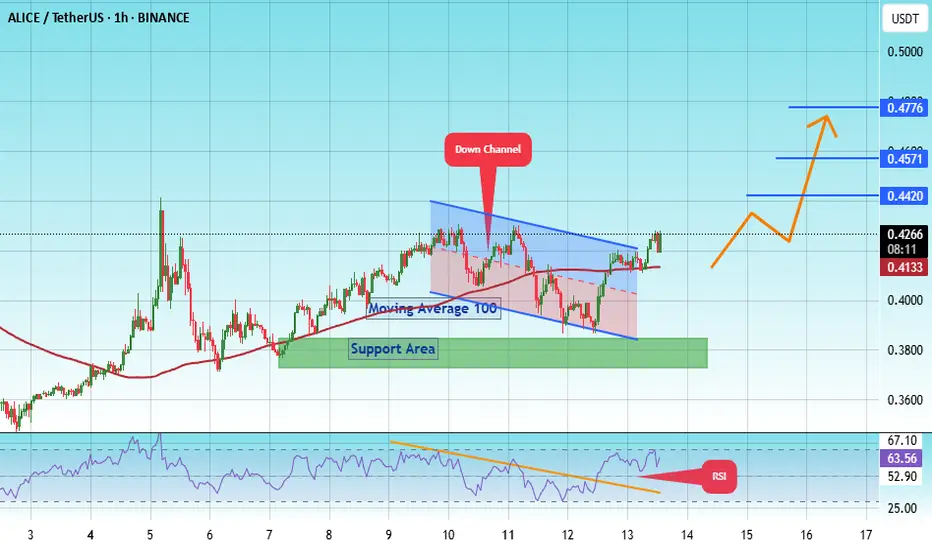
#ALICE/USDT Ready to go higher#ALICE
The price is moving within a descending channel on the 1-hour frame and is expected to break and continue upward.
We have a trend to stabilize above the 100 moving average once again.
We have a downtrend on the RSI indicator that supports the upward break.
We have a support area at the lo
ALICEUSDT Forming Descending ChannelALICEUSDT is currently trading within a descending channel pattern, a classic technical structure that often precedes a significant bullish reversal. This pattern forms when price action is contained between two downward-sloping parallel lines, signaling a gradual downtrend. However, these channels
Alice Correction Ends Eyes on Accumulation ZoneAliceUSDT has fully completed its corrective wave structure, with price reacting near a key demand level. The current range offers an ideal accumulation opportunity as we anticipate a fresh impulsive wave. Follow the charted setup and entry guide for precise execution. Share your views in the commen

ALICE/USDT – Will It Rebound from Demand Zone or Break Down?🧭 Analysis Summary:
ALICE is at a critical turning point, once again testing a historical demand zone that has provided strong support since Q2 2025. The current price action suggests potential accumulation, setting the stage for a significant move — either a powerful bounce or a devastating breakd

ALICEUSDT 1D#ALICE is moving inside a descending triangle on the daily chart. It’s currently trading below the moving averages, and the RSI suggests the potential for a retest of the $0.3833 support level or even the broader support zone marked on the chart.
📌 The best areas to place buy orders are near these
See all ideas
Summarizing what the indicators are suggesting.
Oscillators
Neutral
SellBuy
Strong sellStrong buy
Strong sellSellNeutralBuyStrong buy
Oscillators
Neutral
SellBuy
Strong sellStrong buy
Strong sellSellNeutralBuyStrong buy
Summary
Neutral
SellBuy
Strong sellStrong buy
Strong sellSellNeutralBuyStrong buy
Summary
Neutral
SellBuy
Strong sellStrong buy
Strong sellSellNeutralBuyStrong buy
Summary
Neutral
SellBuy
Strong sellStrong buy
Strong sellSellNeutralBuyStrong buy
Moving Averages
Neutral
SellBuy
Strong sellStrong buy
Strong sellSellNeutralBuyStrong buy
Moving Averages
Neutral
SellBuy
Strong sellStrong buy
Strong sellSellNeutralBuyStrong buy
Displays a symbol's price movements over previous years to identify recurring trends.