Alice condition!!!Alice after touching our first target,now has reached to the last major support,We expect Alice to be able to maintain this area of support unless something special happens
ALICEUSDT.P trade ideas

Alice can give you an Unbelievable Profit!At first, in short term it is bearish and you can put your buy order at 20.7
Then, in mid term it is most probabely bullish
I strongly recommend you to even keep this token till Jan/Feb as it has 3 events on 31 Dec and 4 events on 31 Jan
but make it risk free
Please, buy Alice token for only 5-10% of your fund that you want to invest in crypto
Alice:
Start small, then grow your farmland into a booming business on blockchain. My Neighbor Alice is a multiplayer builder game, introducing blockchain to millions of players. Anyone can buy and own virtual islands, collect and build exciting items and meet new friends.

Alice has touched our first target!!From our calling for buying alice until now we has taken 23% profit in just two days, it's amazing 💪💪,now alice has came back to the major support and it is reloading for next target (34)...Targets will be updated according to status.

BULLISH MOMENTUM ON ALICE/USDTMy set up for ALICE as bullish signals signifies incoming breakout.
Trade with caution and see you at the top


ALICEAlice is at the first of third Eliot wave , I longed today and I will risk free when price hit to 15$ , and maybe close at 16$/17$ , it is safe I think , good luck

ALICE, break through the resistance level.The following content is machine translation:
Morphologically, the main rising wave breaks through the resistance level.
There is almost no resistance from above.
In terms of trading volume, it was in the state of collecting chips in the early stage, then washing the plate, collecting chips again, and then pulling up.
The goal is more than that, there is no resistance in the large space above, and there are many back steps.


MyNeighborAlice Gamers It Is Your Turn!MyNeighborAlice (ALICEUSDT) seems ready for a new uptrend rally + high targets.
Indicators:
▫️ Bollinger Bands Squeeze.
▫️ EMA20-50 are now positioned on the daily candle.
▫️ Triangle Breakout by North, then South, and again North!
Have a Nice Weekend and Stay Safe, everyone.

ALICE- Major Resistance Breakout!
ALICEUSDT (1D Chart) Technical analysis
ALICEUSDT (1D Chart) Currently trading at $25.60
Buy level :Above $24
Stop loss: Below $17.20
TP1: $31
TP2: $37
TP3: $43
TP4: $50
Max Leverage 2x
Always keep Stop loss
Follow Our Tradingview Account for More Technical Analysis Updates, | Like, Share and Comment Your thoughts.

ALICEUSDTTriangle patterns
break the triangle and closed above it the target will be :
Target 1 : 15 usd
Target 2 : 19 usd
Target 3 : 24 usd
Target 4 : 35 usd
Triangle patterns are important because they help indicate the continuation of a bullish or bearish market. Usually with a triangle pattern, the price consolidation period consists of higher lows and lower high, forming the shape of a "triangle" when the resistance and support lines converge towards each other.


Alice as i said!!!Alice has broken its resistance and now it is reloading for a good rising.... don't miss this big moment

ALICEUSDT DAlice's popular currency is completing the crab pattern in daily timeframes. In case of growth of the specified target, we consider it....Invest in the future

ALICE bull and bear scenariosHello everyone, hope you doing good.
* This is not a financial advice, use the idea with your own strategy and risk management *
Few days ago, I wrote an idea about ALICE and shared with you a great setup ( Hope you didn't miss that one )
as we reached target 4, now we have to figure out whats the next move, as you can see in the chart below, we have a trend line that price has been rejected many times before and we are getting closer to it, two scenarios are also drawn on the chart below :
1. Green arrow = Bullish scenario : in which we break out of this level and since there is no actual resistance I think we will have a ride to ATH
2. Red arrow = Bearish scenario : in which we will get rejected once again and have a ride toward bottom
be patient, watch how price will re act to some certain levels, if you saw weakness it would probably mean that we are going to go down, but if we broke the trend line with a good bull candle, its most likely a bull market.
good luck !
I'm writing about most of crypto currencies;
Follow me on TRADINGview so you wouldn't miss out any updates.
Like if you think this was helpful and let me know on the comment section below.
* This is not a financial advice, use the idea with your own strategy and risk management *

%170 RUN IS STARTING FOR ALICEALICE is the one of the low cap game tokens in market. There is a good basic triangle structure but rather than we cann see really nice upward channel. I expect this move in short term. For long term my ALICE expectation more than %400. Let's see!

Alice Correction is possibleALICEUSDT looking bearish in short term for short term traders. Fib with Cup & Handle are above for further guidelines. Take your trades with absolute care. Good Luck!

Alice Short Term Short trade #ALICE Correction Point 19.41 first support at 22 if it break then for the correction you can see around at 19.41
Take Entry on Support and exit on Resistance

ALICE technical analysis - Daily chart -Hello traders, hope you doing well.
* This is not a financial advice, use the idea with your own strategy and risk management *
Alice broke the green trend line ( uptrend ) and from there, formed a channel that we are currently in, by breaking this channel, there are targets on chart based on which side will break;
Red lines are short targets ( if we break the bottom ) * Which I don't think will happen *
Green lines are long targets ( if we break the top )
I'm writing about most of crypto currencies;
Follow me on TRADINGview so you wouldn't miss out any updates.
Like if you think this was helpful and let me know on the comment section below.
* This is not a financial advice, use the idea with your own strategy and risk management *

alice / usdt chartrsi divergence and momentom loss happened for short term
after correction i think bullish run will strat...good entry at support after some correction
good for hold
targets shown at chart

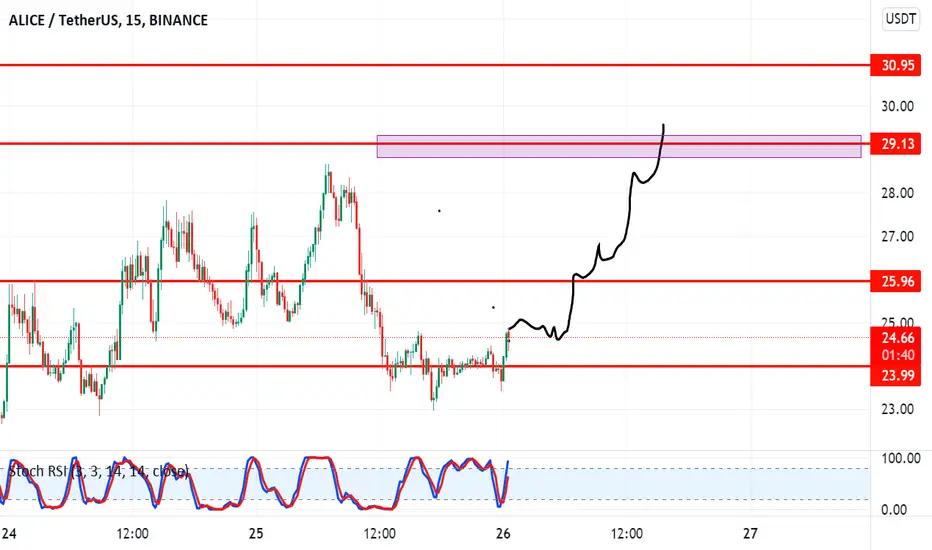
ALICEUSDTthis is the price movements of ALICE if the candles matches the previous pump
but if the price can break the Current Resistance right now, i think ALICE still have an opportunity to continue pump to 28.8 Dollar tho
Trade safely.

ALICE/USD, 3D, Longon the 3-day timeframe, we can enjoy how the inverse head and shoulders pattern going to make a fake breakout but already transformed into a Rising Wedge pattern ...
the chart shows the levels of support and resistance
also there is still dependence on significant movements in the price of bitcoin
