SPY 15M | Structural Inflection at $696 — Pullback Before BreakoSPY 15M | Structural Inflection at $696 — Pullback Before Breakout
SPY rejected the $696.01 resistance twice and is fading into the close at $693.43. The structure is clear: this level needs to break, but it won't do it on the first attempt.
Key Levels:
🔴 $715.69 — Major overhead resistance (targe
Key stats
About SPDR S&P 500 ETF TRUST
Home page
Inception date
Jan 22, 1993
Structure
Unit Investment Trust
Replication method
Physical
Dividend treatment
Distributes
Distribution tax treatment
Qualified dividends
Income tax type
Capital Gains
Max ST capital gains rate
39.60%
Max LT capital gains rate
20.00%
Primary advisor
SSgA Funds Management, Inc.
Distributor
ALPS Distributors, Inc.
Identifiers
3
ISIN US78462F1030
SPDR S&P 500 ETF Trust is an Exchange traded fund. The fund seeks to provide investment results that, before expenses, correspond generally to the price and yield performance of the S&P 500® Index. The S&P 500® Index is composed of five hundred selected stocks. SPDR S&P 500 ETF Trust was founded on January 22, 1993 and is headquartered in New York, NY.
Related funds
Classification
What's in the fund
Exposure type
Electronic Technology
Technology Services
Finance
Stock breakdown by region
Top 10 holdings

Quick Short Idea $SPYMarkets are looking weak and can go down.
Trade Plan:
Short Entry - 695.00
Target - 693.50
Stop Loss - 695.75

To 700 or Not To 700? OBV Might Be The ClueEdit: Sorry for the jank chart on the front of this idea, I didn't realize the view I had when I published this idea would be the main one for this idea. Anyway...
I ran upon an indicator new to me, and just thought I'd manifest my observations and thoughts on this interesting indicator. Here's wh

SPY: Trade seup0.618-1.618 confluce showing up on the chart. Closely monitoring the pivot, inflection etc.

SPY – Feb 11 Market Preview: Compression Before ExpansionSPY spent the session consolidating just under the 696–697 resistance zone after the strong recovery off 670s earlier this week. The structure on the 15m remains constructive, but momentum has clearly slowed. This is no longer expansion — this is positioning.
We are sitting inside a tight value pock

SPY: Week of Feb 17🥱
Most boring market yet.
I haven't updated since the beginning of the year because I have been waiting for the market to make its move. But alas, it has chosen to be aggressively mean reverty and ranging.
Because of this, I will hone in on the short term for now. In the chart are the weekly le

SPY LOCAL SHORT|
✅SPY rejected 1H supply with strong bearish displacement, sweeping buy-side liquidity before shifting structure lower. Trading in premium zone, expect continuation toward discount imbalance and sell-side liquidity near target. Time Frame 1H.
SHORT🔥
✅Like and subscribe to never miss a new idea!✅

$SPY & $SPX — Market-Moving Headlines Week of Feb 9–13, 2026🔮 AMEX:SPY & SP:SPX — Market-Moving Headlines Week of Feb 9–13, 2026
🌍 Market-Moving Themes
🧠 AI Capex Anxiety Returns
Meta spending leak revives fears that AI margins will lag spending, reopening the hardware vs platform divide
⚙️ Pick-and-Shovel AI Trade
Rising AI budgets continue to funnel

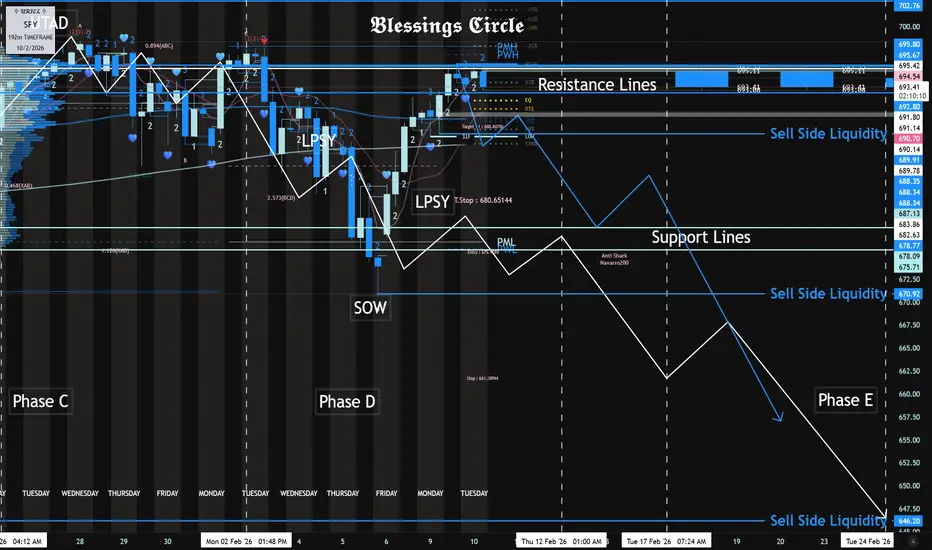
SPY Distribution Schematic Sub 650 by EOMAs Long As 695.80 - 695.67 Resistance Is Respected Today.
The Sells Targets Are As Follows:
SPY Sub 650 by Late Feb.
SPY Sub 600 by End of March.
Part Two:
SPY. Key Decision Zone After Strong Bounce for Feb 9-13What I’m Watching
SPY put in a solid recovery after selling off earlier in the week, but price is now pushing into a zone where things usually slow down. The bounce was clean, momentum improved, and buyers clearly stepped in — but we’re no longer in “easy upside” territory. From here, it’s about wh

See all ideas
Summarizing what the indicators are suggesting.
Oscillators
Neutral
SellBuy
Strong sellStrong buy
Strong sellSellNeutralBuyStrong buy
Oscillators
Neutral
SellBuy
Strong sellStrong buy
Strong sellSellNeutralBuyStrong buy
Summary
Neutral
SellBuy
Strong sellStrong buy
Strong sellSellNeutralBuyStrong buy
Summary
Neutral
SellBuy
Strong sellStrong buy
Strong sellSellNeutralBuyStrong buy
Summary
Neutral
SellBuy
Strong sellStrong buy
Strong sellSellNeutralBuyStrong buy
Moving Averages
Neutral
SellBuy
Strong sellStrong buy
Strong sellSellNeutralBuyStrong buy
Moving Averages
Neutral
SellBuy
Strong sellStrong buy
Strong sellSellNeutralBuyStrong buy
Displays a symbol's price movements over previous years to identify recurring trends.
Frequently Asked Questions
An exchange-traded fund (ETF) is a collection of assets (stocks, bonds, commodities, etc.) that track an underlying index and can be bought on an exchange like individual stocks.
SPY trades at 681.75 USD today, its price has risen 0.07% in the past 24 hours. Track more dynamics on SPY price chart.
SPY net asset value is 681.72 today — it's fallen 1.94% over the past month. NAV represents the total value of the fund's assets less liabilities and serves as a gauge of the fund's performance.
SPY assets under management is 702.06 B USD. AUM is an important metric as it reflects the fund's size and can serve as a gauge of how successful the fund is in attracting investors, which, in its turn, can influence decision-making.
SPY price has fallen by −1.85% over the last month, and its yearly performance shows a 11.77% increase. See more dynamics on SPY price chart.
NAV returns, another gauge of an ETF dynamics, have risen by −1.94% over the last month, have fallen by −1.94% over the last month, showed a 0.09% increase in three-month performance and has increased by 13.12% in a year.
NAV returns, another gauge of an ETF dynamics, have risen by −1.94% over the last month, have fallen by −1.94% over the last month, showed a 0.09% increase in three-month performance and has increased by 13.12% in a year.
SPY fund flows account for −6.13 B USD (1 year). Many traders use this metric to get insight into investors' sentiment and evaluate whether it's time to buy or sell the fund.
Since ETFs work like an individual stock, they can be bought and sold on exchanges (e.g. NASDAQ, NYSE, EURONEXT). As it happens with stocks, you need to select a brokerage to access trading. Explore our list of available brokers to find the one to help execute your strategies. Don't forget to do your research before getting to trading. Explore ETFs metrics in our ETF screener to find a reliable opportunity.
SPY invests in stocks. See more details in our Analysis section.
SPY expense ratio is 0.09%. It's an important metric for helping traders understand the fund's operating costs relative to assets and how expensive it would be to hold the fund.
No, SPY isn't leveraged, meaning it doesn't use borrowings or financial derivatives to magnify the performance of the underlying assets or index it follows.
In some ways, ETFs are safe investments, but in a broader sense, they're not safer than any other asset, so it's crucial to analyze a fund before investing. But if your research gives a vague answer, you can always refer to technical analysis.
Today, SPY technical analysis shows the sell rating and its 1-week rating is buy. Since market conditions are prone to changes, it's worth looking a bit further into the future — according to the 1-month rating SPY shows the buy signal. See more of SPY technicals for a more comprehensive analysis.
Today, SPY technical analysis shows the sell rating and its 1-week rating is buy. Since market conditions are prone to changes, it's worth looking a bit further into the future — according to the 1-month rating SPY shows the buy signal. See more of SPY technicals for a more comprehensive analysis.
Yes, SPY pays dividends to its holders with the dividend yield of 1.07%.
SPY trades at a premium (0.00%).
Premium/discount to NAV expresses the difference between the ETF’s price and its NAV value. A positive percentage indicates a premium, meaning the ETF trades at a higher price than the calculated NAV. Conversely, a negative percentage indicates a discount, suggesting the ETF trades at a lower price than NAV.
Premium/discount to NAV expresses the difference between the ETF’s price and its NAV value. A positive percentage indicates a premium, meaning the ETF trades at a higher price than the calculated NAV. Conversely, a negative percentage indicates a discount, suggesting the ETF trades at a lower price than NAV.
SPY shares are issued by State Street Corp.
SPY follows the S&P 500. ETFs usually track some benchmark seeking to replicate its performance and guide asset selection and objectives.
The fund started trading on Jan 22, 1993.
The fund's management style is passive, meaning it's aiming to replicate the performance of the underlying index by holding assets in the same proportions as the index. The goal is to match the index's returns.