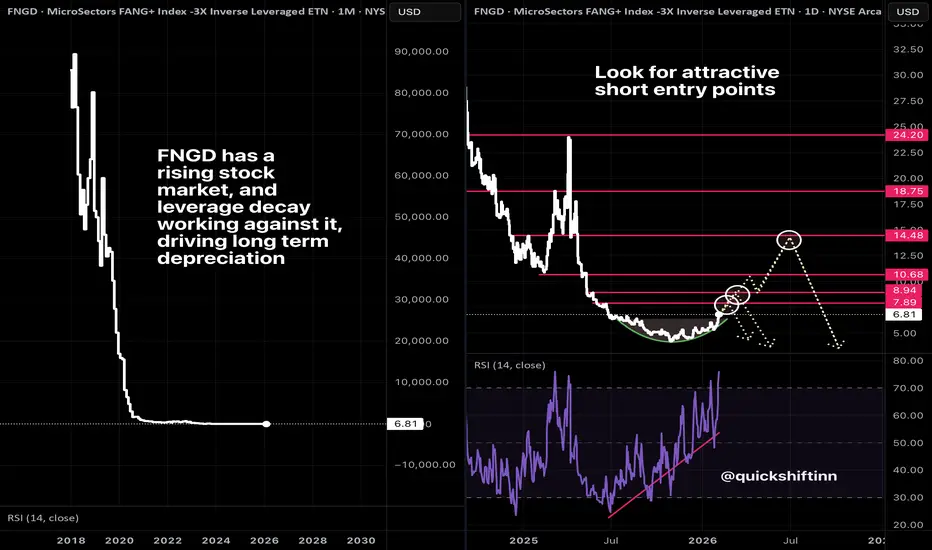
Still believe in big tech? Short $FNGDThe tech sell-off may not be done yet, but if you're starting to think about how to play it, I've got a setup for you to consider -- short $FNGD.
This is part of a theme I trade which roughly to short leveraged ETFs to capitalize on the underlying decay .
As you can see on the left chart here, a
MicroSectors FANG Index -3X Inverse Leveraged ETNs due January 8, 2038
No trades
Key facts today
Key stats
About MicroSectors FANG Index -3X Inverse Leveraged ETNs due January 8, 2038
Home page
Inception date
Jan 22, 2018
Structure
Exchange-Traded Note
Distribution tax treatment
No distributions
Income tax type
Capital Gains
Max ST capital gains rate
39.60%
Max LT capital gains rate
20.00%
Identifiers
3
ISIN US06368M2035
FNGD offers 300% daily inverse exposure to an index of FANG companies (Facebook, Apple, Amazon, Netflix, and Google [Alphabet Inc.]), and other companies that exhibit similar characteristics. Presumably, the index will always include these five companies, an index committee is responsible for selecting the additional names. Eligible stocks must be listed on a US exchange (although ADRs are acceptable), classified in either the technology or consumer discretionary sectors, and exhibit similar traits to other technology and internet companies. At least ten stocks must be included in the index, the number it held when the note launched so investors can expect a high level of concentration. All holdings are equally weighted. As a geared product with daily resets of exposure, FNGD is designed as short-term trading tool and not a long-term investment vehicle. Long-term returns could materially differ from those of the underlying index due to daily compounding.
Related funds
Classification

Short term play idea: FNGD on the 4H ChartI'm entering a long position in FNGD today at market open using 60% of my equity.
Why:
RSI momentum positive.
RSI about to cross 55. I consider he path between 55 and 70 an ideal long.
FNGD is sitting on 8,13 and 21 period EMAs providing possible support.
Stop Loss:
4%
Will move up manually is it

FNGD retrace to $8.50 before target of $10.51, coil/fakeout/pumpFNGD to go back down to $8.50 before target of $10.51 Nxt
I'm expecting a little retracement back to $8.51 with buy limits set from 8.88 down to 8.51
Take Profits at $10.17 and $10.51
Expect to retrace again and coil up. People will be talking about bears taking over, but the Santa rally will che

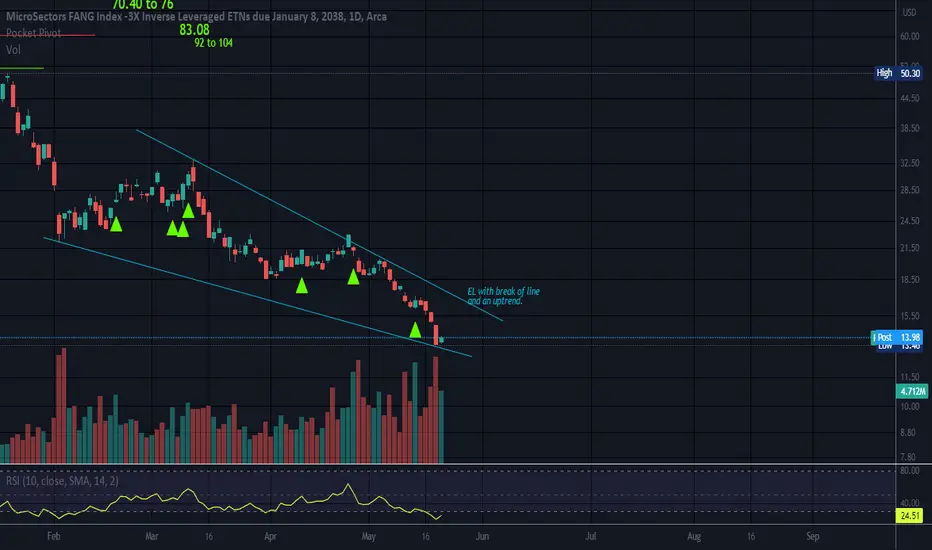
Bottom FishingAt an all time low. Leveraged x3 so can be very volatile. This ETF SHORTS the FANG stocks. Not an ETF to fool around with or stay too long as it consists of some very strong momentum stocks. Top ten holdings below.
Falling Wedge noted. Both lines slope down and converge at the apex.
Falling we
FNGD possible 47.5Possible. Could happen, good opp to take trade.
I will sell after 4 weeks or 8 depending breadth
soxs too

buy heregood setup, exhaustion candle, bottom of range, could actually double. LABD did 50% from this type of setup, so shorts are working

FNGD IMPLIES TECH IS BULLISHThere is one gap, and one weak trend holding up this pump. TBH, in about 90% of cases I've seen, this weak trend won't hold up, and should favor the downside. This means that tech should be bullish in the upcoming week. With the current market, we can't really know how long that will last, but I ass

follow the trend or not what do think ?seems like we going back down again , follow the trend or not what do think ?

ABC Bullish/TECS is also ABC/DLeveraged and Volatile.
This also measures out to be a Cypher if the final leg of the M pattern does not go too far below D, which is also C of the ABC Bullish pattern.
Cypher pattern is in yellow and shares the 1st leg with the ABC Pattern. Target for the ABC pattern would be D.
MicroSectors FAN

See all ideas
Summarizing what the indicators are suggesting.
Oscillators
Neutral
SellBuy
Strong sellStrong buy
Strong sellSellNeutralBuyStrong buy
Oscillators
Neutral
SellBuy
Strong sellStrong buy
Strong sellSellNeutralBuyStrong buy
Summary
Neutral
SellBuy
Strong sellStrong buy
Strong sellSellNeutralBuyStrong buy
Summary
Neutral
SellBuy
Strong sellStrong buy
Strong sellSellNeutralBuyStrong buy
Summary
Neutral
SellBuy
Strong sellStrong buy
Strong sellSellNeutralBuyStrong buy
Moving Averages
Neutral
SellBuy
Strong sellStrong buy
Strong sellSellNeutralBuyStrong buy
Moving Averages
Neutral
SellBuy
Strong sellStrong buy
Strong sellSellNeutralBuyStrong buy
Displays a symbol's price movements over previous years to identify recurring trends.
Frequently Asked Questions
An exchange-traded fund (ETF) is a collection of assets (stocks, bonds, commodities, etc.) that track an underlying index and can be bought on an exchange like individual stocks.
FNGD trades at 65.21 USD today, its price has risen 2.07% in the past 24 hours. Track more dynamics on FNGD price chart.
FNGD net asset value is 65.13 today — it's risen 24.23% over the past month. NAV represents the total value of the fund's assets less liabilities and serves as a gauge of the fund's performance.
FNGD assets under management is 93.44 M USD. AUM is an important metric as it reflects the fund's size and can serve as a gauge of how successful the fund is in attracting investors, which, in its turn, can influence decision-making.
FNGD price has risen by 22.12% over the last month, and its yearly performance shows a −43.74% decrease. See more dynamics on FNGD price chart.
NAV returns, another gauge of an ETF dynamics, showed a 46.66% increase in three-month performance and has decreased by −43.09% in a year.
NAV returns, another gauge of an ETF dynamics, showed a 46.66% increase in three-month performance and has decreased by −43.09% in a year.
FNGD fund flows account for 15.43 M USD (1 year). Many traders use this metric to get insight into investors' sentiment and evaluate whether it's time to buy or sell the fund.
Since ETFs work like an individual stock, they can be bought and sold on exchanges (e.g. NASDAQ, NYSE, EURONEXT). As it happens with stocks, you need to select a brokerage to access trading. Explore our list of available brokers to find the one to help execute your strategies. Don't forget to do your research before getting to trading. Explore ETFs metrics in our ETF screener to find a reliable opportunity.
FNGD expense ratio is 0.95%. It's an important metric for helping traders understand the fund's operating costs relative to assets and how expensive it would be to hold the fund.
FNGD is an inverse fund, meaning it's structured to generate returns opposite to the trends of the underlying index or assets.
In some ways, ETFs are safe investments, but in a broader sense, they're not safer than any other asset, so it's crucial to analyze a fund before investing. But if your research gives a vague answer, you can always refer to technical analysis.
Today, FNGD technical analysis shows the buy rating and its 1-week rating is neutral. Since market conditions are prone to changes, it's worth looking a bit further into the future — according to the 1-month rating FNGD shows the neutral signal. See more of FNGD technicals for a more comprehensive analysis.
Today, FNGD technical analysis shows the buy rating and its 1-week rating is neutral. Since market conditions are prone to changes, it's worth looking a bit further into the future — according to the 1-month rating FNGD shows the neutral signal. See more of FNGD technicals for a more comprehensive analysis.
No, FNGD doesn't pay dividends to its holders.
FNGD trades at a premium (0.13%).
Premium/discount to NAV expresses the difference between the ETF’s price and its NAV value. A positive percentage indicates a premium, meaning the ETF trades at a higher price than the calculated NAV. Conversely, a negative percentage indicates a discount, suggesting the ETF trades at a lower price than NAV.
Premium/discount to NAV expresses the difference between the ETF’s price and its NAV value. A positive percentage indicates a premium, meaning the ETF trades at a higher price than the calculated NAV. Conversely, a negative percentage indicates a discount, suggesting the ETF trades at a lower price than NAV.
FNGD shares are issued by Bank of Montreal
FNGD follows the NYSE FANG+ Index. ETFs usually track some benchmark seeking to replicate its performance and guide asset selection and objectives.
The fund started trading on Jan 22, 2018.
The fund's management style is passive, meaning it's aiming to replicate the performance of the underlying index by holding assets in the same proportions as the index. The goal is to match the index's returns.