$IWM — The Rate-Cut Leverage PlayLast week delivered one of those classic market paradoxes where everything that should be bearish suddenly became bullish:
layoffs → bullish
weak labor data → bullish
flat inflation → bullish
Why?
Because the market has now fully locked its focus on one thing only:
a Federal Reserve rate cut.
Volatility was sharp, price action even sharper, and the headlines kept flipping faster than most traders could adjust.
Let’s break down what actually happened — and what matters for the week ahead.
IWM GEX for 01/16/2025 expiration using TanukiTrade Options Overlay GRID System and the GEX Profile indicator
If the Fed cuts, small caps win the most — and last week proved it again.
IWM broke above the 250 call gamma level
Short-term gamma squeeze potential
Closed at new all-time highs
This is where rate-cut optimism expresses itself with maximum torque.
If the Fed turns dove on Wednesday → IWM can easily extend.
Trade ideas

IWM can go up more than you expectWe have here a cup and handle pattern that will send AMEX:IWM to the moon
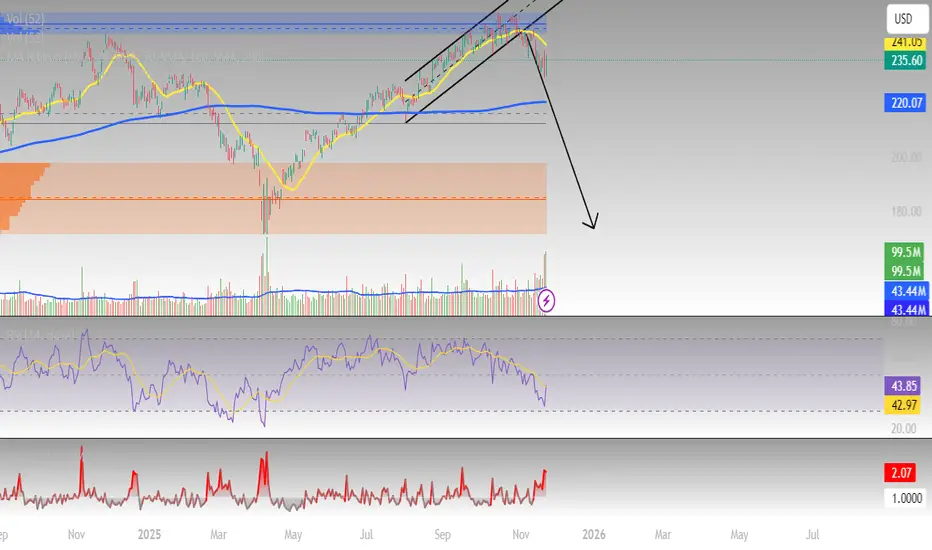
Russel Short- The price is testing a strong horizontal resistance zone around 252–253 after several attempts : TRIPLE TOP.
- Recent pushes into this resistance show high selling volume compared with relatively weak buying volume.
- Buyers are losing strength at the top.
-Since October the relative volume is dominant on the sell side.
- A potential scenario drawn on the chart following strong support / resistance zones.

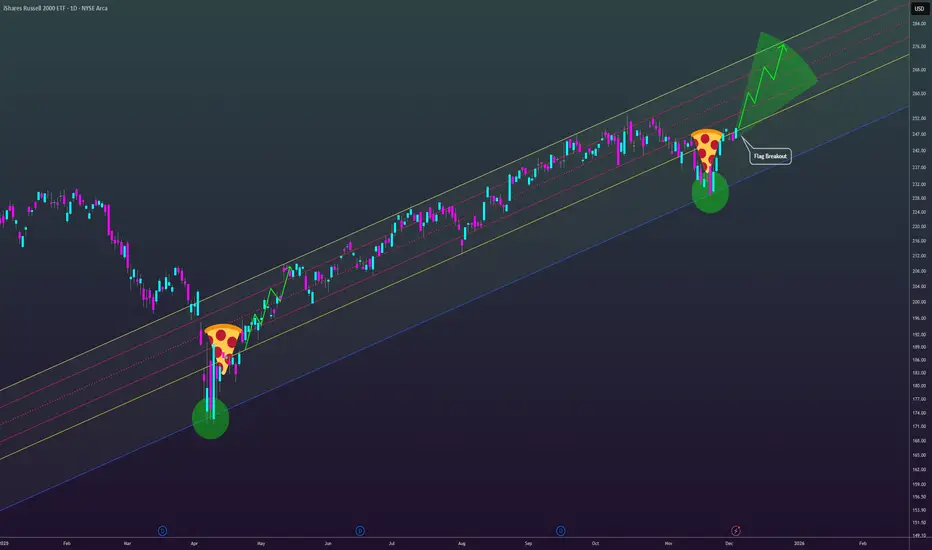
Pizza Slice RecoverySmall Caps could be the big play going into end of the year. A real strong rate cut environment is going to benefit small caps more than large caps; today's negative ADP report for small business could be the ignition.
This 2025 channel since the liberation day sell off is providing a pathway to high 200s for IWM with a V-shaped (pizza slice) recovery complete. Pay attention to the FOMC meeting on Dec 10th.
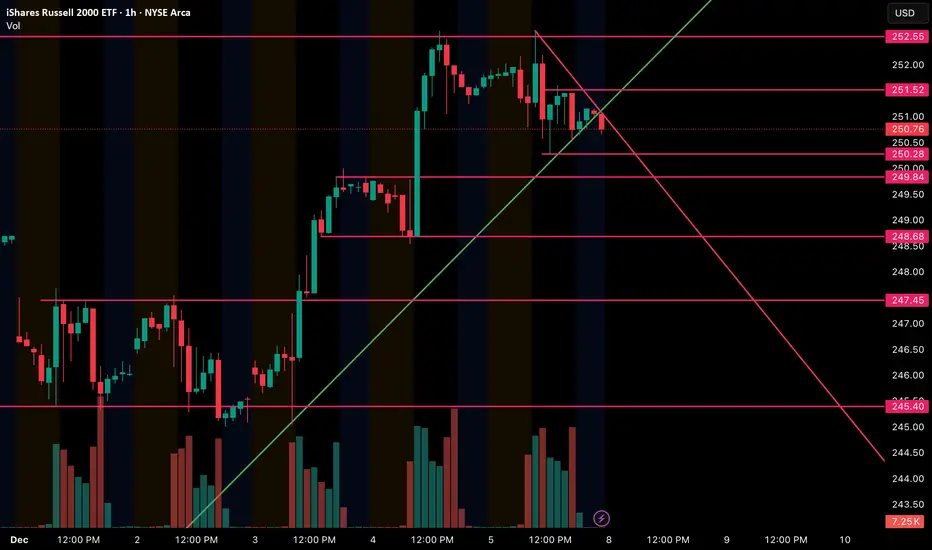
IWM Rejection of all time highs to grab liquidity at lows.IWM going into tomorrow my overall bias would be bearish.
- There is a break of the upward trendline which price has previously respected 3 times.
- Looking at the EMAs they have also crossed signaling the start of downtrend.
- Starting to reject the highs on the daily forming a triple top (this can also be simply a pullback for a continuation higher but my overall bias does not align with this as on the hourly we tested it twice and failed to break higher)
I would like to take entry at the break and retest off a key level. i.e. S/R, PML, PMH, Previous session low, or a bounce of this downward trendline I have drawn. We failed to break ATH so we are coming back down to grab some liquidity at the lows.
Targets:
249.82
248.68
247.45
245.40
Idea is invalid if we reclaim this upward trendline (holds above 251.23)
Hello trader, for today's pre-market real-time update: IWM: 251.This was the result of trading on Russell. It opened above the target price of 254.00, finding resistance at 252.00 (a triple top). As we explained, it could bounce in the 250.00 zone. At this time, it is not advisable to short, as the price has remained sideways.

IWM Enters Correction Phase Following Impulsive AdvanceThe cycle from the April 2025 low in the Russell 2000 ETF (IWM) remains active. It is unfolding as a five‑wave impulse. Wave ((4)) of this sequence concluded at 228.18, as shown on the 45‑minute chart. From that level, the ETF advanced into wave ((5)). A decisive break above the prior wave ((3)) peak at 252.77, recorded on 15 October, is still required. Without that break, the risk of a double correction remains. Yet the rally from wave ((4)) has displayed impulsive traits, which favor continued upside momentum.
From wave ((4)), the initial advance in wave 1 terminated at 237.11. A modest retracement in wave 2 ended at 235.18. The ETF then nested higher into wave 3. Within this third wave, wave ((i)) completed at 240.44. The pullback in wave ((ii)) ended at 239.24. The instrument extended upward in wave ((iii)) to 245.97. A brief decline in wave ((iv)) ended at 244.77. The final leg, wave ((v)), reached 248.82, completing wave 3 of higher degree.
A corrective wave 4 followed, pulling back to 247. The ETF then rallied again in wave (5) to 248.99, which finalized wave (1). At present, a pullback in wave (2) is unfolding. This correction addresses the cycle from the 21 November low before the next upward phase resumes. In the near term, as long as the pivot at 228.18 remains intact, the expectation is for the pullback to locate support within a 3, 7, or 11 swing sequence. That support should set the stage for renewed strength.

IWM Weak Move Detected: No Signal, But Downside Risk IdentifiedIWM QuantSignals Katy 1M Prediction 2025-12-05
QuantSignals Katy AI Stock Analysis
Analyzed 1 stock(s): IWM
IWM Analysis
Current Price: $251.46
Final Prediction: $251.70 (+0.10%)
30min Target: $251.87 (+0.16%)
Trend: NEUTRAL
Confidence: 51.5%
Volatility: 3.5%
No trade signal generated (insufficient confidence/move size)
Summary: Generated 0 trade signals from 1 successful analyses out of 1 symbols.

ResistanceLong shadow(wick) candles are forming around the key level $244. Bulls need a strong close next month above that key level to increase the probability of their bullish march. If price closes below key level with volume keep and eye on possible Fib levels below.

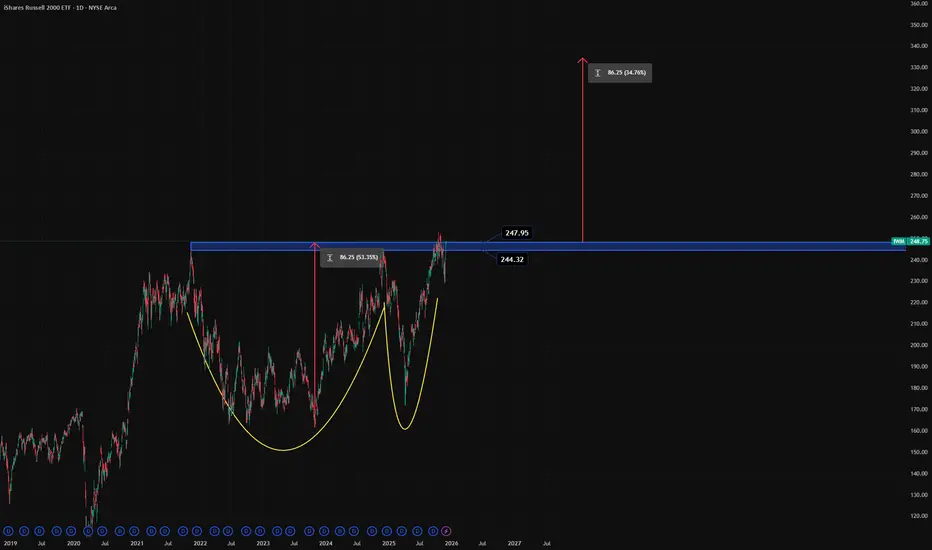
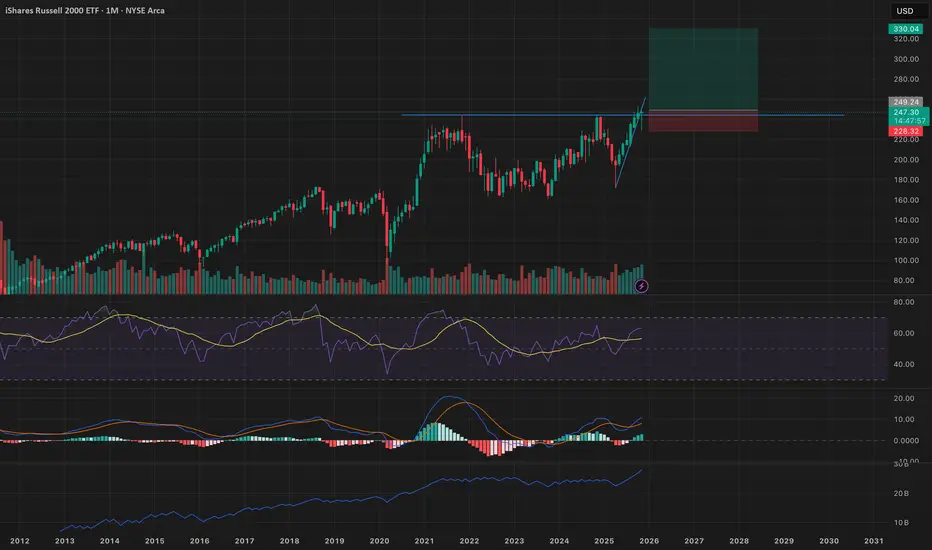
$IWM-The lagger will be the leaderZoom out here and see this giant cup and handle.
OBV has broken out, preceding price.
Decreased rates influence small businesses the most. The impact has lagged, but it is now ready to run.
The breakout target is 330
Strong monthly candle. May see a slow start to the month after the run up we had over the last week, but by mid next month into Q2 2026 you will see this run 40%.
AMEX:SPY NASDAQ:QQQ AMEX:IWM
Quant Signals V3 IWM– Bearish SetupInstrument: IWM
Signal Type: Weekly
Expiry: 2025-12-05 (7 days)
Direction: BUY PUTS
Confidence: 60% (Low Conviction)
Strike Focus: $245.00
Entry Range: $0.88
Target 1: $1.70 (≈93% gain)
Stop Loss: $0.43 (≈50% risk)
Weekly Momentum: NEUTRAL (-0.01% 1W)
Flow Intel: Neutral | PCR 1.13
Katy AI Prediction: Bearish, target $242.20 (-2.5% from current)
Risk Level: HIGH – Weekly expiry with gamma risk; Friday expiration requires small position sizing
Analysis Summary:
Katy AI shows a downward trajectory from $248.40 → $238.30 over the next 7 days.
Technicals: Price near weekly high; MACD bearish divergence; volume 4.5× average indicating distribution.
News: Mixed; small caps and pharma outperform, IWM relative weakness.
Options Flow: Slight bearish bias (PCR 1.13), institutional hedging observed.
Positioning Recommendation:
Entry Price: $0.88
Target 1: $1.70
Stop Loss: $0.43
Position Size: Keep small due to high gamma risk

$IWM Breakout or Breakdown?IWM shows this week we are up against strong Gann resistance. Will be interesting to see if the Fed can "trigger" a breakout. Either way, prepare for #Volatility this week. Crypto and Altcoins depend on it

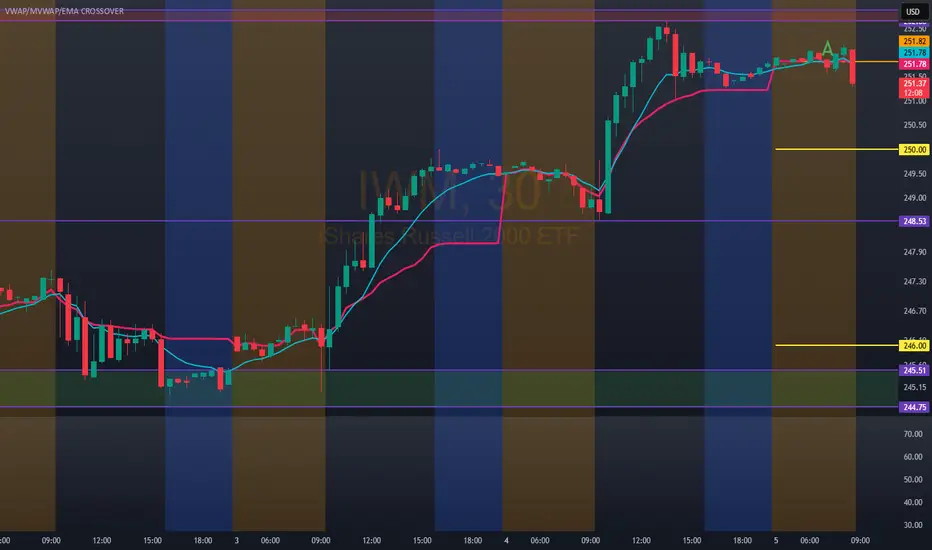
Hello trader, for today's pre-market real-time IWM:252.00We will enter a bullish position above 254.00 with great caution, as today is Friday. It closed yesterday with a positive candle on the daily chart. If we open with an upward gap, it would be a gap-retest one.
On the other hand, we have a technical bearish entry at 250.00. Note that this price could be used as a bounce, but if it's bearish, it will likely target the 246.00 area, a potential reversal price. Happy trading!
Small Caps Are Entering Their Next Expansion PhaseThesis
Small caps have materially lagged the broader market for two years while capital crowded into mega caps and AI leaders. That phase is now ending. The macro backdrop is shifting, and the price structure across the higher timeframes shows the early development of a new expansion cycle.
Macro Backdrop
Rate cuts are expected as inflation cools and growth stabilizes. Small caps benefit more than any other equity class when financing costs fall because they carry higher leverage and have shorter debt cycles. Lower rates directly lift margins and earnings outlooks.
Foreign investment flows into the United States remain strong. Over the past year most of that flow was absorbed by a handful of large names. When that segment becomes extended, capital naturally rotates down the market cap ladder. This is the exact setup taking place now.
Earnings across smaller companies have quietly turned higher. Revenue revisions have stabilized, and cost pressure is easing. With rate relief approaching, profitability spreads improve faster in small caps than in large caps. Historically this combination of improving fundamentals plus easing financial conditions has led to multi-quarter outperformance.
Technical Structure
The weekly chart shows price breaking above the entire cluster of prior compression bands with multiple strong candles closing above them. That type of reclaim typically marks the beginning of a new trend phase rather than a temporary bounce.
On the same chart, the volume footprint is rising and shows persistent accumulation since the 2024 low. The upward sloping volume trendline confirms steady demand through every pullback.
The multi-wave momentum structure on the weekly chart has flipped from contraction into expansion. This shift generally occurs in the early stage of broader moves that last several months.
On the 3-day chart, price is firmly holding above its prior consolidation zone. Each corrective dip has been absorbed at higher levels, showing strong underlying demand. The volume trend on this timeframe also remains upwards, matching the weekly structure and confirming healthy participation.
Momentum on the 3-day chart mirrors the weekly: prior downside pressure has faded, and the bars are now expanding upward. That is the same setup seen before longer upside cycles in past rotations.
The daily chart provides the clearest confirmation. Price reclaimed multiple stacked levels in one impulsive leg, along with one of the strongest volume days in over a year. Pullbacks have been shallow and immediately bought. There are no signs of distribution.
Overall Structure
Large caps have already completed their expansion wave. Small caps have not. With rate cuts approaching, foreign capital still flowing in, and earnings momentum turning positive, the fundamental and macro drivers now favor small caps.
The multi-timeframe price structure aligns with that backdrop:
Reclaims across all higher timeframes
Expanding momentum after long contraction
Persistent accumulation on volume
No distribution signals on the daily
This is exactly the type of setup that precedes multi-month rotation into smaller names. Small caps remain the last unfinished leg of this cycle, and conditions are in place for that rotation to continue.
Bearish risk remains in a lower high and OBV failing its underside retest

Can crypto catch the rate cut bid?Recently I noticed a falling wedge on an equal-weight crypto basket which can be bullish. However prices resolved sharply lower!
This week is seeing an aggressive increase in Dec Fed rate cut expectations, evidenced by
Bond yields TVC:TNX -- lower
US Dollar fx basket TVC:DXY -- lower
Small cap stocks AMEX:IWM -- higher
The moves haven't all happened in tandem; it looks like bonds were first to price in the rate cut bet. In recent sessions we're starting to see a follow through in Dollar and small cap stock pricing.
Nothing says a rate cut is imminent, but if the market is pricing for that across asset classes, does that make a stronger case for a small ascending triangle in an equal-weight crypto basket?

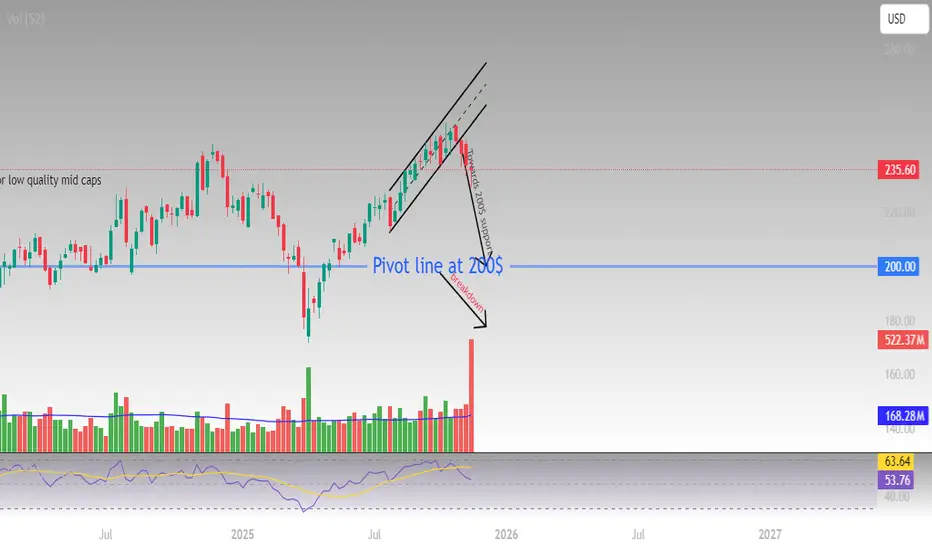
IWM short weekkly confirmation
Seeking confirmation of the IWM short on the weekly
Rising wedge breakdown confirmed on weekly
Key support at $200 could be the floor
Failure at $200 could trigger collapse of low quality stocks
I welcome any constructive criticism on this idea
Analysis of $IWM: Flag Pattern or Breakdown?Overview of AMEX:IWM and the Russell 2000 Index
IWM is an exchange-traded fund (ETF) that tracks the Russell 2000 Index. According to Investopedia, the Russell 2000 is the most widely quoted measure of the overall performance of small-cap to mid-cap stocks. This index represents approximately 7% of the total market capitalization of the Russell 3000 and is composed of the bottom two-thirds of companies in terms of size within the Russell 3000 index. The broader Russell 3000 reflects the movements of nearly 96% of all publicly traded U.S. stocks.
Significance of IWM in Market Analysis
One of the reasons for focusing on this ETF is its role as a market barometer. IWM provides insight into whether small-cap stocks are participating in a broader bull market or lagging. Healthy bullish market continuations typically require participation from small-cap stocks. If small caps underperform, it may serve as an early warning that the overall market could be poised for a downturn, as these stocks are generally considered riskier.
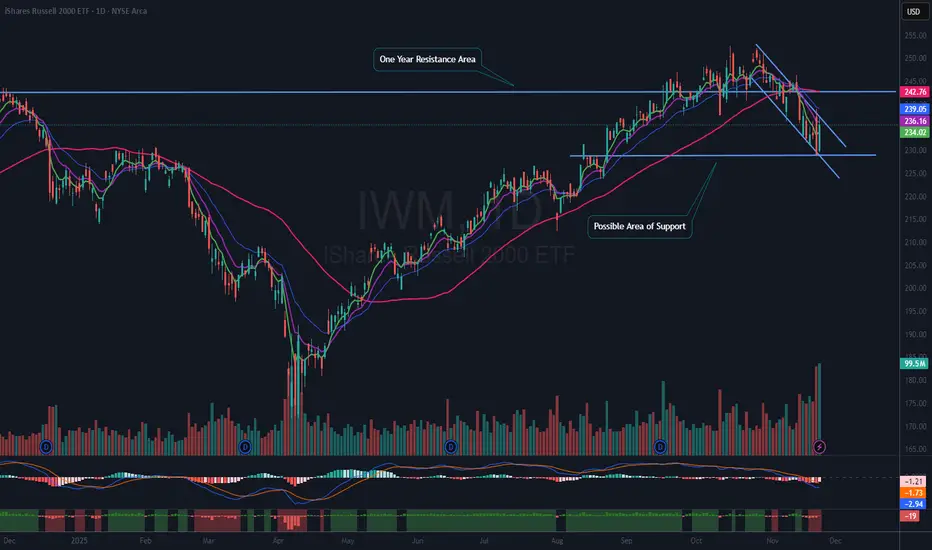
Recent Technical Observations
A review of the chart shows that from mid-September to mid-November, IWM has struggled to remain above a resistance area established one year ago. The ETF has declined about 8.5% from its recent highs and may be forming a flag pattern. There was a strong bounce on Friday, accompanied by heavy volume, but the price remains within the current downtrend.
It appears that IWM may have found support at a previous breakout level, though this is not yet confirmed. The ETF is currently trading well below both the 50-day moving average (red line) and the 21-day exponential moving average (blue line).
Potential Trade Considerations
A trade setup would be of interest if IWM can break above the downtrend line defining the flag pattern and regain the 21 EMA. Should this occur, waiting for the ETF to establish a higher low would provide an opportunity for a favorable risk-reward entry.
Conclusion and Cautions
At present, IWM does not offer a setup that fits the criteria for action within this trading strategy. Nevertheless, it may be worthwhile to add the ETF to a watchlist for future opportunities. All readers are encouraged to perform their own analysis and follow their personal trading rules. It is important to remember that all investments carry inherent risks, and making informed decisions is essential when allocating capital.
IWM ShortRising wedge pattern breaks down.
Price retracing to major support zone below.
RSI has plenty room to go down lower.
Volume elevated on sell-off.
We might revisit quite deep in the supply zone.
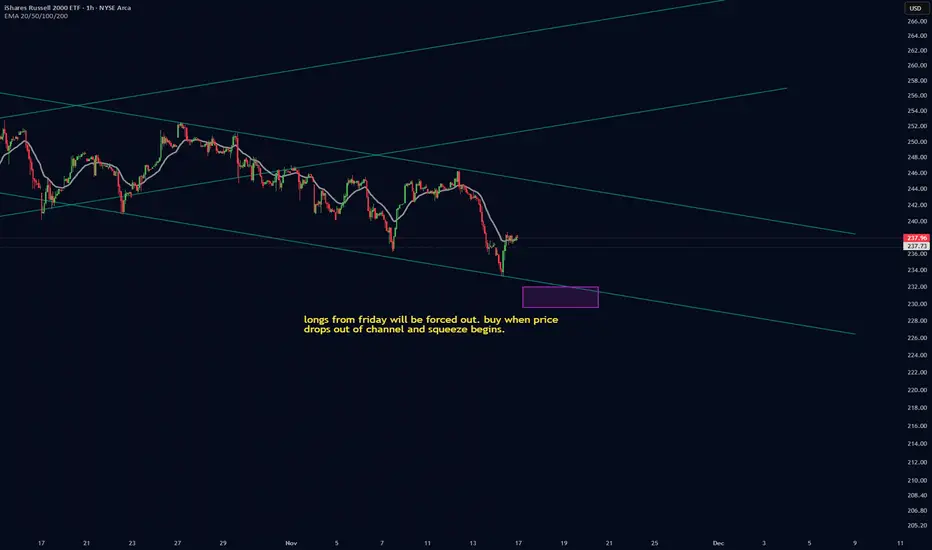
IWM longs will be forced outLongs from friday will be forced out at some point in the next week or two. should be a large move down and a break below the channel that will cause recent longs to exit their positions before the move up. be there to take their long positions when they exit
IWM QuantSignals V3 – Calm Before the MoveIWM QuantSignals Katy 1M Prediction – 2025-11-12
Current Price: $244.10
Final Prediction: $244.59 (+0.20%)
30min Target: $243.99 (-0.05%)
Trend: Neutral
Confidence: 55%
Volatility: 14.4%
Insight:
Katy AI predicts minimal short-term movement
Low confidence and small expected move → no trade recommended
Neutral trend; better to wait for clearer momentum before entering

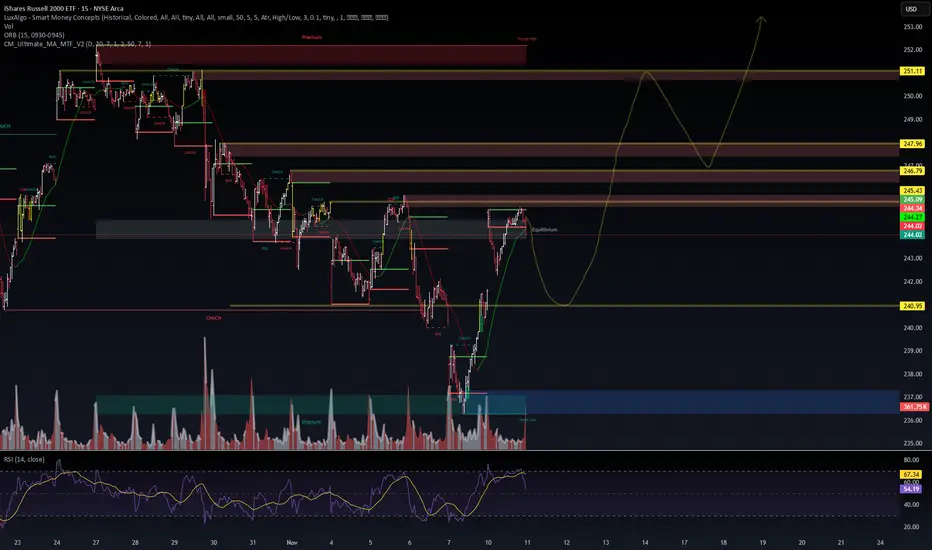
IWM: Inverse H&S Forming? ⚡ WaverVanir Market Intel — AMEX:IWM Outlook (Nov 10 2025)
Setup Summary:
AMEX:IWM consolidates around $244 after reclaiming the mid-discount zone. The Smart Money Concepts framework shows equilibrium retest before a potential push toward $247 – $251. Institutional DSS and ensemble models align with a mild bullish bias (+0.6 – 1.5 % 30-day upside) but emphasize a HOLD stance while liquidity rebalances.
🔍 Technical Structure
Liquidity Zones: $240.9 (demand / discount), $247.9 → $251 (premium liquidity targets)
Key Levels: Equilibrium ≈ $244 | Premium Range $251 | Discount $240.9
Smart Money Signals: CHoCH → BOS → Reclaim pattern suggests potential continuation after equilibrium sweep.
RSI (15 m): Pullback likely → opportunity for re-entry near $241 – $242 zone.
🧠 VolanX / Institutional Model Consensus
DSS Forecast: $245.34 (+1.5 % in 30 days)
Institutional Model: Target $245.46 (+0.6 %), R² = −0.341, Volatility ≈ 3.7 %
Sentiment Score: 39 / 100 (mixed neutral)
Trade Plan: 2 of 9 models bullish → HOLD bias until confirmation of breakout > $247.
🌍 Macro Catalysts & Themes
CPI and Inflation Data (Upcoming Week): A softer print could reinforce risk-on rotation into small-caps.
Fed Outlook: Dovish tone from regional Fed speeches and rising rate-cut probabilities support Russell strength.
Yield Curve Normalization: 2Y yield falling below 4 % spurs rotation from mega-caps to broader equities.
AI + Infrastructure Policy Spending: Fiscal stimulus flows into mid-cap industrials boost AMEX:IWM relative momentum.
Dollar Weakness: TVC:DXY under 105 enhances US exporter appeal, further benefiting $IWM.
🎯 Trading View
Base Case (60 % prob.):
🟩 Re-accumulation → pullback to $241 – $242 → break $247 → extend to $251.
Alternate Case (40 % prob.):
🟥 Failure below $240.9 → retest discount zone $237 – $238 before reactivation.
⚙️ WaverVanir Outlook
“Liquidity seeks expansion — the small-cap cycle reloads. Wait for the sweep, not the hype.”
#WaverVanir #VolanX #IWM #SmartMoneyConcepts #MarketIntel #QuantForecast #Russell2000 #AITrading #InstitutionalFlow #MacroUpdate #RiskOn
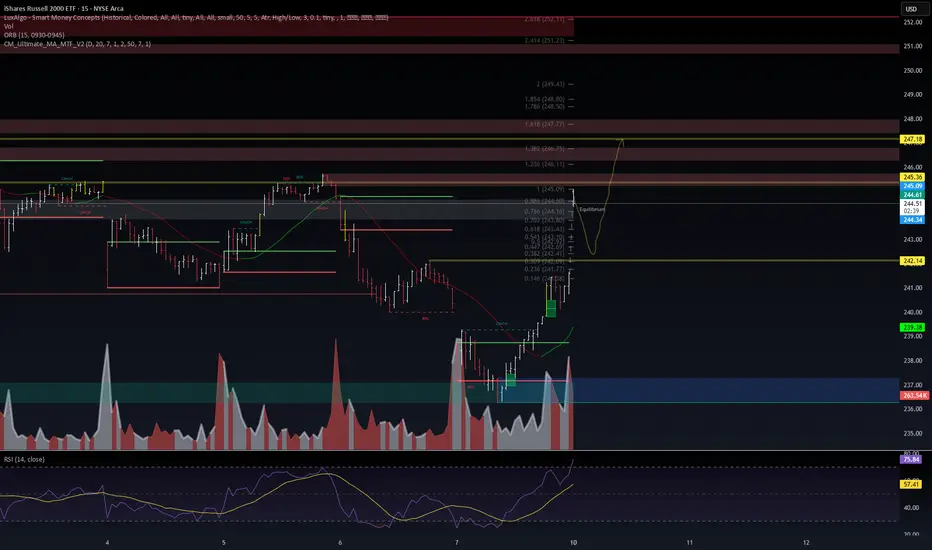
IWM: Trade Setup🧭 IWM 0DTE Setup – Targeting Liquidity Above 246
Symbol: AMEX:IWM (iShares Russell 2000 ETF)
Current Price: 244.34
Session Bias: Short-term bullish → potential exhaustion ahead
🔍 Technical Outlook
Price reclaimed intraday structure after a BOS (Break of Structure) at 241.77.
RSI pushing above 76, signaling strong momentum but entering overbought territory.
Current push aligns with premium retracement zone toward 1.236–1.382 Fibs (246.1–247.2).
Volume surge confirms buyer aggression near FVG fill — liquidity magnet above 245.3 remains active.
🎯 Key Levels
Immediate Resistance: 245.36 → 246.11
Bullish Targets: 247.18 → 247.77 (1.382–1.618 extension)
Reversal Zone: 247.50–248.00 (expect CHoCH / displacement)
Support to Hold: 242.14 → 239.40
⚙️ Execution Plan (0DTE)
Calls: Enter on break/retest of 244.50–245.00 →
TP1: 246.1
TP2: 247.2
TP3: 247.7
Puts (Reversal Fade): Short if rejection forms at 247.5+ targeting 244.5 → 242.0
🧠 VolanX DSS Context
Structure: Bullish
Liquidity Bias: Buy-side imbalance filling
LRG Watch: RSI > 75 triggers reversal guard — expect stall near 247.5
💬 WaverVanir DSS monitors liquidity fractals and market structure across small-cap indices. Expect intraday volatility near equilibrium reclaim.
#IWM #Russell2000 #Options #0DTE #SmartMoneyConcepts #VolanX #WaverVanir
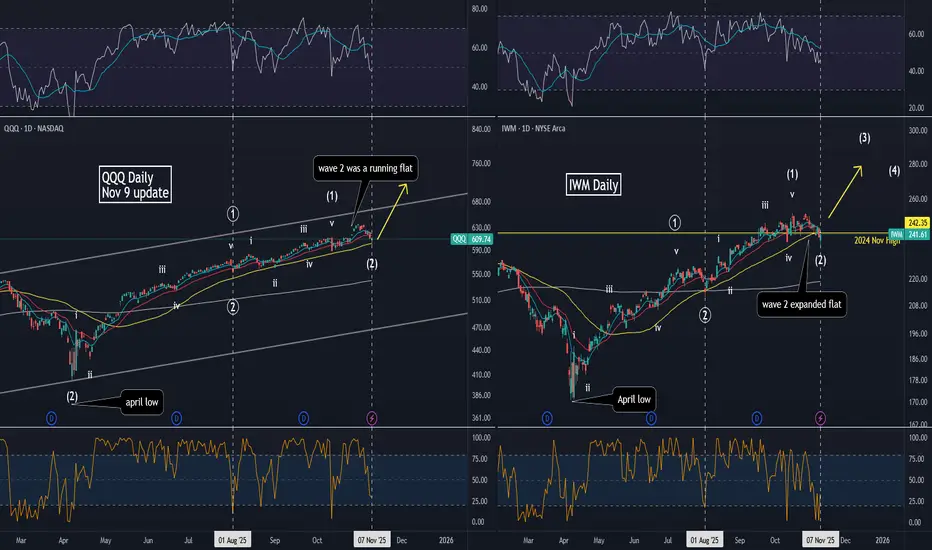
Nov 9: Melt-up wave 3 of (3) starting📈 NASDAQ:QQQ AMEX:IWM (Nov 9 weekend update): index are nesting to the upside with the melt-up wave 3 of (3) starting next week. Signs I see:
1. QQQ price bounced off 50 EMA and closed high with strong volume.
2. Weekly RSI has broken above previous pivot, showing strong momentum. If it were end-stage wave five, it would have shown bearish divergence.
3. IWM chart: price was just testing the key 2024 high. Two sets of wave 2 are clearly seen off the april's low. It's a 12, 12 wave nesting to the upside instead of 1234 wave since April's low because the last high didn't make a higher high in RSI (wave 3 would have made a higher high).
4. The QQQ/SPY chart shows no divergence, which means QQQ is leading and outperforming SPY.
5. Risk-on assets like #Bitcoin stopped dropping and is holding its critical 100K level (also 50 weekly EMA). Bitcoin is making another wave 2, nesting to the upside also.
6. Tech was holding (despite last week's breakdown), while other defensive sectors reset to cause breadth to deteriorate and reset sentiments.
7. If we get a follow-through to the upside on Monday, it confirms this bullish count to the upside.
NASDAQ:NDX SP:SPX AMEX:SPY #Elliottwave #bullish