WSB Contrarian QuantSignals AI Screener 2025-11-06WSB Contrarian QuantSignals AI Screener 2025-11-06
🔥 Most Mentioned Stocks (24h)
NASDAQ:TSLA : 1,754 mentions (1.0x 7d avg)
NASDAQ:NVDA : 751 mentions (1.0x 7d avg)
NASDAQ:HOOD : 384 mentions (1.0x 7d avg)
AMEX:SPY : 333 mentions (1.0x 7d avg)
TSX:VI : 256 mentions (1.0x 7d avg)
AMEX:SPXL : 241 mentions (1.0x 7d avg)
NASDAQ:PLTR : 185 mentions (1.0x 7d avg)
NASDAQ:OPEN : 178 mentions (1.0x 7d avg)
NASDAQ:IREN : 149 mentions (1.0x 7d avg)
NYSE:SNAP : 137 mentions (1.0x 7d avg)
📊 Market Overview
WSB sentiment shows unusual stability with all mention velocities at exactly 1.0x 7-day averages, suggesting potential exhaustion after recent market volatility. High mention concentration in TSLA (33.8% share) indicates retail obsession despite minimal price movement. Most stocks are in technical downtrends with only a few recent gainers showing contrarian potential.
════════════════════════════════════════════════════════════════════════════════
💰 WSB CONTRARIAN SIGNALS
Generated: November 06, 2025 at 10:35 PM
════════════════════════════════════════════════════════════════════════════════
📊 5 Total Opportunities • ✅ 0 Ready to Trade • ⏸️ 5 Monitor
────────────────────────────────────────────────────────────────────────────────
┌─ #1 ⏸️ NASDAQ:TSLA • Score: 57/100 • WAIT
│
│ 📅 DTE: 2-4 days
│ 🟡 Risk Level: Medium Risk (5/10)
│
│ 📰 Catalyst: WSB: 1,754 mentions (1.0x avg, Δ+0, 33.8% share) | Price 1W +1.3%, Vol 1.3x, Gap -0.0%
│ 📊 Setup: PUT contrarian position - Wait for failed bounce above $455, enter puts on weakness below $448
│ 🎯 Target: Target $420.00, Stop $465.00
│ 📈 Options: PUT position via options
│
│ 💡 Wait - Monitor for better entry
│ ⚠️ Risk: Medium risk - Massive 33.8% WSB share dominance despite minimal price action suggests retail exhaustion. Trading near 20-day SMA with high volatility (52.49%) indicates vulnerability. Retail enthusia
Image
sm disconnected from technical reality creates contrarian opportunity.
└───────────────────────────────────────────────────────────────────────────────
┌─ #2 ⏸️ NASDAQ:IREN • Score: 54/100 • WAIT
│
│ 📅 DTE: 1-2 days
│ 🟡 Risk Level: Medium Risk (5/10)
│
│ 📰 Catalyst: WSB: 149 mentions (1.0x avg, Δ+0, 2.9% share) | Price 1W +15.0%, Vol 1.2x, Gap -0.9%
│ 📊 Setup: PUT contrarian position - Enter on any failed attempt to break above $70 resistance
│ 🎯 Target: Target $58.00, Stop $72.00
│ 📈 Options: PUT position via options
│
│ 💡 Wait - Monitor for better entry
│ ⚠️ Risk: High risk - 15% weekly gain with high volatility (122.55%) and significant premium to 20-day SMA (+9.03%) suggests overextension. Recent -12.37% daily performance indicates momentum exhaustion. High WSB attention during crypto volatility creates contrarian setup.
└───────────────────────────────────────────────────────────────────────────────
┌─ #3 ⏸️ NASDAQ:HOOD • Score: 54/100 • WAIT
│
│ 📅 DTE: N/A days
│ 🟡 Risk Level: Medium Risk (5/10)
│
│ 📰 Catalyst: WSB: 384 mentions (1.0x avg, Δ+0, 7.4% share) | Price 1W -8.0%, Vol 1.9x, Gap -1.7%
│ 📊 Setup: AVOID contrarian position - No position - wait for clearer direction
│ 🎯 Target: N/A time horizon
│ 📈 Options: IRON CONDOR exp 2025-11-28 - Iron condor expecting WSB hype to fade
│
│ 💡 Wait - Monitor for better entry
│ ⚠️ Risk: High risk - Already down -7.96% weekly and -15.77% monthly with extreme volatility (76.66%). Trading -6.21% below 20-day SMA suggests oversold conditions. High float turnover (43.46%) indicates capitulation, making contrarian short risky.
└───────────────────────────────────────────────────────────────────────────────
┌─ #4 ⏸️ NASDAQ:PLTR • Score: 53/100 • WAIT
│
│ 📅 DTE: 2-4 days
│ 🟡 Risk Level: Medium Risk (5/10)
│
│ 📰 Catalyst: WSB: 185 mentions (1.0x avg, Δ+0, 3.6% share) | Price 1W -10.0%, Vol 1.5x, Gap +0.0%
│ 📊 Setup: PUT contrarian position - Enter on any bounce toward $180 resistance
│ 🎯 Target: Target $155.00, Stop $18
5.00
│ 📈 Options: PUT position via options
│
│ 💡 Wait - Monitor for better entry
│ ⚠️ Risk: Medium risk - Despite -10.02% weekly performance, still maintains high WSB attention. Trading -4.98% below 20-day SMA but recent selling pressure suggests further downside. High volatility (54.84%) and elevated volume create opportunity for continued decline.
└───────────────────────────────────────────────────────────────────────────────
┌─ #5 ⏸️ NYSE:SNAP • Score: 51/100 • WAIT
│
│ 📅 DTE: 1-2 days
│ 🟡 Risk Level: Medium Risk (5/10)
│
│ 📰 Catalyst: WSB: 137 mentions (1.0x avg, Δ+0, 2.6% share) | Price 1W +5.4%, Vol 3.1x, Gap +17.5%
│ 📊 Setup: SHORT contrarian position - Short on gap fill attempt below $7.50
│ 🎯 Target: Target $6.50, Stop $8.50
│ 📈 Options: SHORT position via options
│
│ 💡 Wait - Monitor for better entry
│ ⚠️ Risk: High risk - Massive 17.53% gap with 9.73% daily gain on high volume (3.08x ratio) suggests unsustainable move. Trading above 20-day SMA after prolonged weakness creates mean reversion opportunity. Low-priced stock prone to WSB volatility.
└───────────────────────────────────────────────────────────────────────────────
────────────────────────────────────────────────────────────────────────────────
📖 QUICK GUIDE:
✅ ENTER NOW → High probability setup, optimal timing, low-medium risk
⏸️ WAIT → Monitor for better entry or catalyst resolution
🟢 Low Risk → Heat 1-3 (stable, far from catalysts)
🟡 Med Risk → Heat 4-6 (moderate volatility)
🔴 High Risk → Heat 7-10 (near catalysts, high volatility)
💎 Position Sizing: 2-5% per trade • Max 2-3 concurrent positions
🎯 Exit Strategy: Take profit at 50% max gain or stop at 2x loss
════════════════════════════════════════════════════════════════════════════════
⚠️ Risk Management
Current environment shows unusually stable WSB mention patterns (all 1.0x velocity) which may indicate sentiment consolidation rather than extreme. Most stocks are already in downtrends, reducing tra
ditional contrarian opportunities. High volatility across multiple names increases stop-loss risks. Market-wide weakness could lead to oversold bounces that stop out contrarian positions prematurely.
💡 Remember: Contrarian trading requires precise timing and strict risk management.
Trade ideas

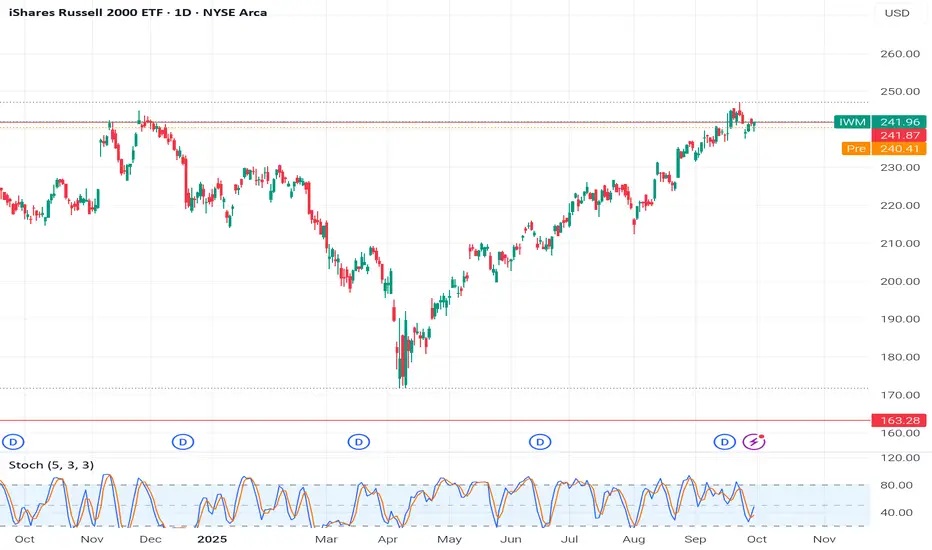
$IWM: BEARS ARE GAINING CONTROL AMEX:IWM appears to be performing worse than the $SPY. The narrowing channel, which looks like a wedge, has broken, and the price has fallen below the December high support level, indicating a potential failure to achieve the new ATH. To make matters worse, it is also dropping below the 10-week simple moving average (SMA) this week. The next level of support is at 237.
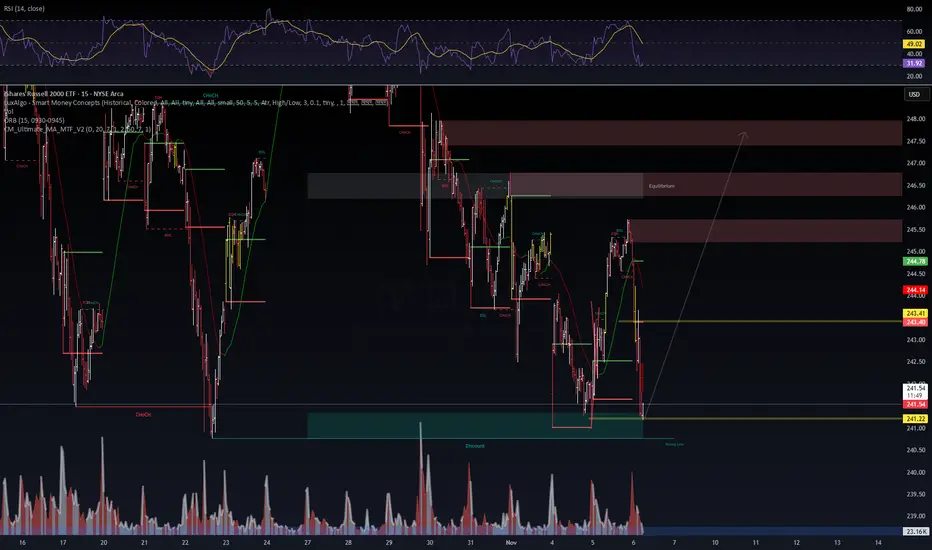
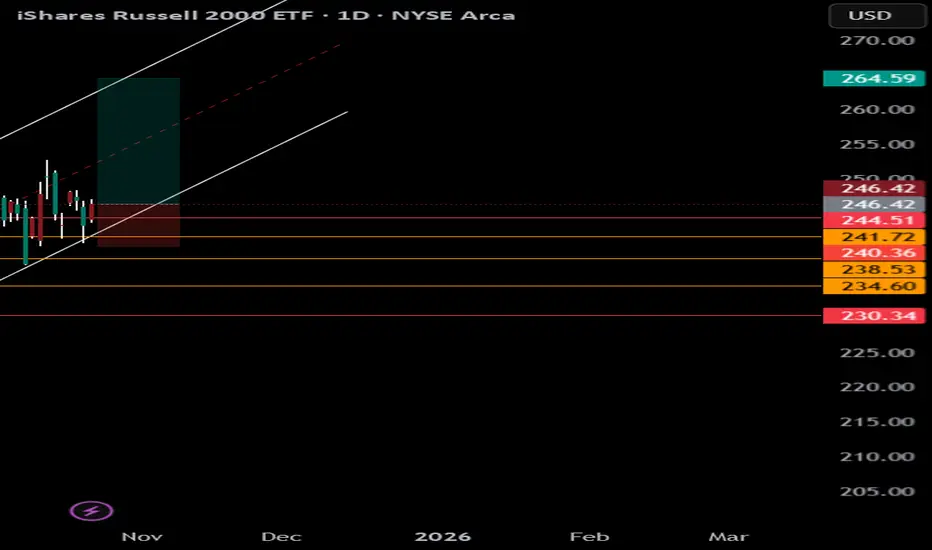
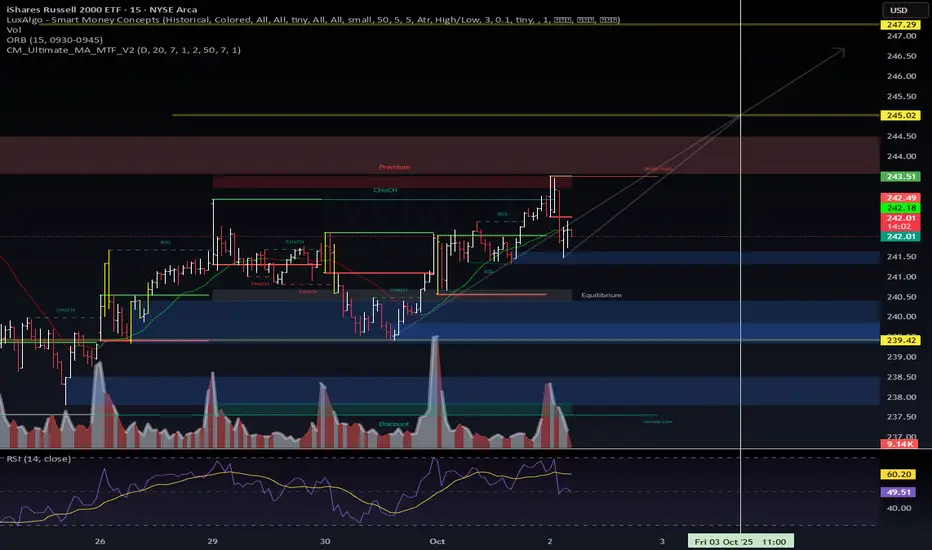
IWM: Trade📊 Trade Context
Symbol: AMEX:IWM (Russell 2000 ETF)
Timeframe: 15-minute
Current Price Zone: $241.20–$241.40
Structure: Clear BOS (Break of Structure) → CHoCH (Change of Character) → Discount zone retest.
RSI: ~29 (oversold), showing early divergence potential.
⚙️ Setup Breakdown
Discount Zone: The green zone marks a liquidity sweep and potential “strong low.”
Confluence:
Volume spike at discount (buyer absorption).
RSI divergence (momentum exhaustion on the downside).
Structural sweep of previous equal lows.
Immediate Resistance: $243.40 → minor supply zone.
Main Target Zone: $246.00–$247.50 (equilibrium and prior inefficiency zone).
🧠 Trade Thesis
Buyers are defending the discount region around $241.00.
Expectation: Liquidity grab → reaccumulation → move toward equilibrium.
Entry: Around $241.20 (discount reaction confirmed with bullish candle).
Stop-loss: Below $240.70 (invalidate if lower low forms).
Take-profit:
TP1: $243.40 (intraframe supply)
TP2: $246.40 (equilibrium)
TP3: $247.50 (full mitigation zone)
🕹️ Execution Plan
Wait for bullish confirmation on smaller timeframes (M5–M1 BOS/CHoCH).
Use reduced size at entry; scale as momentum confirms.
Watch RSI reclaim above 40 — it usually aligns with structural reversal.
⚠️ Risk and Management
Risk/Reward ~1:3.5 (optimal under current volatility).
Avoid adding below $241.00 — zone invalidates below $240.70.
Volume must increase on breakout above $243.40; otherwise, partial exit recommended.
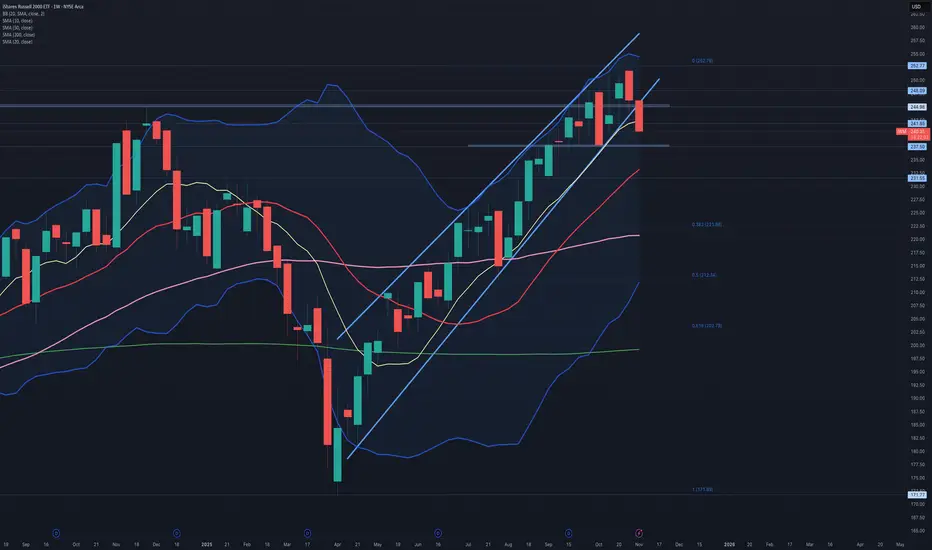
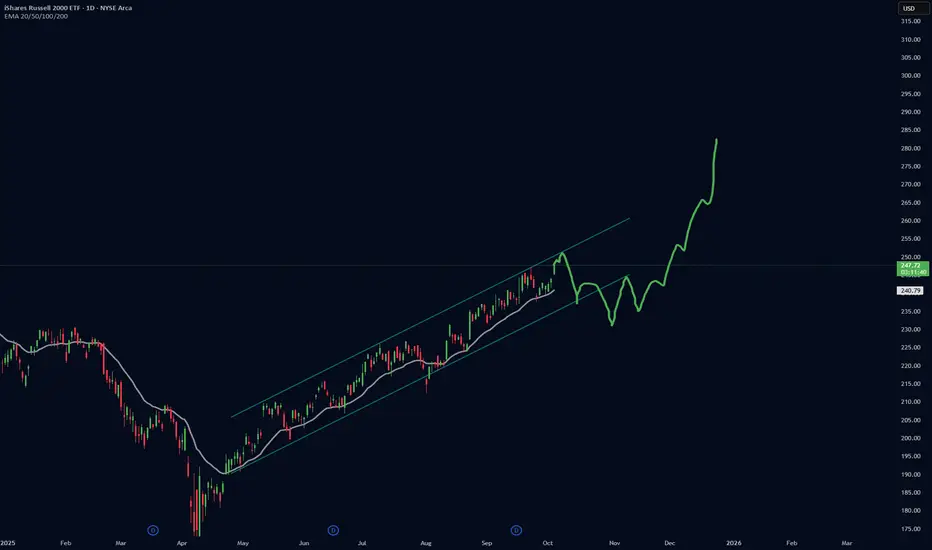
Keep it SimpleSmall Caps have got a very simple regression channel that's near perfect. Keep it simple --- with the Nasdaq 100 taking off, the Russell 2000 is lagging but will get rotated into as the rate drop environment supports smaller companies the most.
80% confidence, big upcoming rally on IWMIWM is showing a pre-bump BARR pattern, Success rate of the pattern is 80-85% and can lead to a 15% rally in IWM within next 4-6 weeks targeting 274.
I would invest in small cap stocks for the next 6 weeks for disproportionate returns.

IWM back test of ATH!IWM back tested all time high which was previous regarded as resistance for many years and have final broken through and back tested will positive follow through, price action is in price discovery!
IWM SHort Targets I believe we just finished a wave 5 and I'm looking for a 3-wave correction. What are your thoughts?

Small Cap Prediction for MondayEvery major index formed a pennant pattern Friday afternoon after the midday drop. I think it's a continuation pattern, which for small caps means a gap fill for IWM.
Not so sure about Tuesday, but I think the pennant breakout is still valid so we'll see it go back up Monday afternoon and/or Tuesday.
I'll try to comment before market open if I have time, keep an eye on futures. I'm guessing we see red Monday morning.
Note: Chart is 15 minutes and this is an index fund so ignore indicators. See my RTY1! 3hr chart posts for indicators.
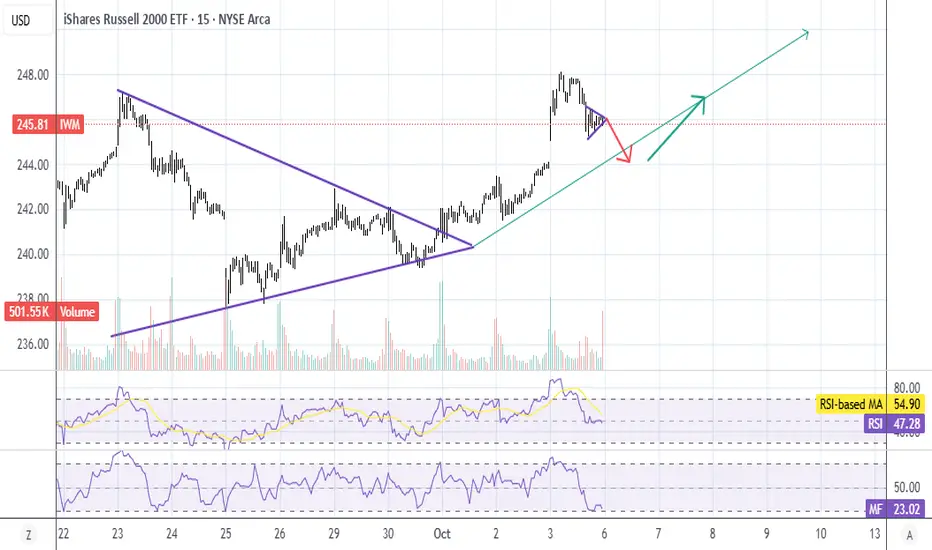
IWM Small Cap Pennant breakout?Looks like a pennant on the index fund, every time it does this it gets very pumptarded. Will post a RTY chart as well.
More of a guessI lack the braincells to formulate ideas, but I like guessing. This is my guess. Do not make any trades based off it, but if it plays out like this please let me know how impressed you are.
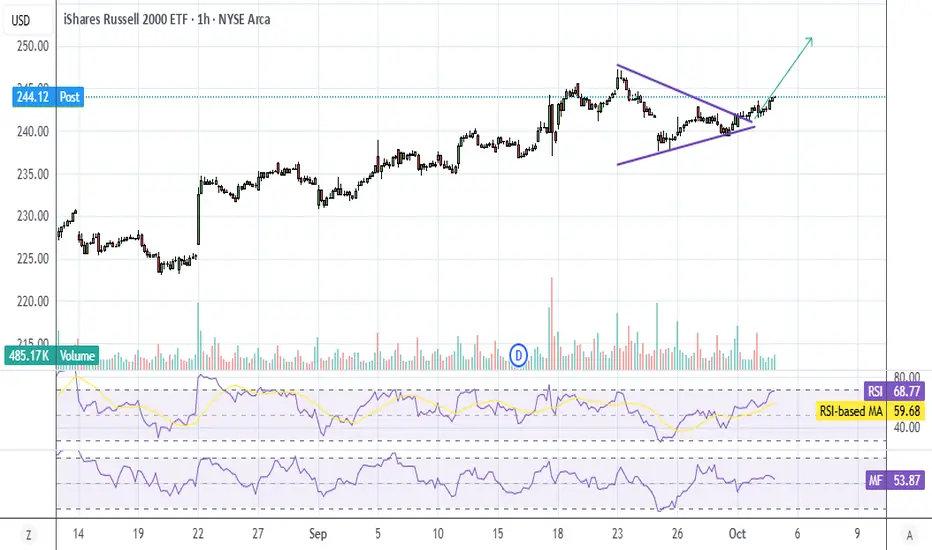
$IWM | Russell 2000 – Intraday Structure Map🟢 AMEX:IWM | Russell 2000 – Intraday Structure Map
📊 Setup
Price respected the discount zone and reclaimed equilibrium.
Current rejection at premium zone (243.5) → marking liquidity grab / weak high.
RSI cooling off from 60+ levels, suggesting consolidation before next leg.
🧩 Market Structure
Multiple CHOCH & BOS signals confirm active rotation.
Higher-timeframe bias supports a possible impulse extension.
Watching wave (3) → (5) projection toward 245.0–247.2 zone.
🎯 Scenarios
Bullish Case (Primary):
Hold >242.0 → reclaim 243.5 → push to 245.0, extension 247.2.
Bearish Case (Alternate):
Fail to hold 242.0 → revisit equilibrium/demand around 239.4.
📌 Summary
AMEX:IWM is building an intraday impulse wave count. Holding above 242.0 keeps the bull case intact with 245–247 in sight. Break below 241.8 flips bias back to demand re-test.
IWM potensial break structure highIWM potensial moving higher. Look at support 231 and target area at least 260-270. it's a long bullish journey.
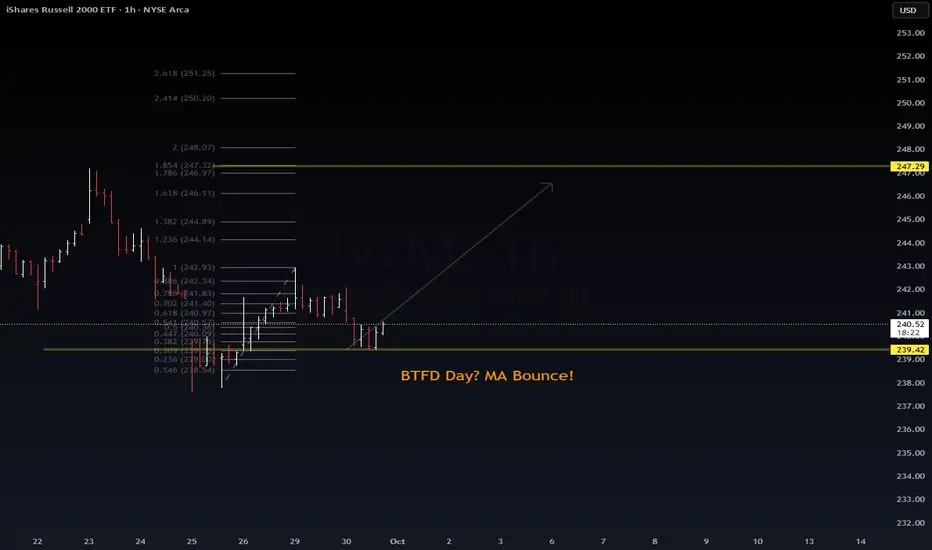
$IWM – Small Caps at Bounce Zone📊 AMEX:IWM – Small Caps at Bounce Zone
Chart Context:
AMEX:IWM pulled back into Fib 0.382–0.5 zone (~239–240).
Price found support exactly at 239.4 pivot → matching MA bounce on daily.
Intraday structure = higher lows forming → possible reversal leg.
🔑 Key Levels
Support: 239.4 (pivot) → 237.6 (strong demand).
Upside Targets:
242.9 (Fib 1.0)
244.9 (1.382)
247.3 (Fib 2.0 extension)
Invalidation: Break below 237.6 negates bullish setup → back toward 234–232.
📈 Trade Bias
Bias: BTFD / Bounce Play while above 239 support.
Scalp Targets → 242–244.
Swing Target → 247–248 if momentum extends.
Risk Management: Tight stops below 237.6.
🧩 Takeaway
AMEX:IWM showing resilience at Fib support. If small caps confirm this bounce, it could spark a broader risk-on move across equities. Watch 239 → 247 range closely.
#IWM #Russell2000 #SPY #Trading #VolanX
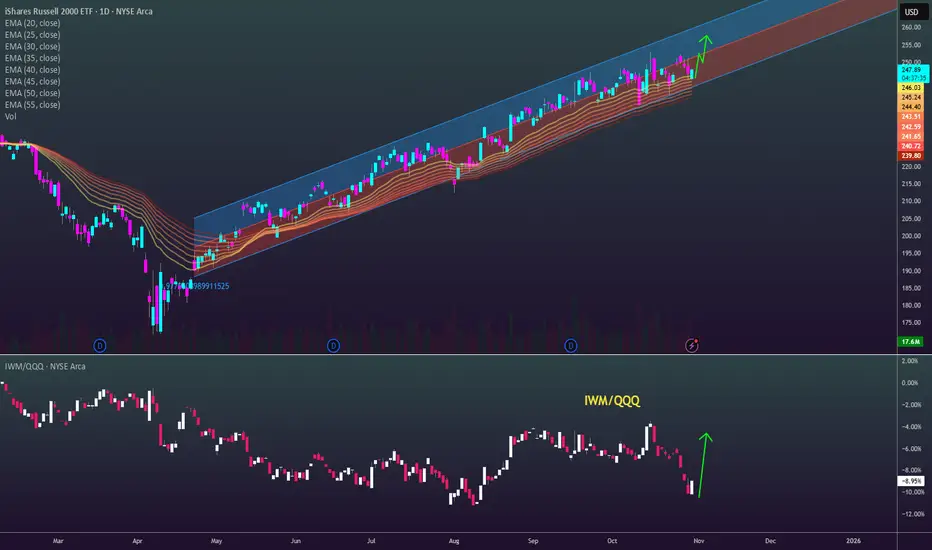
IWM + Total 2Risk-on vs risk-off assets → Both small-cap stocks (IWM) and altcoins (TOTAL2) are considered high-beta, speculative assets. They respond more aggressively to shifts in liquidity, interest rates, and risk appetite.
Liquidity sensitivity → When liquidity is abundant, both IWM and TOTAL2 rally harder than their large-cap counterparts (S&P 500 / Bitcoin). When liquidity tightens, they sell off harder too.
Market breadth / speculative phase → IWM is a gauge of U.S. market breadth (how smaller companies are doing), while TOTAL2 reflects risk-taking beyond Bitcoin. Both act as “speculative barometers.”
Macro correlation → In tightening cycles (higher rates, strong dollar), both tend to lag. In easing/liquidity cycles, they outperform and move almost in lockstep.
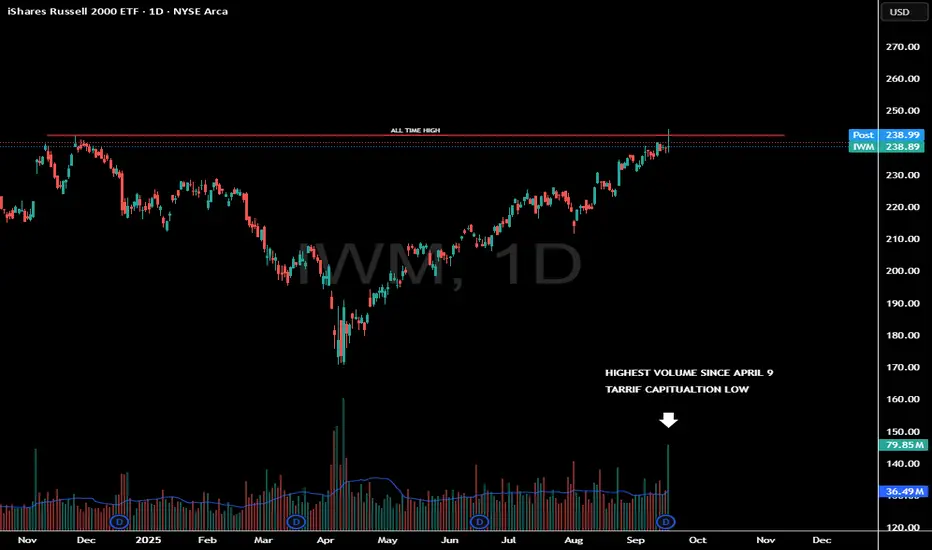
Highest Volume Candle Since Tarriff LowIWM saw a nasty reversal off the all time highs today.
A potential weekly topping tail is building.
What important about this reaction is the amount of volume that was traded.
This was the highest candle since April 9th.
High Volume reversals need to be monitored closely as it does show large money distributed into this strength.
A high volume candle marked the tariff bottom.
Will a high volume candle signal a near term top?
Fib Extension shows possible 5% pullback in IWMso this has worked for a while now. It looks like a pullback off the perfect pin of the 3.618 is possible. Past touches on the 1.618 and 2.618 gave about a 5% pullback. Check it out.
Macro Picture for IWM (Russell 2000)The macro picture for IWM is one of heightened sensitivity to U.S. economic conditions, particularly interest rates. While it has underperformed large-cap indices recently, a favorable shift in monetary policy or a strengthening domestic economy could act as a powerful catalyst for a period of small-cap outperformance. Sector-specific trends, such as the performance of financials and industrials, are key indicators to watch for signals of a broader recovery in the small-cap space.
Small-cap companies tend to carry more debt and are more reliant on bank lending than their large-cap counterparts. This makes them highly sensitive to changes in interest rates. A period of high interest rates or aggressive monetary tightening can disproportionately weigh on IWM, as borrowing costs increase and economic activity slows. Conversely, a period of falling rates or a "soft landing" for the economy can be a significant tailwind for the index. Recent discussions around potential Fed rate cuts could be a positive catalyst for IWM.
Small-cap stocks have underperformed large-cap stocks in recent years. While some valuation metrics like price-to-earnings (P/E) ratios may still appear elevated, other metrics like price-to-sales and price-to-book suggest that small caps may be undervalued relative to the S&P 500. This could present a compelling opportunity for long-term investors if the macro environment improves for these companies
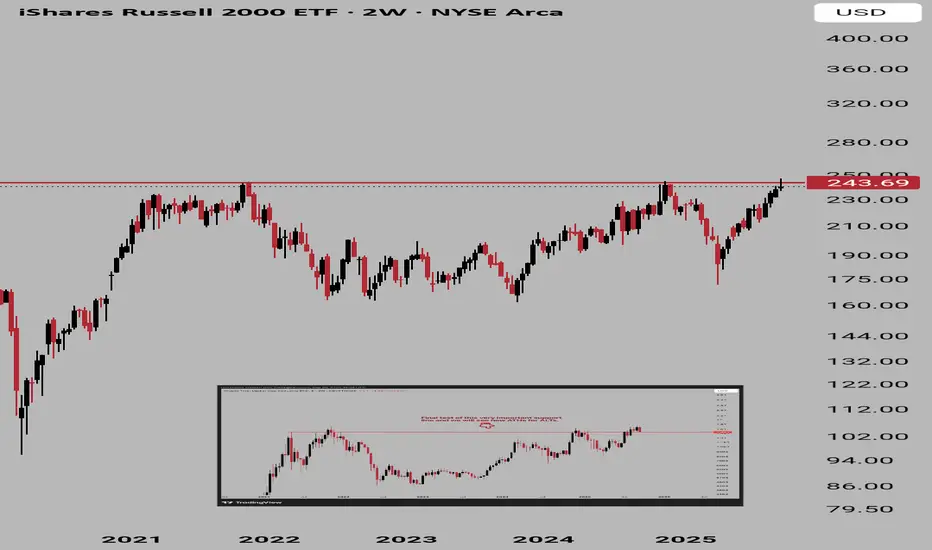
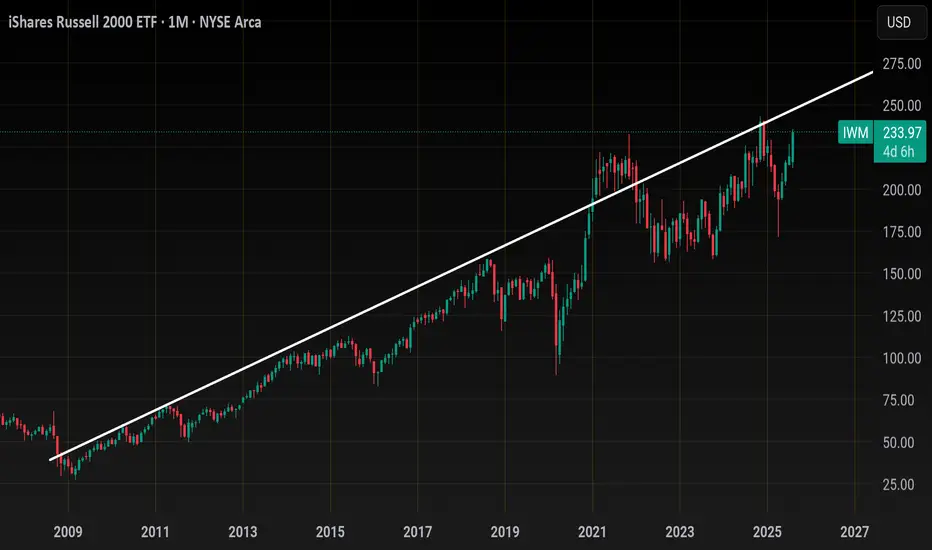
Technical Analysis-Based Ideas: Shorting at a Resistance
The long-term weekly chart shows that IWM is closer to testing a significant, multi-decade resistance line. This level has historically been a ceiling for the price, causing major pullbacks or periods of consolidation. The idea is to bet on a repetition of this pattern so play short at these resistance lines..


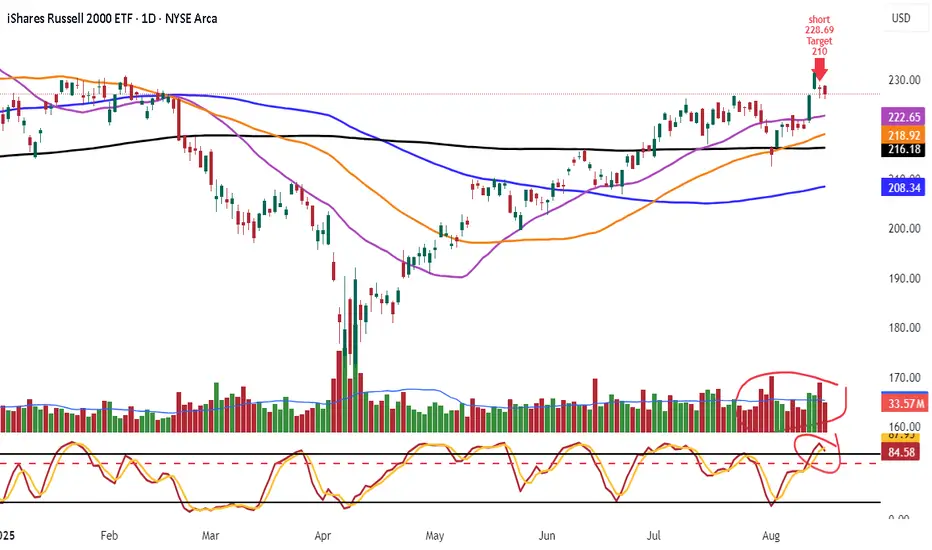
Shorted IWM 228.69 Target 210Look daily chart lower high stoch rolling over
look vol more selling buying
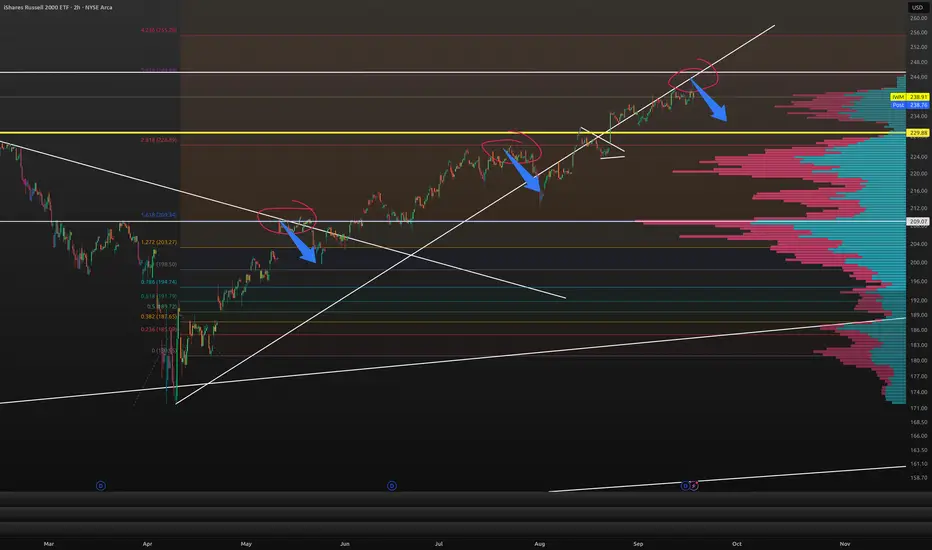
IWM Looks like 240 is incoming, most likely this move comes with a cool Core PCE this Friday and if not then, then most likely on next month job numbers .
Weekly trendline resistance from 2010 has resistance at around 240ish.
That's only another 3% upside
In an extreme move we could see price momentarily push above 240 and tag 245
From 245 I can't see price heading higher going into Seasonality of Sept.. so I'd be looking for a top signal above 240 and a correction from there to 210.00
Here's the price action from April lows..
Simple channel..
I don't think we tag support again until 240 is tested, we could just grind mid channel all the way back to ATH like that Green circle of price I highlighted.. let's see if we get more of a dip towards 230-232 before Friday's core pce , IMO that would be the entry for a final leg up.
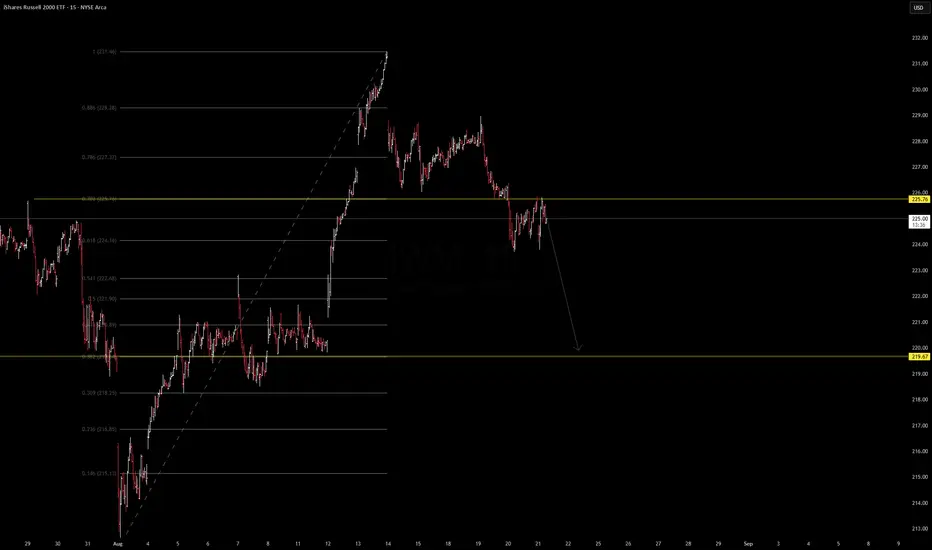
IWM (Russell 2000 ETF) Update - Bearish Analysis. IWM (Russell 2000 ETF) Update
Price rejected from the 226–227 zone (Fib 0.786) and failed to reclaim the breakout structure. Currently consolidating below resistance, which opens room for a possible leg lower.
🔹 Key resistance: 225.7 – 226.0
🔹 Target support: 219.0 zone
🔹 Bias: Short-term bearish unless buyers reclaim above 226
Watching if price accelerates into the 219 demand zone for a potential reaction. Risk management is key in this environment.
IWM Appears Due for a Minimum 40-60% Downside CorrectionOn the lower timeframes IWM has been treating $223 as short term support with much sold put leverage building at $220 and recently IWM has begun to retrace back down into those levels putting those sold puts at risk of expanding the volatility and of squeezing through these short puts as a result.
The short term the loss of this zone could likely squeeze down to $200.
However in the longer term we have been trading within this much larger parallel channel since the peak and bottom of 2008-2009 GFC and have started to form a potential peak paired with a Bearish Shark. I think that if we were to start to see some serious downside the IWM could trade back down to not just the bottom of the channel but down to one of the 3 major horizontal supports I have plotted on the cart down at $121, $85.74, or even $41.11 if things get real bad.
Personally I will be targeting one of the 2 upper horizontal supports in the longer dated positioning while targeting the $210-$200 levels in the short term.
I'd suspect this decline to come especially as Fed Rate cut expectations are completely priced out of the market, it is worth mentioning that fed funds futures around the start of the month dropped their expectations of rate cuts for the September meeting down to 0 and we may now be on the path to pricing in rate hikes as seen in the chart below.
Alternatively the expectations for rates going into the end of December has been on a fast trajectory of pricing out rate cuts as well, starting at 90BPS of rate cuts at the start of the year, now pricing in only 37.5BPS in rate cuts:
This ongoing shift in these fed futures spreads from positive to negative signifies the amount that Fed Funds Futures are expecting the Fed to hike rates with both the instance of rate hikes and rate cuts likely to cause a collapse in credit spreads as the bond market yield shift higher leaving the interest rate sensitive IWM to be one of the most negatively affected.

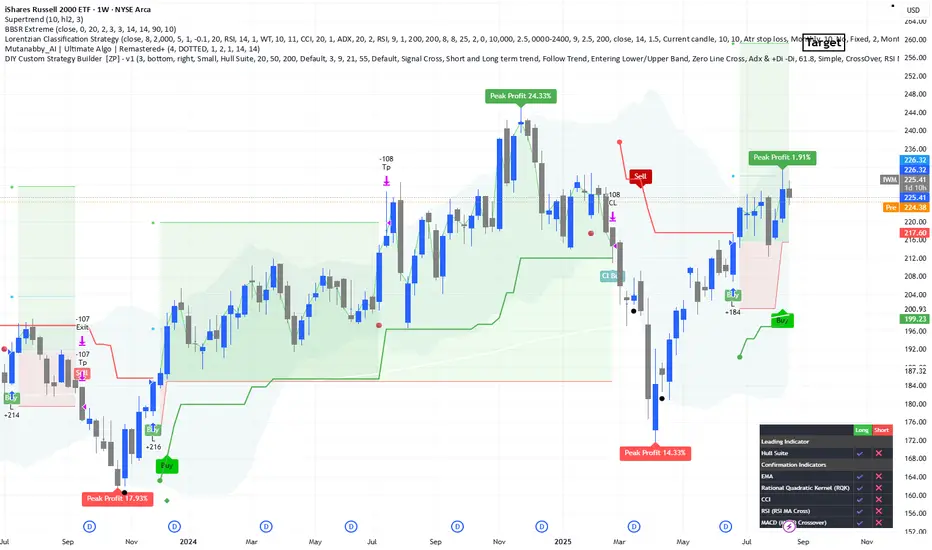
IWM Weekly Setup – Long OpportunitySpotted a promising long setup on the iShares Russell 2000 ETF (IWM) weekly chart. The price action is showing bullish momentum supported by volume and trend indicators.
🔹 Entry Zone: Current levels
🔹 Stop Loss: 196$ – below super trend line
🔹 Target: 260$
Technical indicators and moving averages are aligning for a potential breakout. Risk management is key – keep an eye on volume and macro sentiment.
Let me know your thoughts or if you're watching IWM too!
#IWM #Russell2000 #ETF #TechnicalAnalysis #SwingTrade #TradingSetup #Finance