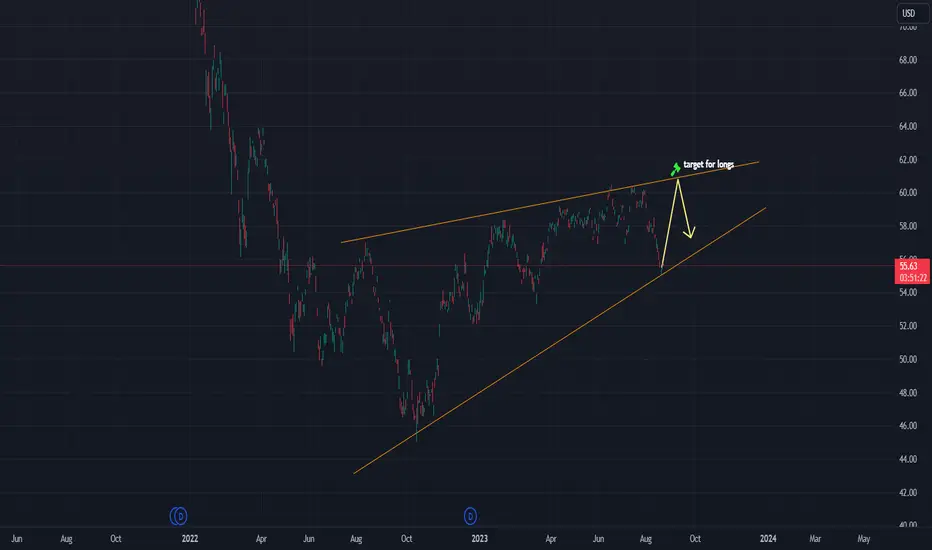
JIG long positionAs we can see on the chart JIG has been uptrending and currently the price is respecting the upsloping support.
We expect the price continue to be in an uptrend, so our strategy is entering a long position now, as the price is retesting the upsloping support.
Target is shown on the chart.
If the
Key stats
About JPMorgan International Growth ETF
Home page
Inception date
May 20, 2020
Structure
Open-Ended Fund
Replication method
Physical
Dividend treatment
Distributes
Distribution tax treatment
Qualified dividends
Income tax type
Capital Gains
Max ST capital gains rate
39.60%
Max LT capital gains rate
20.00%
Primary advisor
JPMorgan Investment Management, Inc.
Distributor
JPMorgan Distribution Services, Inc.
Identifiers
3
ISIN US46641Q3240
JIG actively captures large- and mid-cap stocks in emerging and developed markets excluding US, similar to those in the MSCI ACWI ex-USA Growth index. Within this universe, the funds manager uses a bottom-up approach by reviewing individual securities based on a set of growth, quality and valuation criteria. Companies believed best positioned for sustainable above-average growth are selected for the portfolio. ESG risks are considered, but securities with such risks may still be included in the fund. The fund will invest substantially in securities denominated in foreign currencies. As such, the fund may invest in derivatives such as currency forwards and exchanged-traded futures in managing its risks and cash flow.
Related funds
Classification
What's in the fund
Exposure type
Electronic Technology
Finance
Producer Manufacturing
Stock breakdown by region
Top 10 holdings
Summarizing what the indicators are suggesting.
Oscillators
Neutral
SellBuy
Strong sellStrong buy
Strong sellSellNeutralBuyStrong buy
Oscillators
Neutral
SellBuy
Strong sellStrong buy
Strong sellSellNeutralBuyStrong buy
Summary
Neutral
SellBuy
Strong sellStrong buy
Strong sellSellNeutralBuyStrong buy
Summary
Neutral
SellBuy
Strong sellStrong buy
Strong sellSellNeutralBuyStrong buy
Summary
Neutral
SellBuy
Strong sellStrong buy
Strong sellSellNeutralBuyStrong buy
Moving Averages
Neutral
SellBuy
Strong sellStrong buy
Strong sellSellNeutralBuyStrong buy
Moving Averages
Neutral
SellBuy
Strong sellStrong buy
Strong sellSellNeutralBuyStrong buy
Displays a symbol's price movements over previous years to identify recurring trends.
Frequently Asked Questions
An exchange-traded fund (ETF) is a collection of assets (stocks, bonds, commodities, etc.) that track an underlying index and can be bought on an exchange like individual stocks.
JIG trades at 79.82 USD today, its price has risen 0.90% in the past 24 hours. Track more dynamics on JIG price chart.
JIG net asset value is 79.51 today — it's risen 3.31% over the past month. NAV represents the total value of the fund's assets less liabilities and serves as a gauge of the fund's performance.
JIG assets under management is 383.81 M USD. AUM is an important metric as it reflects the fund's size and can serve as a gauge of how successful the fund is in attracting investors, which, in its turn, can influence decision-making.
JIG price has risen by 3.66% over the last month, and its yearly performance shows a 21.55% increase. See more dynamics on JIG price chart.
NAV returns, another gauge of an ETF dynamics, have risen by 3.31% over the last month, showed a 6.80% increase in three-month performance and has increased by 22.69% in a year.
NAV returns, another gauge of an ETF dynamics, have risen by 3.31% over the last month, showed a 6.80% increase in three-month performance and has increased by 22.69% in a year.
JIG fund flows account for 226.22 M USD (1 year). Many traders use this metric to get insight into investors' sentiment and evaluate whether it's time to buy or sell the fund.
Since ETFs work like an individual stock, they can be bought and sold on exchanges (e.g. NASDAQ, NYSE, EURONEXT). As it happens with stocks, you need to select a brokerage to access trading. Explore our list of available brokers to find the one to help execute your strategies. Don't forget to do your research before getting to trading. Explore ETFs metrics in our ETF screener to find a reliable opportunity.
JIG invests in stocks. See more details in our Analysis section.
JIG expense ratio is 0.55%. It's an important metric for helping traders understand the fund's operating costs relative to assets and how expensive it would be to hold the fund.
No, JIG isn't leveraged, meaning it doesn't use borrowings or financial derivatives to magnify the performance of the underlying assets or index it follows.
In some ways, ETFs are safe investments, but in a broader sense, they're not safer than any other asset, so it's crucial to analyze a fund before investing. But if your research gives a vague answer, you can always refer to technical analysis.
Today, JIG technical analysis shows the buy rating and its 1-week rating is strong buy. Since market conditions are prone to changes, it's worth looking a bit further into the future — according to the 1-month rating JIG shows the strong buy signal. See more of JIG technicals for a more comprehensive analysis.
Today, JIG technical analysis shows the buy rating and its 1-week rating is strong buy. Since market conditions are prone to changes, it's worth looking a bit further into the future — according to the 1-month rating JIG shows the strong buy signal. See more of JIG technicals for a more comprehensive analysis.
Yes, JIG pays dividends to its holders with the dividend yield of 2.07%.
JIG trades at a premium (0.39%).
Premium/discount to NAV expresses the difference between the ETF’s price and its NAV value. A positive percentage indicates a premium, meaning the ETF trades at a higher price than the calculated NAV. Conversely, a negative percentage indicates a discount, suggesting the ETF trades at a lower price than NAV.
Premium/discount to NAV expresses the difference between the ETF’s price and its NAV value. A positive percentage indicates a premium, meaning the ETF trades at a higher price than the calculated NAV. Conversely, a negative percentage indicates a discount, suggesting the ETF trades at a lower price than NAV.
JIG shares are issued by JPMorgan Chase & Co.
JIG follows the No Underlying Index. ETFs usually track some benchmark seeking to replicate its performance and guide asset selection and objectives.
The fund started trading on May 20, 2020.
The fund's management style is active, aiming to outperform its benchmark index by actively selecting and adjusting assets. The goal is to achieve returns that exceed those of the index the fund tracks.